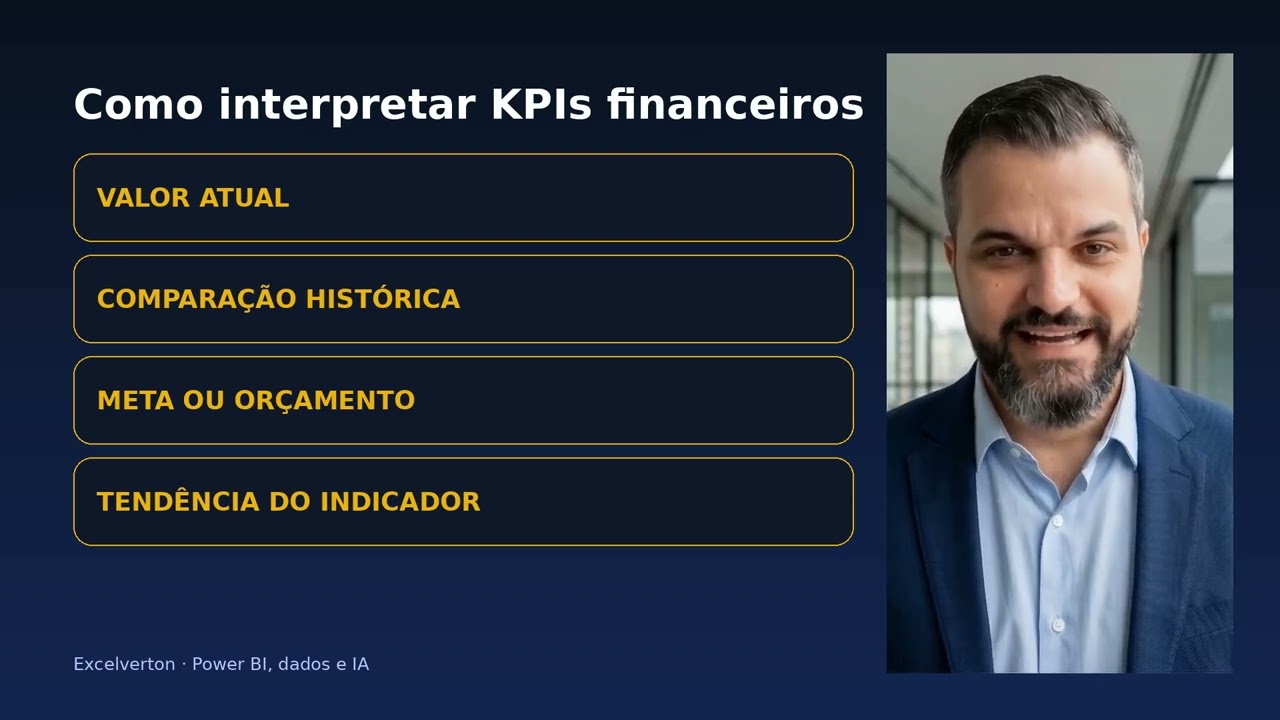
SaaS catalog

SaaS dashboard catalog

Explore 15,162 dashboards organized by area. Learn, get inspired and build.

Turn this dashboard into a decision

Use the AI chat to interpret dashboards and tell us which resources or content should come next.

06 - 04 Filled Maps

This report may show filled maps, offering a richer visual representation of data.

Operations 👁 53

06 - 02 Conditional Column Visual Header and Sorting

This report may present conditional columns in visual headers and sorting.

Operations 👁 53

Data Analytics Of Revenue In Hospitality Domain

This report analyzes revenue in the hospitality sector, providing insights into financial performance.

Operations 👁 53

DashbordDW_Project

This report appears to be a data warehouse project, possibly focused on data analysis.

Operations 👁 53

DB Patients

This report likely shows data about patients and their information.

Healthcare 👁 53

Customer_Churn_Demographics

Report on the demographics of customers who have churned from services or products.

Marketing 👁 53

CustomerBehavior

This report examines customer behavior in different contexts.

Marketing 👁 53

Cookie Creations

This report shows cookie creations, possibly for digital marketing campaigns.

Marketing 👁 53

Classicmodels_Dashboard

This report appears to be a dashboard version for analyzing classic models, focusing on operational data.

Operations 👁 53

Classic models sales dashboard

This dashboard presents sales data of classic models, helping to understand sales performance.

Sales 👁 53

Call Centre Solution

This report presents solutions to optimize call center operations, addressing efficiency and customer service.

Operations 👁 53

CS2 Using Files as a Data Source

This report teaches how to use files as a data source in Power BI.

Education 👁 53

Buttons Bookmark and URL

This report demonstrates the use of buttons and bookmarks in Power BI.

Other 👁 53

Banking Dashboard (2025)

This report presents financial data for the banking sector for the year 2025.

Finance 👁 53

Azure_Test01

This report is a test in Azure, possibly to validate system configuration and functionality.

Operations 👁 53

Awesome choclate

Report on chocolates, possibly analyzing sales or consumer preferences.

Marketing 👁 53

ECOMMERCE_DASHBOARD_USING_POWERBI

This report features a control panel for e-commerce, showing sales metrics and online performance.

Marketing 👁 53

Covid-19-Vaccination-Advanced

Advanced report on Covid-19 vaccination, with detailed data.

Healthcare 👁 53

Data visualizations project

This data visualizations project likely focuses on creating visual representations of datasets.

Other 👁 53

Churn dataset

Dataset on churn, analyzing customer retention.

Operations 👁 53

Amazon-Dashboard

This report provides insights on Amazon sales.

Sales 👁 53

Ali General Sales Complex Dashboard Design

This report presents the dashboard design for the Ali General sales complex.

Sales 👁 53

Creating Hierarchies and Groups

This report covers creating hierarchies and groups in a BI tool.

IT 👁 53

CoffeeShop_PowerBi

This report is a Power BI project for a coffee shop, possibly focusing on operations.

Operations 👁 53
YouTube

Recent YouTube content

Watch the latest videos and keep exploring dashboard, data and AI examples.

New

Subscribed to our channel? Get Pro for free

Subscribe to our YouTube channel and unlock the Pro plan at no cost.

Want a dashboard like this with your data?

We build a custom version for your business — US$ 50 per page, delivered within 7 calendar days.

AI Assistant Ask about dashboards