22h
Analyzing a Fictional HR Dashboard in Power BI: How to Read People Data
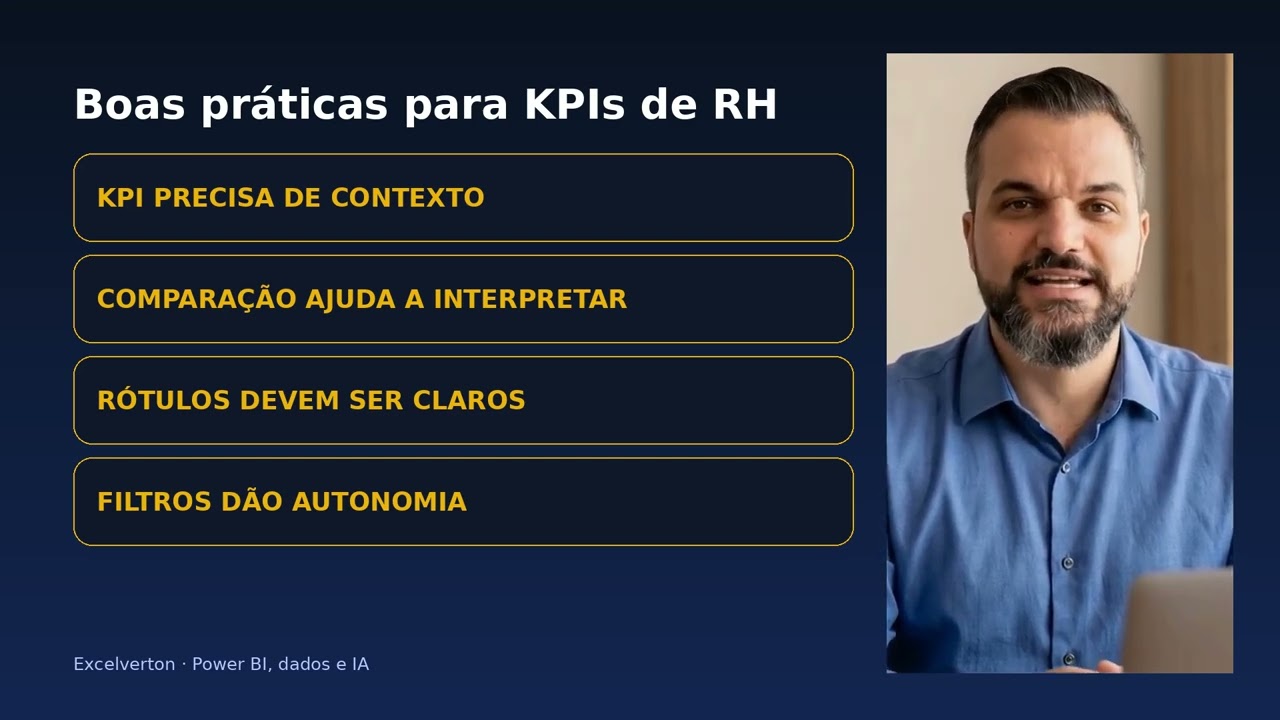
In this video, we analyze a fictional HR dashboard in Power BI and evaluate how people data appears in practice. We go through the overview of the da…
Watch on YouTube