Support the channel and unlock everything
Many more AI messages per month, unlimited template downloads and full catalog access.
See the Pro planExplore ready-to-use dashboards, organized by business area
Many more AI messages per month, unlimited template downloads and full catalog access.
See the Pro planAsk about KPIs, get interpretations and find the right dashboard for your problem.
Open the assistantReady-made dashboards with synthetic data: view them live for free and download as a channel subscriber.
Browse templates
Explore 603 dashboards organized by area. Learn, get inspired and build.
Demo dashboard for a blog with data from August 2019, focused on content and audience metrics.
This report analyzes email marketing data, helping to optimize future campaigns.
DIO challenge report using Power BI for data analysis.
This report is a data analysis challenge using Power BI, focused on demonstrating analytical skills.
Report that may analyze sales and product popularity of the pizzeria DeliciousPizza.
This report analyzes electronics sales, providing insights on market performance.
Practical case report, possibly used for training or demonstration.
This report presents a customer lifetime value matrix, helping to understand customer profitability.
Mobile data analysis, possibly focusing on trends or mobile app performance.
This report provides an overview of customer purchases, highlighting the most popular products.
Analysis of election ads, possibly showing campaign effectiveness.
This report analyzes computer brands, possibly comparing performance and popularity.
This generic report on chocolate does not provide specific information.
This report presents a global market chart, useful for analyzing market trends.
This report analyzes the food and beverage industry, providing market insights.
This report analyzes emoji usage in communications, possibly to understand customer engagement.
This report may be an initial data visualization in donut chart format.
BI report analyzing the sales performance of the pizzeria DeliciousPizza.
Modified report that provides insights into the company's marketing metrics.
Customer churn analysis report, detailing reasons and patterns of customer loss.
This report analyzes consumer shopping behavior, identifying trends and consumption patterns.
This report shows monthly customer acquisition in 2023, allowing analysis of trends and performance throughout…
This report analyzes the churn rate, showing the percentage of customers who stopped using the service during …
This report focuses on customer retention, analyzing churn rates and their causes.
Professional dashboards built by the Excelverton factory: view them live, download the full project and adapt it to your data. 100% our own content, synthetic data.
Plataforma de Dashboards e IA helps companies turn operational data into decisions, automations and insights using AI, APIs and integrated dashboards.
Watch the latest videos and keep exploring dashboard, data and AI examples.
Control turns an impression into a more reliable test. Setting environment, duration, measures, and groups before observing results reduces bias and …
Watch on YouTube
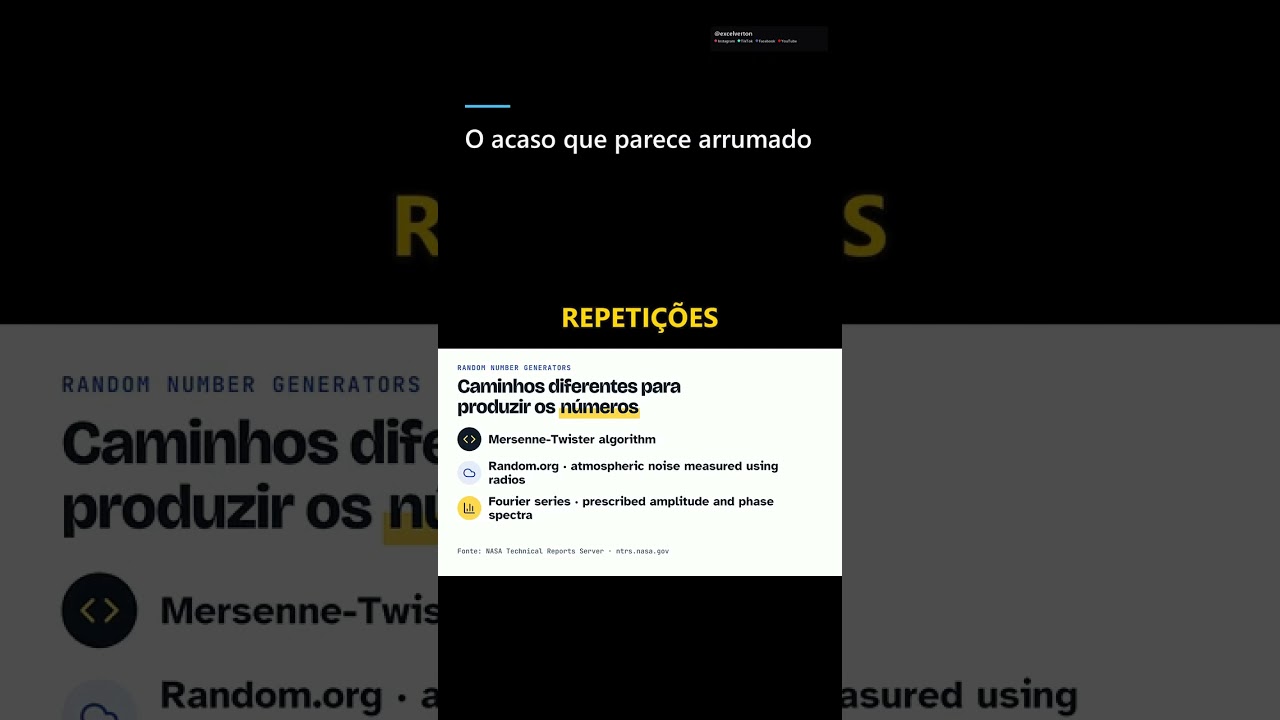
A random sequence doesn't need to look organized. Perfect alternations may seem more "random," while repetitions raise suspicion. But similar probabi…
Watch on YouTube
The Murchison meteorite became a valuable sample for investigating molecules. In the laboratory, researchers analyzed its dust and used chemical tran…
Watch on YouTubeWe build a custom version for your business — US$ 50 per page, delivered within 7 calendar days.