Support the channel and unlock everything
Many more AI messages per month, unlimited template downloads and full catalog access.
See the Pro planExplore ready-to-use dashboards, organized by business area
Many more AI messages per month, unlimited template downloads and full catalog access.
See the Pro planAsk about KPIs, get interpretations and find the right dashboard for your problem.
Open the assistantReady-made dashboards with synthetic data: view them live for free and download as a channel subscriber.
Browse templates
Explore 603 dashboards organized by area. Learn, get inspired and build.
Report on customer churn, analyzing customer loss.
This report analyzes a loyalty program for airline customers, highlighting engagement and satisfaction metrics…
This report analyzes email marketing data, possibly focusing on campaigns and engagement.
This report shows cookie creations, possibly for digital marketing campaigns.
This report analyzes the performance of the 2024 Cricket World T20, including game and player statistics.
The ECommerce Sample is a sample report demonstrating online sales data analysis.
Project related to Amazon Prime, possibly focusing on sales or marketing.
This report appears to be an assignment related to Adidas data analysis.
Performance analysis of Fantasy Premier League players.
The airline loyalty dashboard analyzes customer loyalty and their interactions.
This report analyzes customer practices, helping to better understand their needs and behaviors.
Report about the use of Power BI at Amazon, focusing on data analyses.
This report analyzes e-commerce data, possibly focusing on sales and trends.
This report demonstrates marketing trends and blog engagement during November 2019, analyzing post performance…
This creative data analytics report offers an in-depth view of performance metrics.
This report may show the growth of internet users, relevant for marketing strategies.
This report analyzes customer churn during a virtual internship at PWC.
This dashboard presents metrics and KPIs of ABC company, providing an overview of performance.
Twitter data analysis project using Power BI for insights on engagement and social media trends.
This report focuses on the visual presentation of marketing data.
This report provides an analysis of Google trends using Power BI.
Challenge report using Power BI for data analysis.
Data analysis of Deliveroo, possibly focusing on delivery performance and customer satisfaction.
Report providing insights on sales and customer preferences of the pizzeria DeliciousPizza.
Professional dashboards built by the Excelverton factory: view them live, download the full project and adapt it to your data. 100% our own content, synthetic data.
Plataforma de Dashboards e IA helps companies turn operational data into decisions, automations and insights using AI, APIs and integrated dashboards.
Watch the latest videos and keep exploring dashboard, data and AI examples.
Control turns an impression into a more reliable test. Setting environment, duration, measures, and groups before observing results reduces bias and …
Watch on YouTube
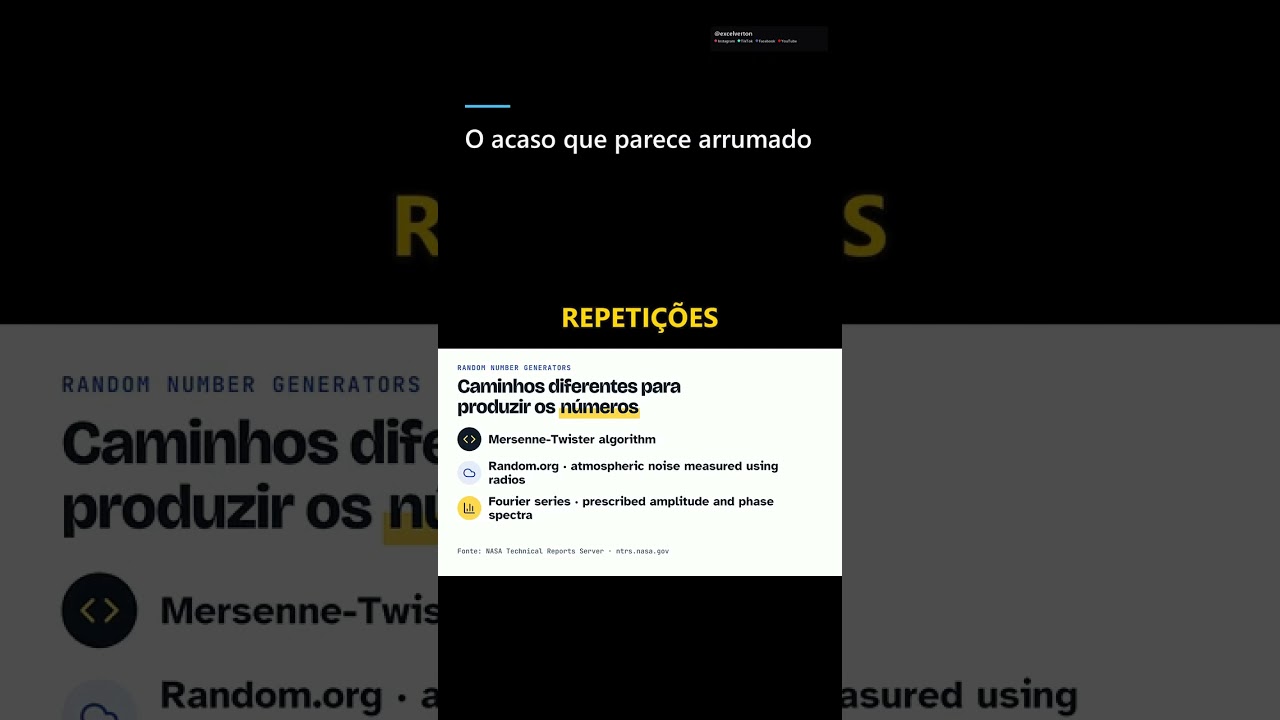
A random sequence doesn't need to look organized. Perfect alternations may seem more "random," while repetitions raise suspicion. But similar probabi…
Watch on YouTube
The Murchison meteorite became a valuable sample for investigating molecules. In the laboratory, researchers analyzed its dust and used chemical tran…
Watch on YouTubeWe build a custom version for your business — US$ 50 per page, delivered within 7 calendar days.