Support the channel and unlock everything
Many more AI messages per month, unlimited template downloads and full catalog access.
See the Pro planExplore ready-to-use dashboards, organized by business area
Many more AI messages per month, unlimited template downloads and full catalog access.
See the Pro planAsk about KPIs, get interpretations and find the right dashboard for your problem.
Open the assistantReady-made dashboards with synthetic data: view them live for free and download as a channel subscriber.
Browse templates

Explore 13,191 dashboards organized by area. Learn, get inspired and build.
This dashboard provides an overview of data collected from professionals, allowing quick analysis.
This report presents a sales dashboard with metrics and performance indicators.
Corona project, possibly a report on data related to the pandemic.
Report analyzing a Power BI dataset.
This report analyzes solution sales, focusing on performance and results.
This report analyzes solution sales, emphasizing market trends.
This report may present an overview of sales over a certain period.
Pizza model dashboard, possibly a visualization for a pizzeria business.
This report explores iterative functions in data analysis, allowing deeper insights.
Executive summary of Adventure Works, presenting an overview of the business.
This report appears to be a drawing tool and does not have a clear business description.
Report on car sales in the United States, focusing on regional data.
This report may show sales count over a given period.
This report appears to be a generic name and does not provide clear information about its content.
General human resources report, covering various metrics and analyses.
This report is a simplified version of a human resources control panel.
This report shows grocery sales but is generic and lacks detailed information.
This report appears to be a food forecasting assignment, aiding inventory management.
This report analyzes final financial data, providing an overview of the company's finances.
This report presents an overview of the company's finances for the year 2025, including revenues, expenses, an…
This report analyzes the company's financial flow, including inflows and outflows.
This dashboard analyzes food delivery costs and profitability, using financial data.
This financial analysis dashboard provides insights into the company's financial performance.
This report presents a control panel for ecommerce sales performance, including key metrics and interactive vi…
Professional dashboards built by the Excelverton factory: view them live, download the full project and adapt it to your data. 100% our own content, synthetic data.
Plataforma de Dashboards e IA helps companies turn operational data into decisions, automations and insights using AI, APIs and integrated dashboards.
Watch the latest videos and keep exploring dashboard, data and AI examples.
Static screen, map, or augmented reality: which consumes more energy? The more the components work, the higher the power consumption and heat generat…
Watch on YouTube
Control turns a print into a more reliable test. Setting environment, duration, measures, and groups before observing results reduces bias and helps …
Watch on YouTube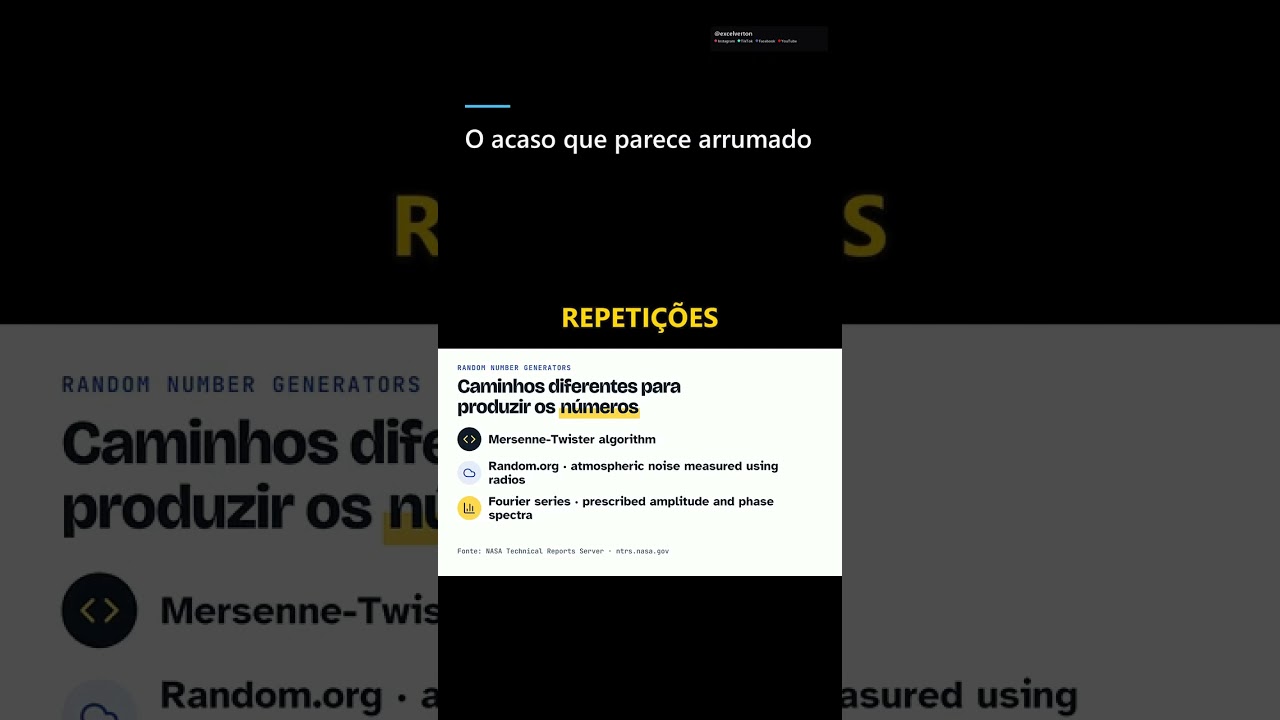
A random sequence doesn't need to look organized. Perfect alternations may seem more “random,” while repetitions raise suspicion. But similar probabi…
Watch on YouTubeWe build a custom version for your business — US$ 50 per page, delivered within 7 calendar days.