Support the channel and unlock everything
Many more AI messages per month, unlimited template downloads and full catalog access.
See the Pro planExplore ready-to-use dashboards, organized by business area
Many more AI messages per month, unlimited template downloads and full catalog access.
See the Pro planAsk about KPIs, get interpretations and find the right dashboard for your problem.
Open the assistantReady-made dashboards with synthetic data: view them live for free and download as a channel subscriber.
Browse templates

Explore 13,191 dashboards organized by area. Learn, get inspired and build.
This report may provide an overview of sales solutions of the company BeansSolutions.
Exercise report, possibly related to an academic project.
This report is a task without a clear description but may involve aspects of data analysis.
This report analyzes the best-selling books on Amazon, providing insights into reading trends.
This report presents an Amazon sales dashboard, allowing users to view sales metrics.
This report provides an overview of Amazon Prime's performance up to 2021.
This report is a version of the Aceso report, focusing on human resources data analysis.
Atliq sales insight project focusing on market performance and trends.
Practice question 31 in Power BI, focused on data analysis and visualization for learning.
This report may contain information about the market, including trends and analyses.
This report covers the use of pivot tables for data analysis.
This report analyzes data from the 2019 elections, providing insights into electoral results.
This report provides sales data, useful for product performance analysis.
This report analyzes Covid-19 data, offering insights into the pandemic's evolution.
This report presents sales data, but the specific content is unclear.
This dashboard presents data on customers who have churned, allowing detailed churn analysis.
This report analyzes chocolate sales, identifying patterns and trends.
This report presents a sales dashboard, possibly for a sales team.
This report features a control panel for e-commerce, showing sales metrics and online performance.
This report provides insights on Amazon sales.
This report presents a coffee shop sales dashboard, showing performance metrics and sales over time.
Chapter 5 focused on advanced use of DAX for calculations and measures in Power BI, improving analyses and rep…
This report analyzes drug sales data, offering insights into sector performance.
Exercise report on adding a calculated table and column, focused on learning.
Professional dashboards built by the Excelverton factory: view them live, download the full project and adapt it to your data. 100% our own content, synthetic data.
Plataforma de Dashboards e IA helps companies turn operational data into decisions, automations and insights using AI, APIs and integrated dashboards.
Watch the latest videos and keep exploring dashboard, data and AI examples.
Static screen, map, or augmented reality: which consumes more energy? The more the components work, the higher the power consumption and heat generat…
Watch on YouTube
Control turns a print into a more reliable test. Setting environment, duration, measures, and groups before observing results reduces bias and helps …
Watch on YouTube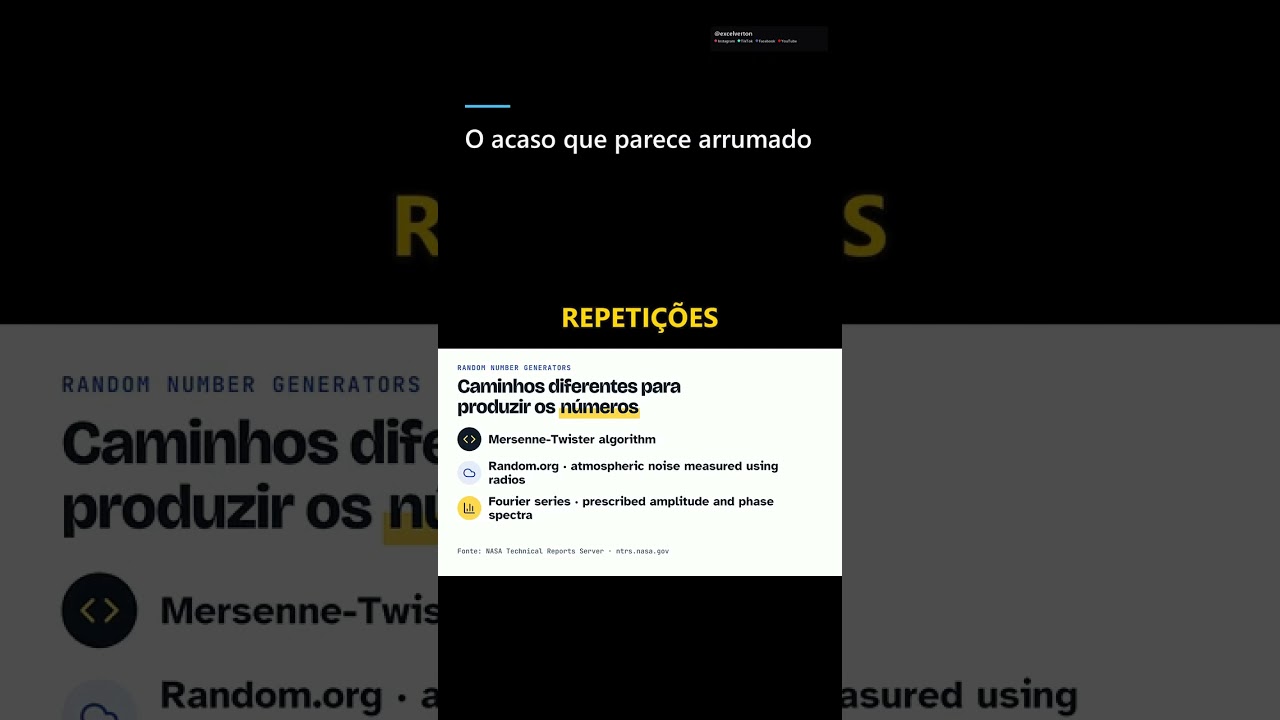
A random sequence doesn't need to look organized. Perfect alternations may seem more “random,” while repetitions raise suspicion. But similar probabi…
Watch on YouTubeWe build a custom version for your business — US$ 50 per page, delivered within 7 calendar days.