Inventory Management Analysis
This report analyzes inventory management, including stock levels and turnover.
Create a free account
Save your favorite dashboards, get new templates by area and ask the AI assistant — for free.
About the Inventory Management Analysis dashboard
This is a free Power BI dashboard called Inventory Management Analysis, in the Logística domain. Explore KPIs, interactive visualizations and get inspired for your own data and business intelligence projects.
This report analyzes inventory management, including stock levels and turnover.
Dashboard analysis
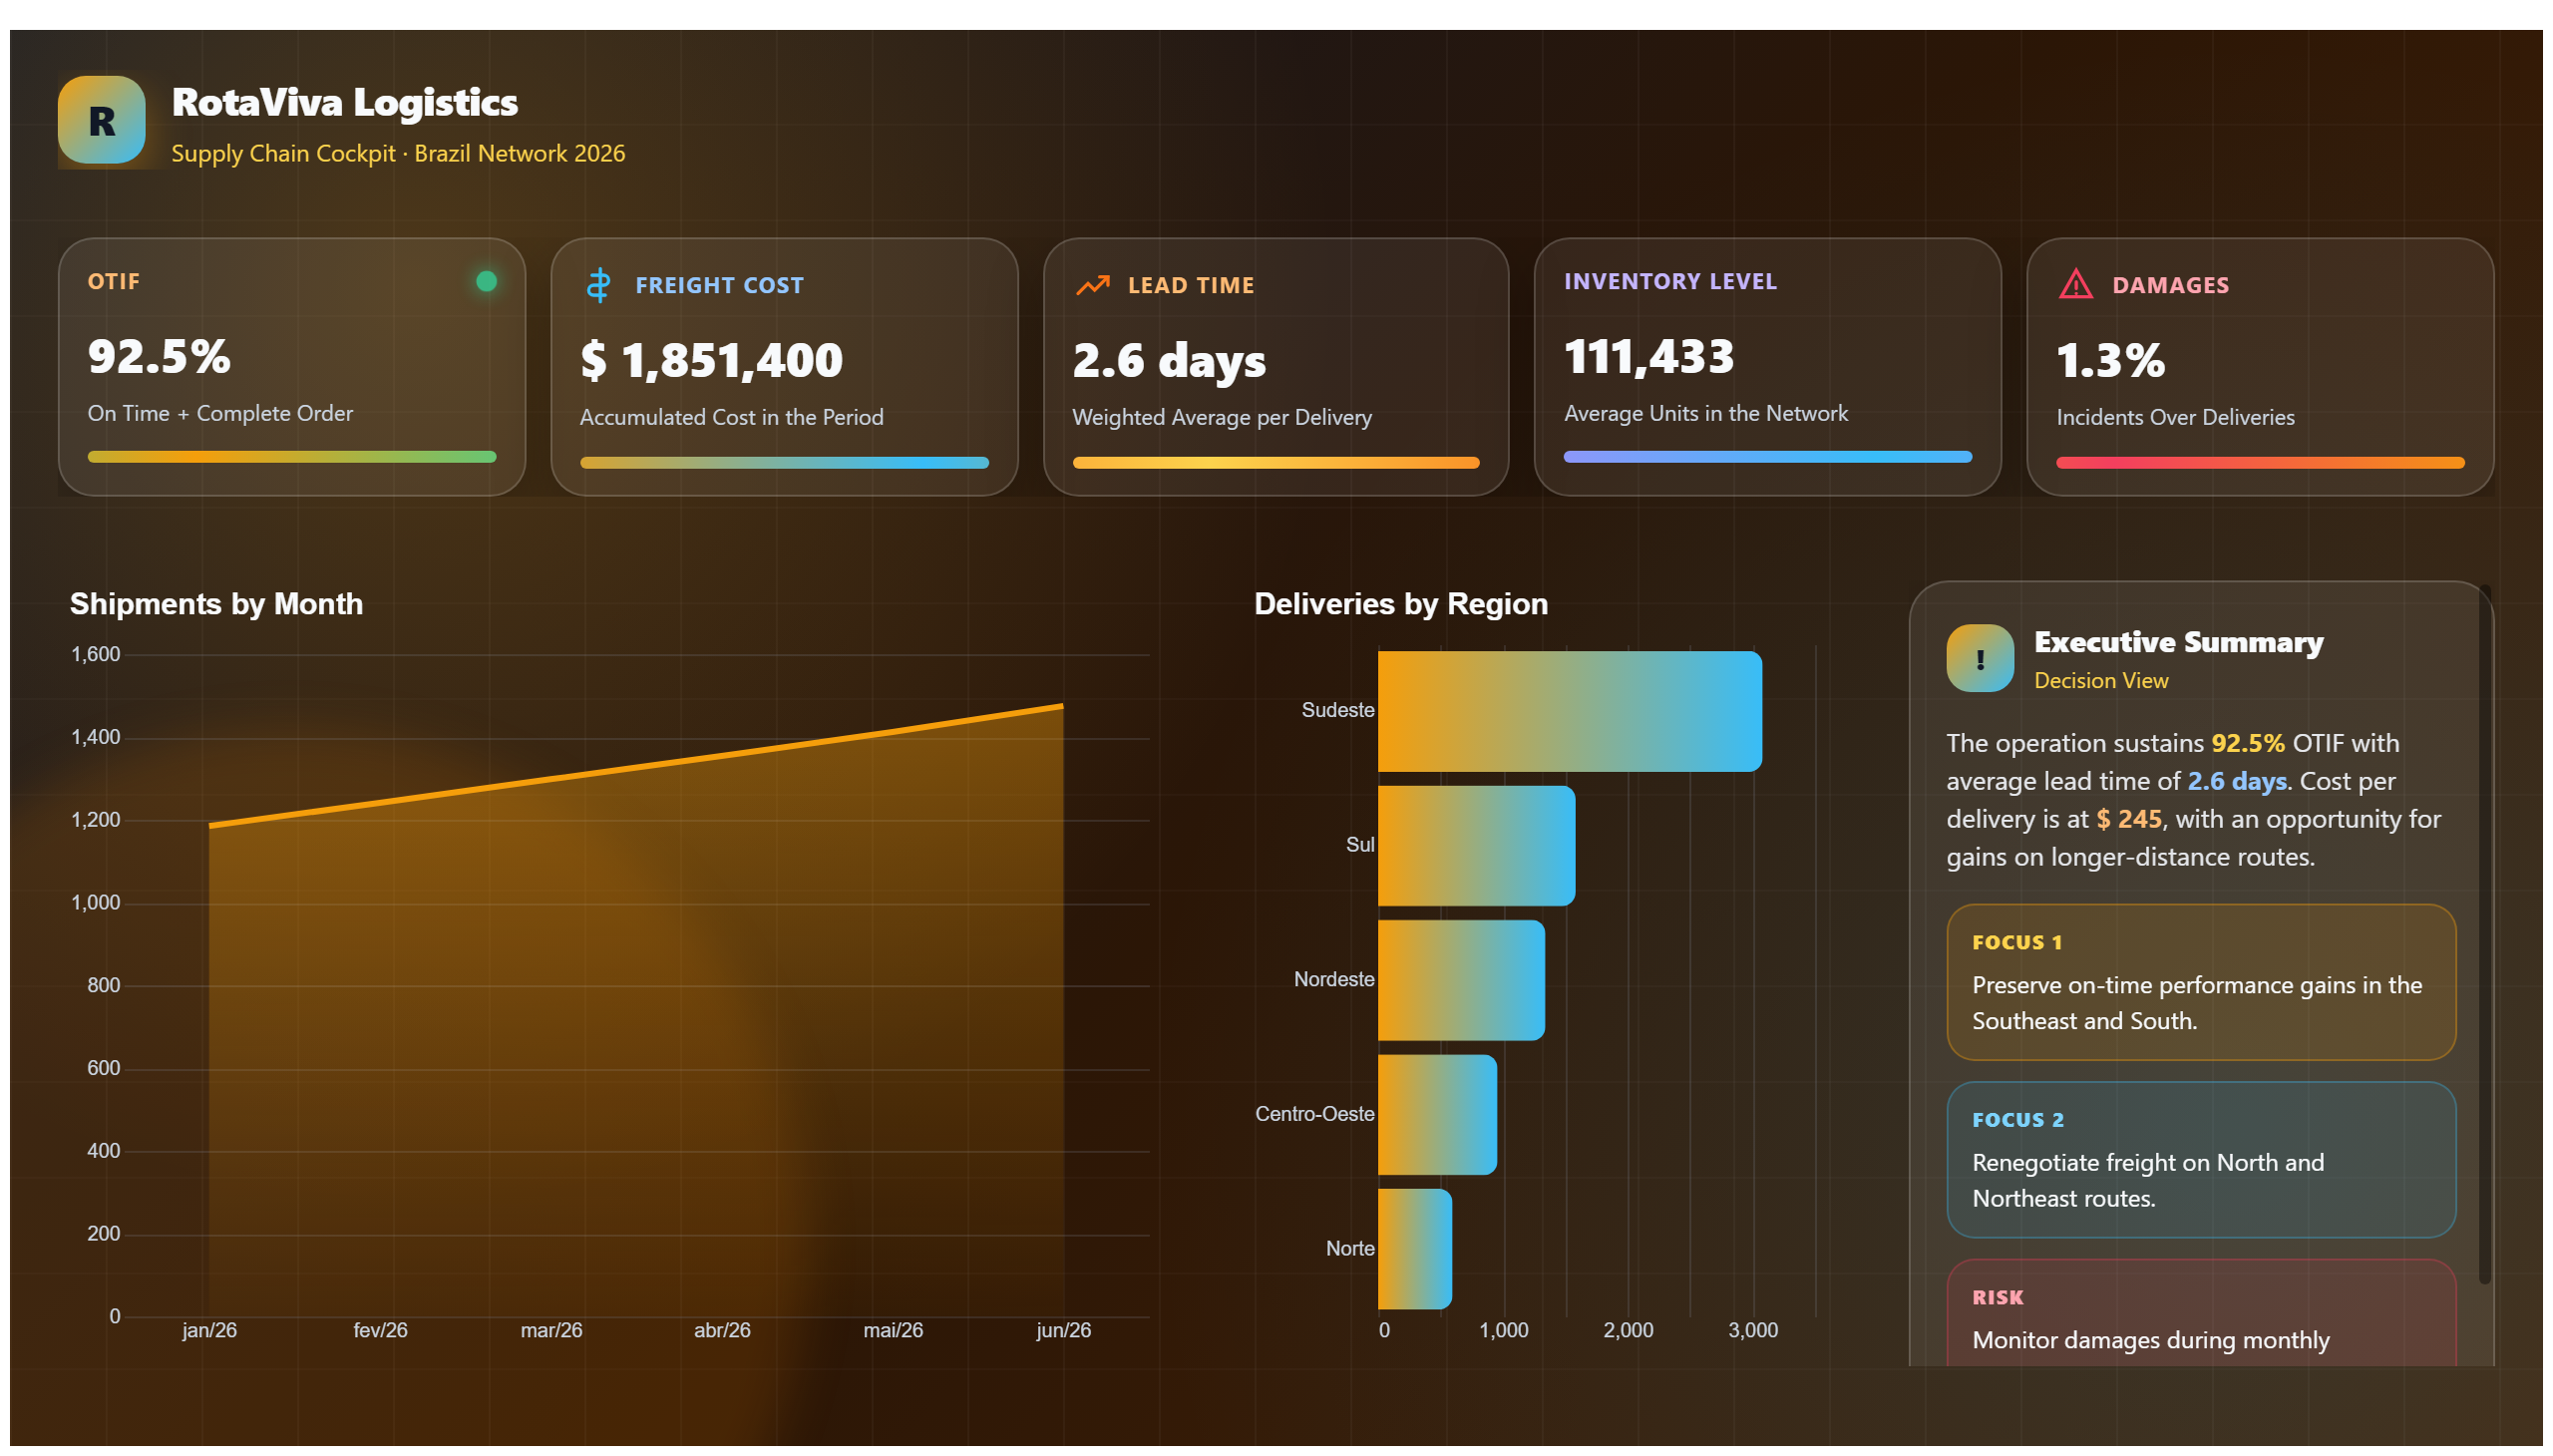
Inventory Management Analysis dashboard provides a comprehensive view of inventory levels and turnover rates, essential for optimizing stock management within the supply chain domain. It enables users to monitor current inventory status, identify slow-moving items, and assess how efficiently stock is being replenished and utilized.
This dashboard answers critical business questions such as: What are the current inventory levels across different product categories? Which items have high or low turnover rates? How can inventory be adjusted to reduce holding costs without risking stockouts? By providing these insights, it supports decision-making to improve inventory accuracy, reduce waste, and enhance overall supply chain efficiency.
Designed primarily for supply chain managers, inventory planners, and operations teams, this report facilitates proactive inventory control and strategic planning. It helps stakeholders maintain optimal stock levels, align inventory with demand patterns, and ultimately drive cost savings and customer satisfaction.
Frequently asked questions about this dashboard
What key metrics does the dashboard track for inventory management?
The dashboard tracks inventory levels and turnover rates, providing insights into stock quantity and how frequently items are sold or replaced.
How can this dashboard help reduce inventory holding costs?
By identifying slow-moving inventory and highlighting turnover trends, the dashboard enables users to adjust stock levels, minimizing excess inventory and associated holding costs.
Who is the primary audience for this inventory management dashboard?
The primary audience includes supply chain managers, inventory planners, and operations teams responsible for maintaining efficient stock levels and optimizing inventory processes.
Want a dashboard like this with your data?
We build a custom version for your business — US$ 50 per page, delivered within 7 calendar days.
Logistics Power BI templates
Complete projects built by the Excelverton factory: view them live with a free account and download the PBIP as a channel subscriber (1/month) or Pro subscriber (unlimited).
Create your free account
Save favorites, build collections and use the AI assistant — at no cost.