EdTech Online Courses Aanalysis Power BI Project
This report analyzes online courses in the EdTech area, focusing on performance and engagement.
Create a free account
Save your favorite dashboards, get new templates by area and ask the AI assistant — for free.
About the EdTech Online Courses Aanalysis Power BI Project dashboard
This is a free Power BI dashboard called EdTech Online Courses Aanalysis Power BI Project, in the Educação domain. Explore KPIs, interactive visualizations and get inspired for your own data and business intelligence projects.
This report analyzes online courses in the EdTech area, focusing on performance and engagement.
Dashboard analysis
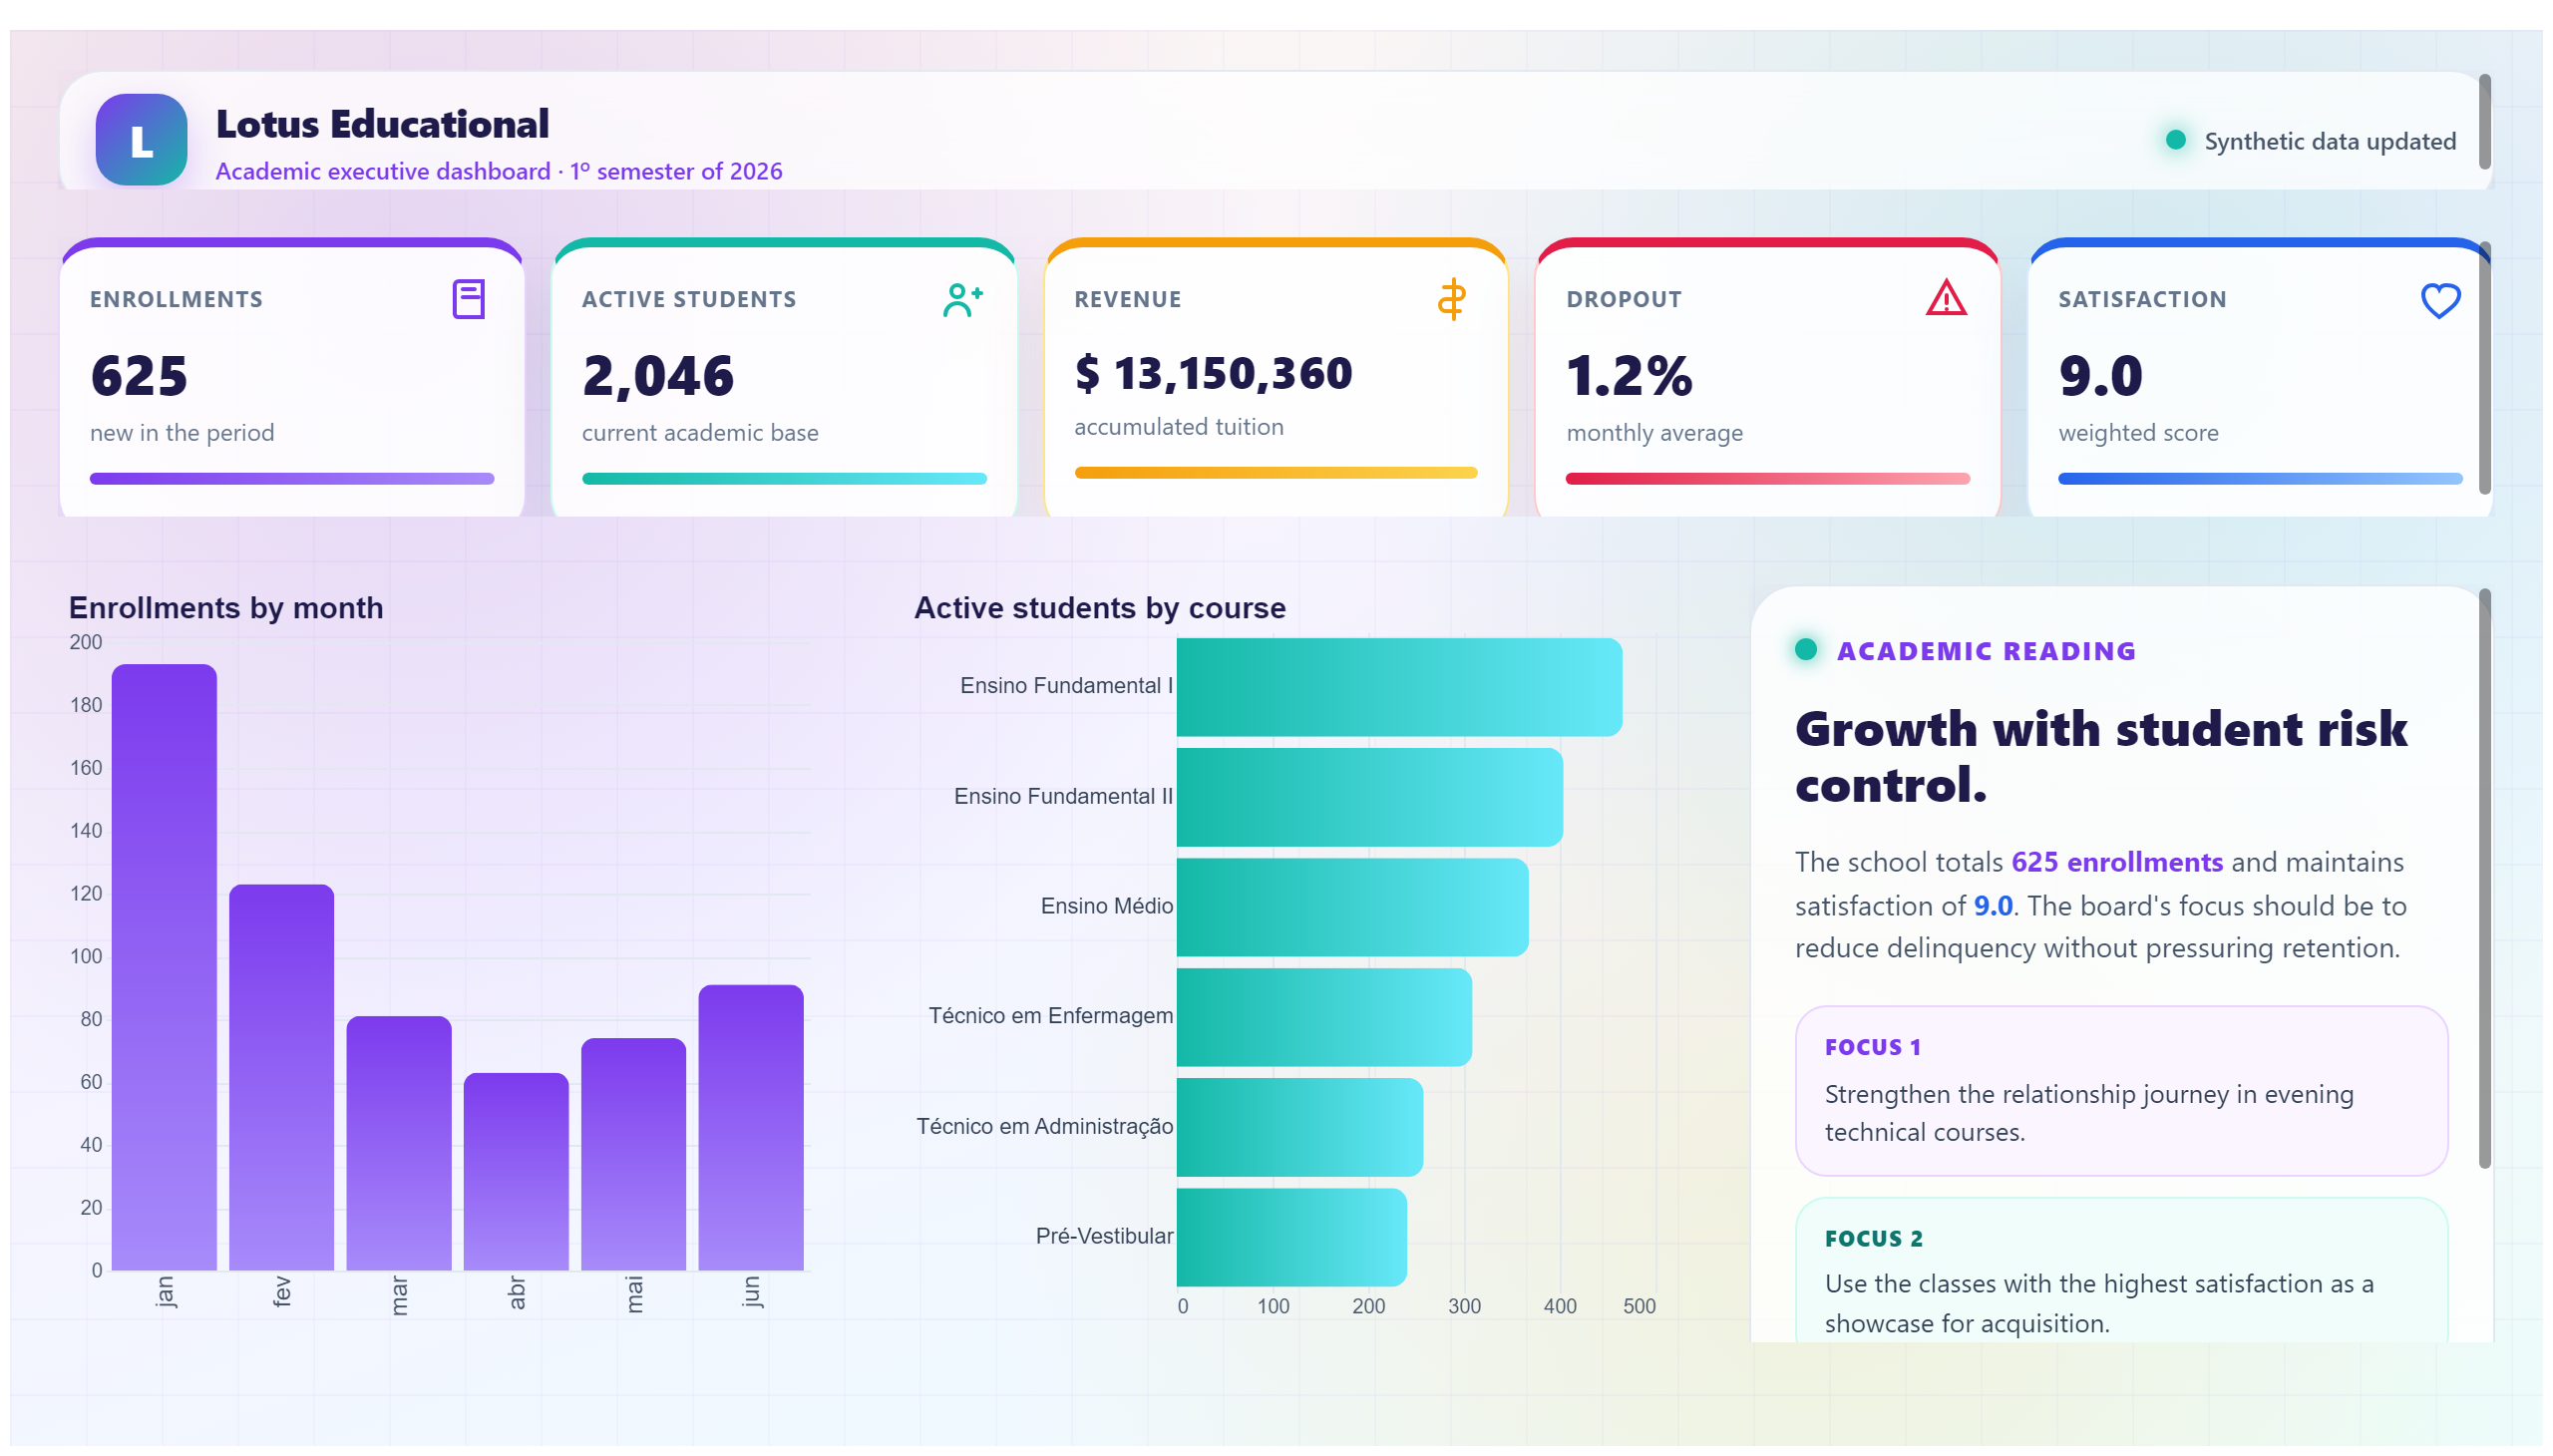
This dashboard provides a comprehensive analysis of online courses within the EdTech sector, focusing primarily on course performance and learner engagement. It offers insights into key metrics such as enrollment trends, completion rates, and user interaction levels, allowing stakeholders to understand how courses are performing over time.
By visualizing these data points, the dashboard helps answer critical business questions such as which courses have the highest engagement, what factors influence course completion, and how learners are interacting with the content. This enables education providers and EdTech companies to make data-driven decisions to improve course offerings and enhance learner experiences.
Designed for educators, course designers, and EdTech business analysts, this report serves as a valuable tool to monitor the effectiveness of online courses and identify opportunities for growth and optimization in the competitive online education market.
Frequently asked questions about this dashboard
What key performance indicators does this dashboard track for online courses?
The dashboard tracks enrollment numbers, course completion rates, and learner engagement metrics such as time spent on course materials and interaction frequency.
Who is the primary audience for this EdTech online courses analysis?
The primary audience includes educators, course developers, and EdTech business analysts looking to optimize course performance and learner engagement.
How can this dashboard help improve online course offerings?
By identifying trends in course engagement and completion, stakeholders can pinpoint strengths and weaknesses, enabling targeted improvements to content and delivery methods.
Want a dashboard like this with your data?
We build a custom version for your business — US$ 50 per page, delivered within 7 calendar days.
Education Power BI templates
Complete projects built by the Excelverton factory: view them live with a free account and download the PBIP as a channel subscriber (1/month) or Pro subscriber (unlimited).
Create your free account
Save favorites, build collections and use the AI assistant — at no cost.