HistogramVisualisation
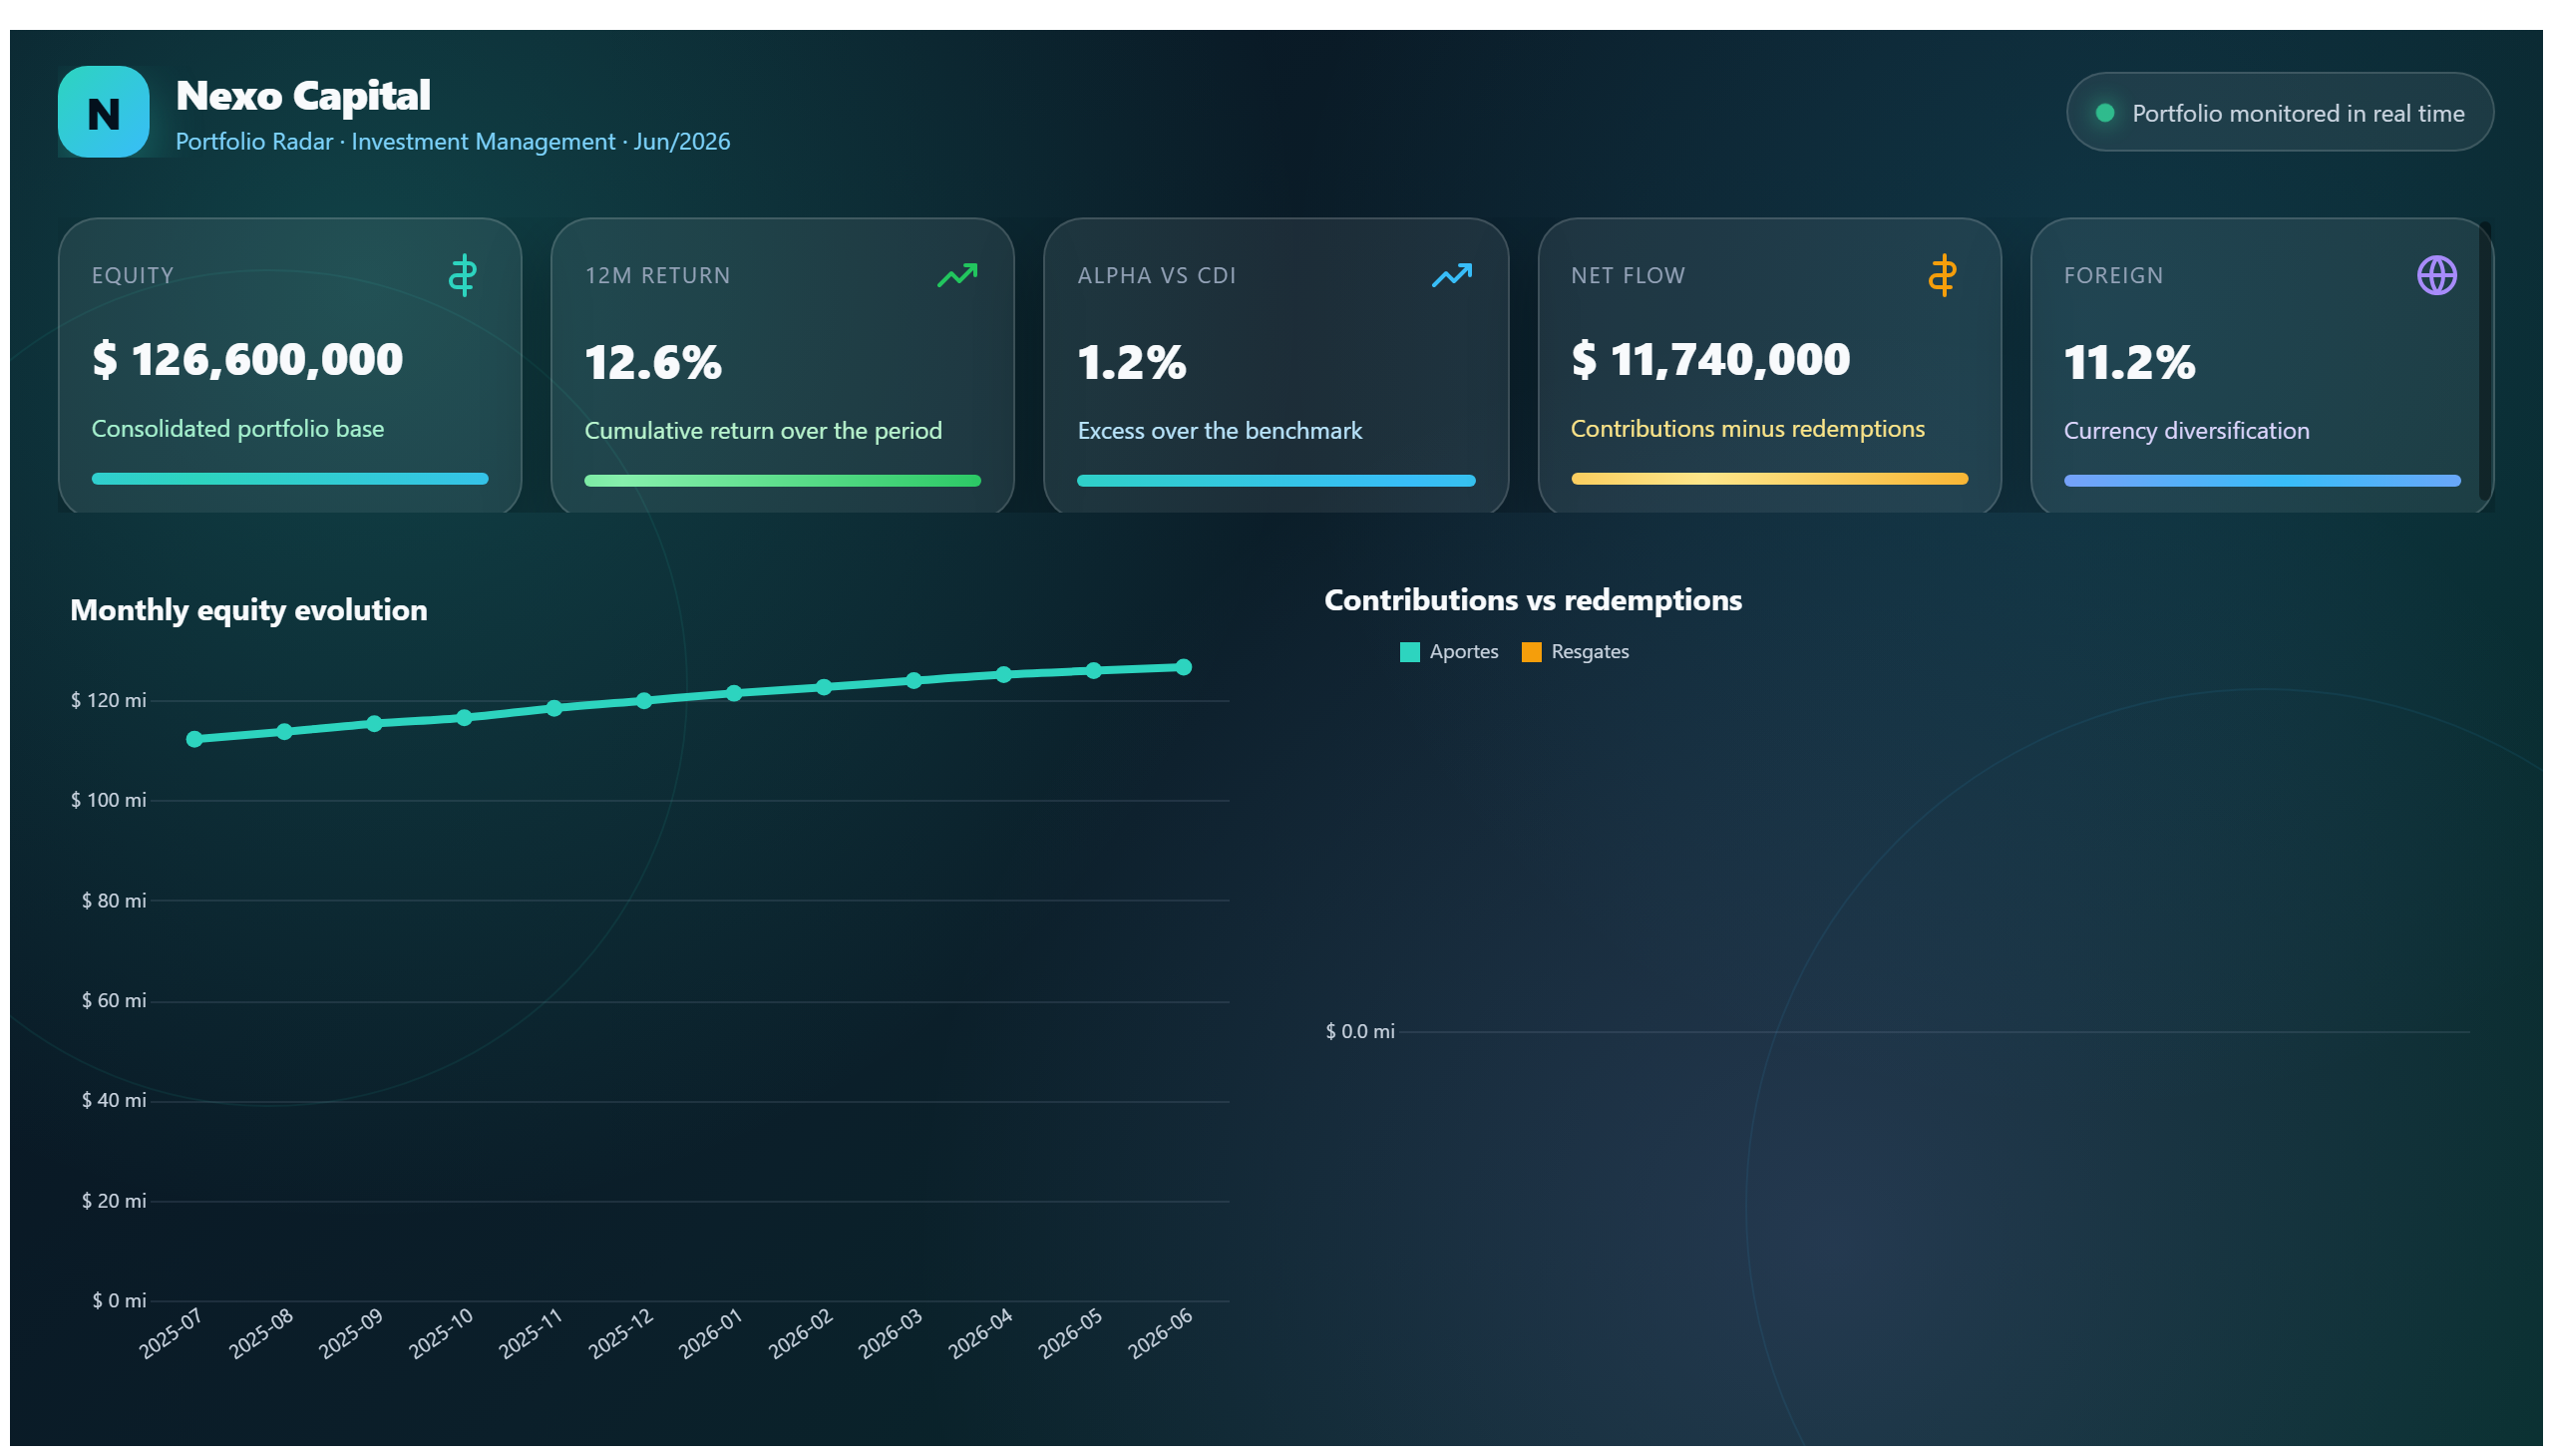
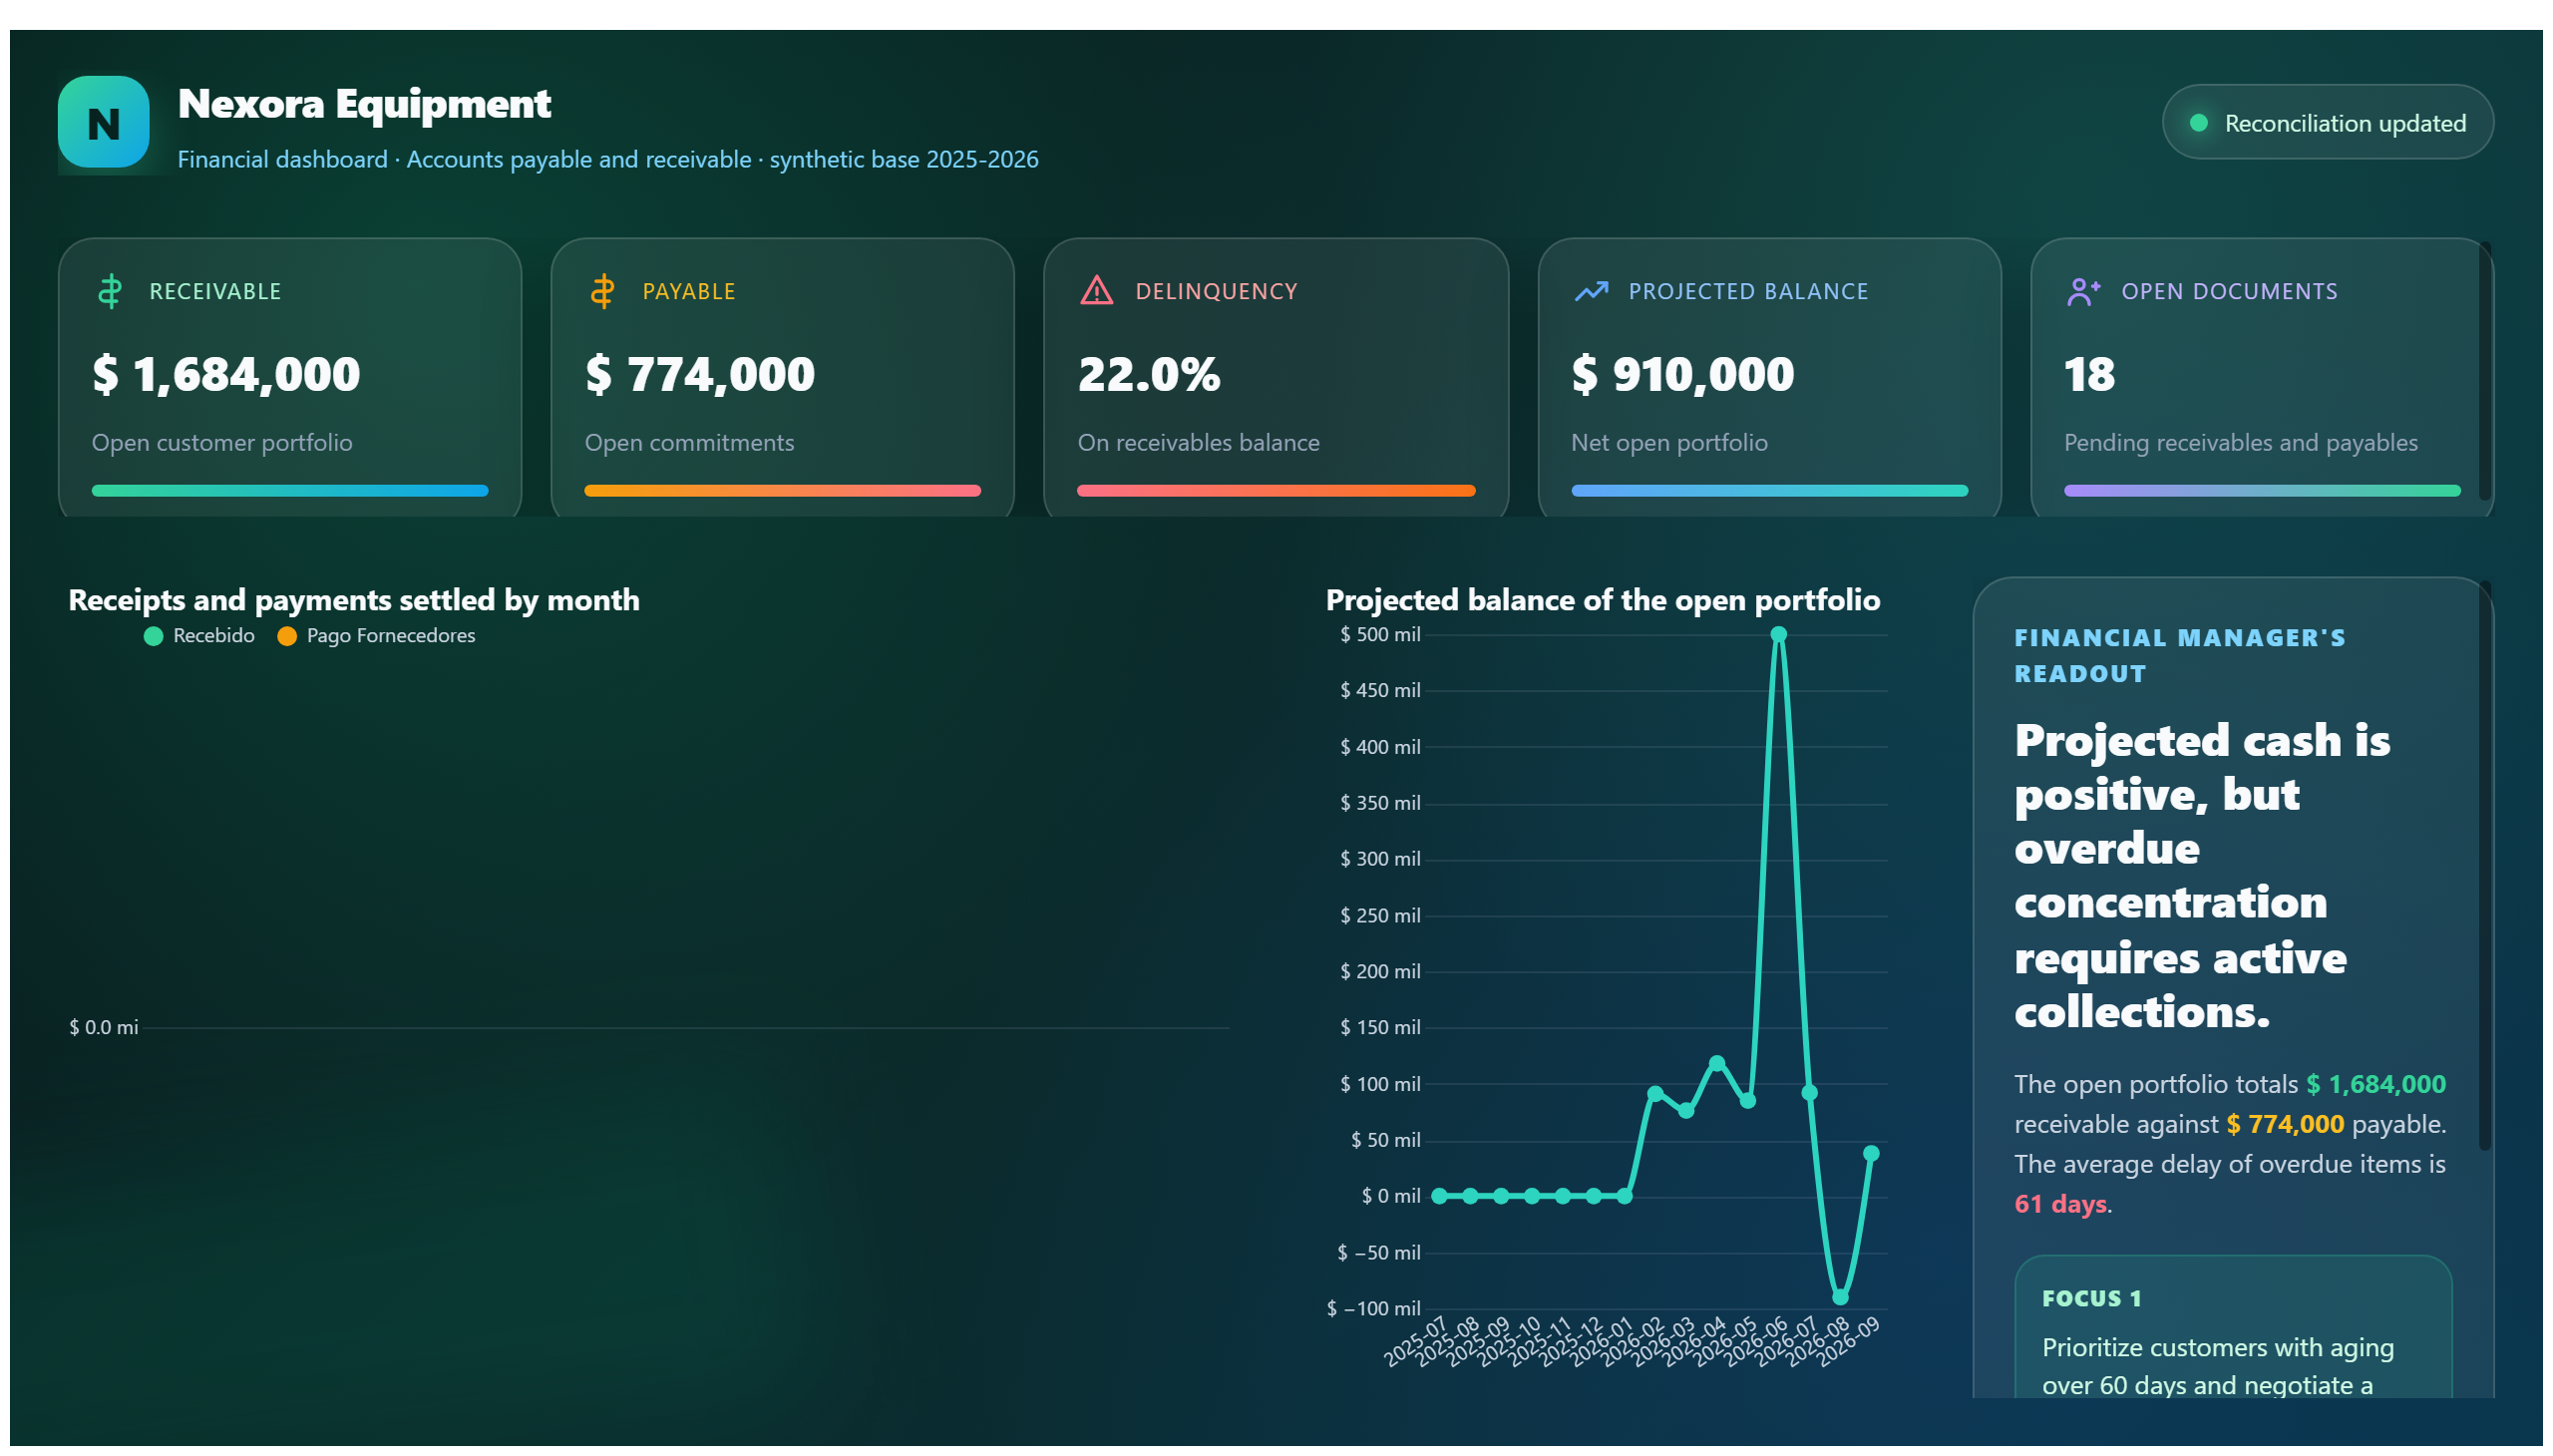
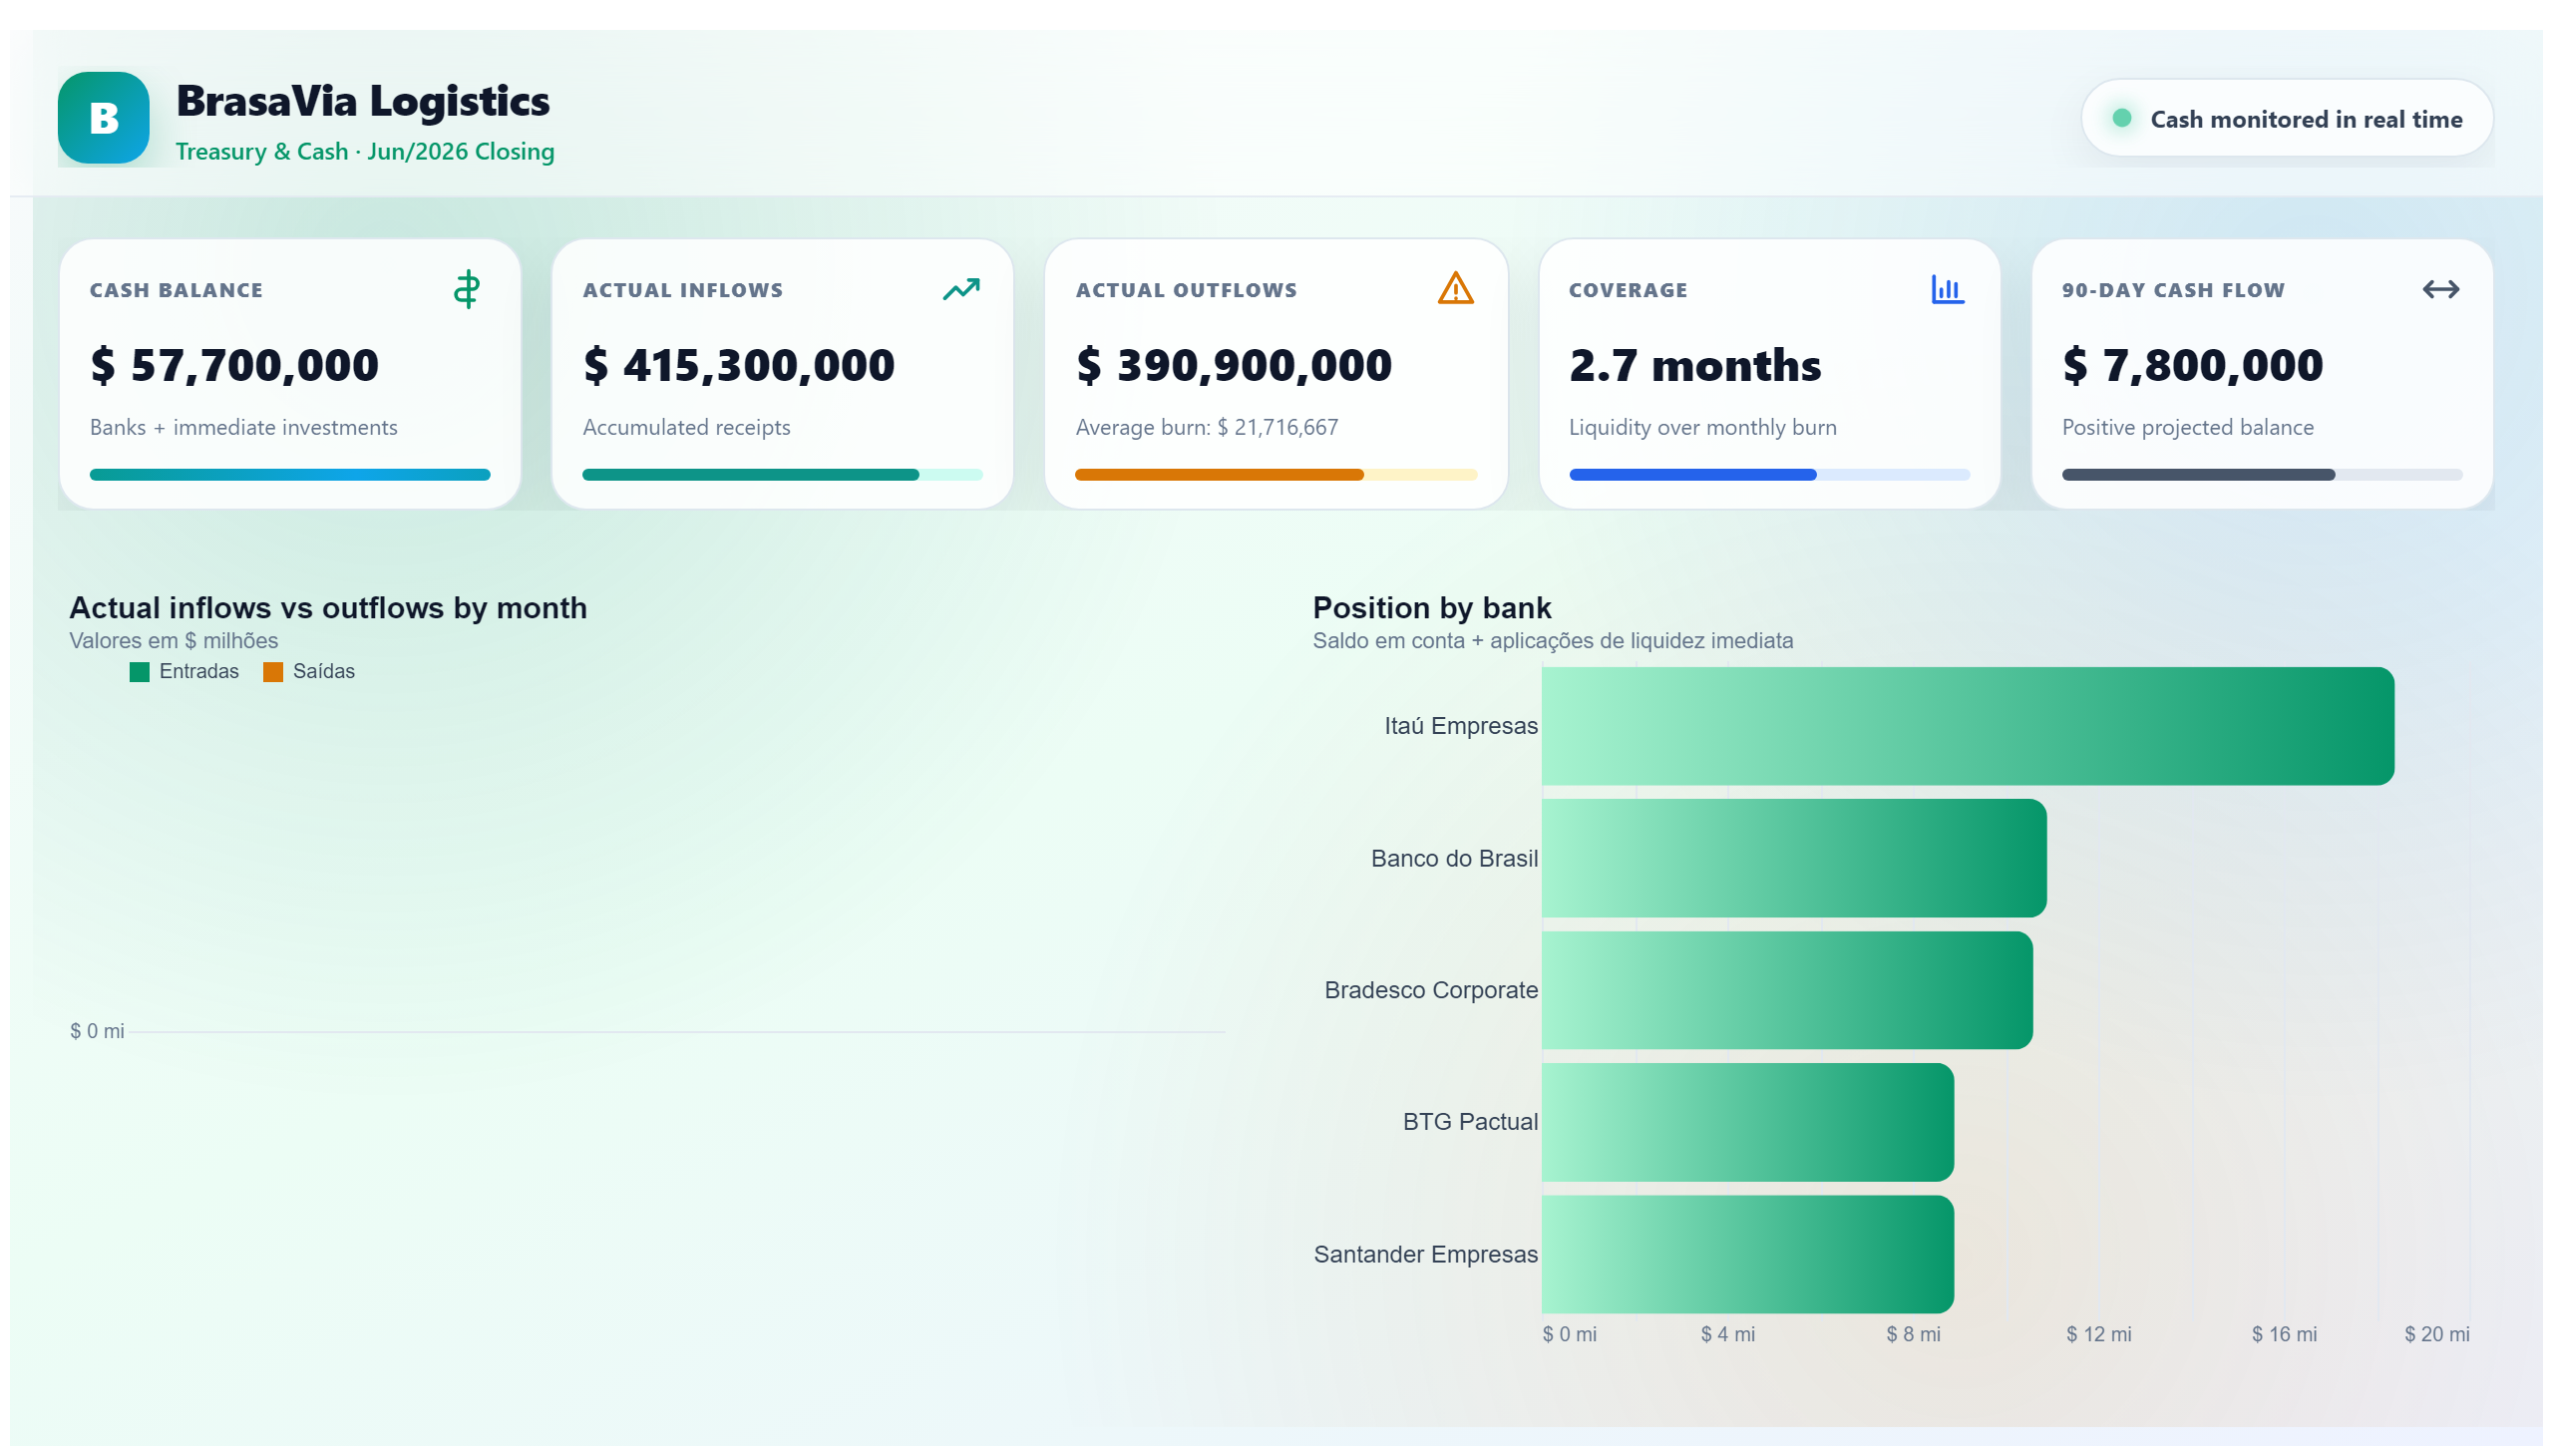
This report visualizes data in histogram format, possibly for financial analysis.
Create a free account
Save your favorite dashboards, get new templates by area and ask the AI assistant — for free.
About the HistogramVisualisation dashboard
This is a free Power BI dashboard called HistogramVisualisation, in the Financeiro domain. Explore KPIs, interactive visualizations and get inspired for your own data and business intelligence projects.
This report visualizes data in histogram format, possibly for financial analysis.
Want a dashboard like this with your data?
We build a custom version for your business — US$ 50 per page, delivered within 7 calendar days.
Finance Power BI templates
Complete projects built by the Excelverton factory: view them live with a free account and download the PBIP as a channel subscriber (1/month) or Pro subscriber (unlimited).
Create your free account
Save favorites, build collections and use the AI assistant — at no cost.