Dashboard preview
FrotasLogistica
This report analyzes fleet logistics data, including efficiency and costs.
Report on fleet management in transportation and logistics, focusing on efficiency and costs.
Save your favorite dashboards, get new templates by area and ask the AI assistant — for free.
This is a free Power BI dashboard called Fleet Management Transportation & Logistics, in the Logística domain. Explore KPIs, interactive visualizations and get inspired for your own data and business intelligence projects.
Report on fleet management in transportation and logistics, focusing on efficiency and costs.
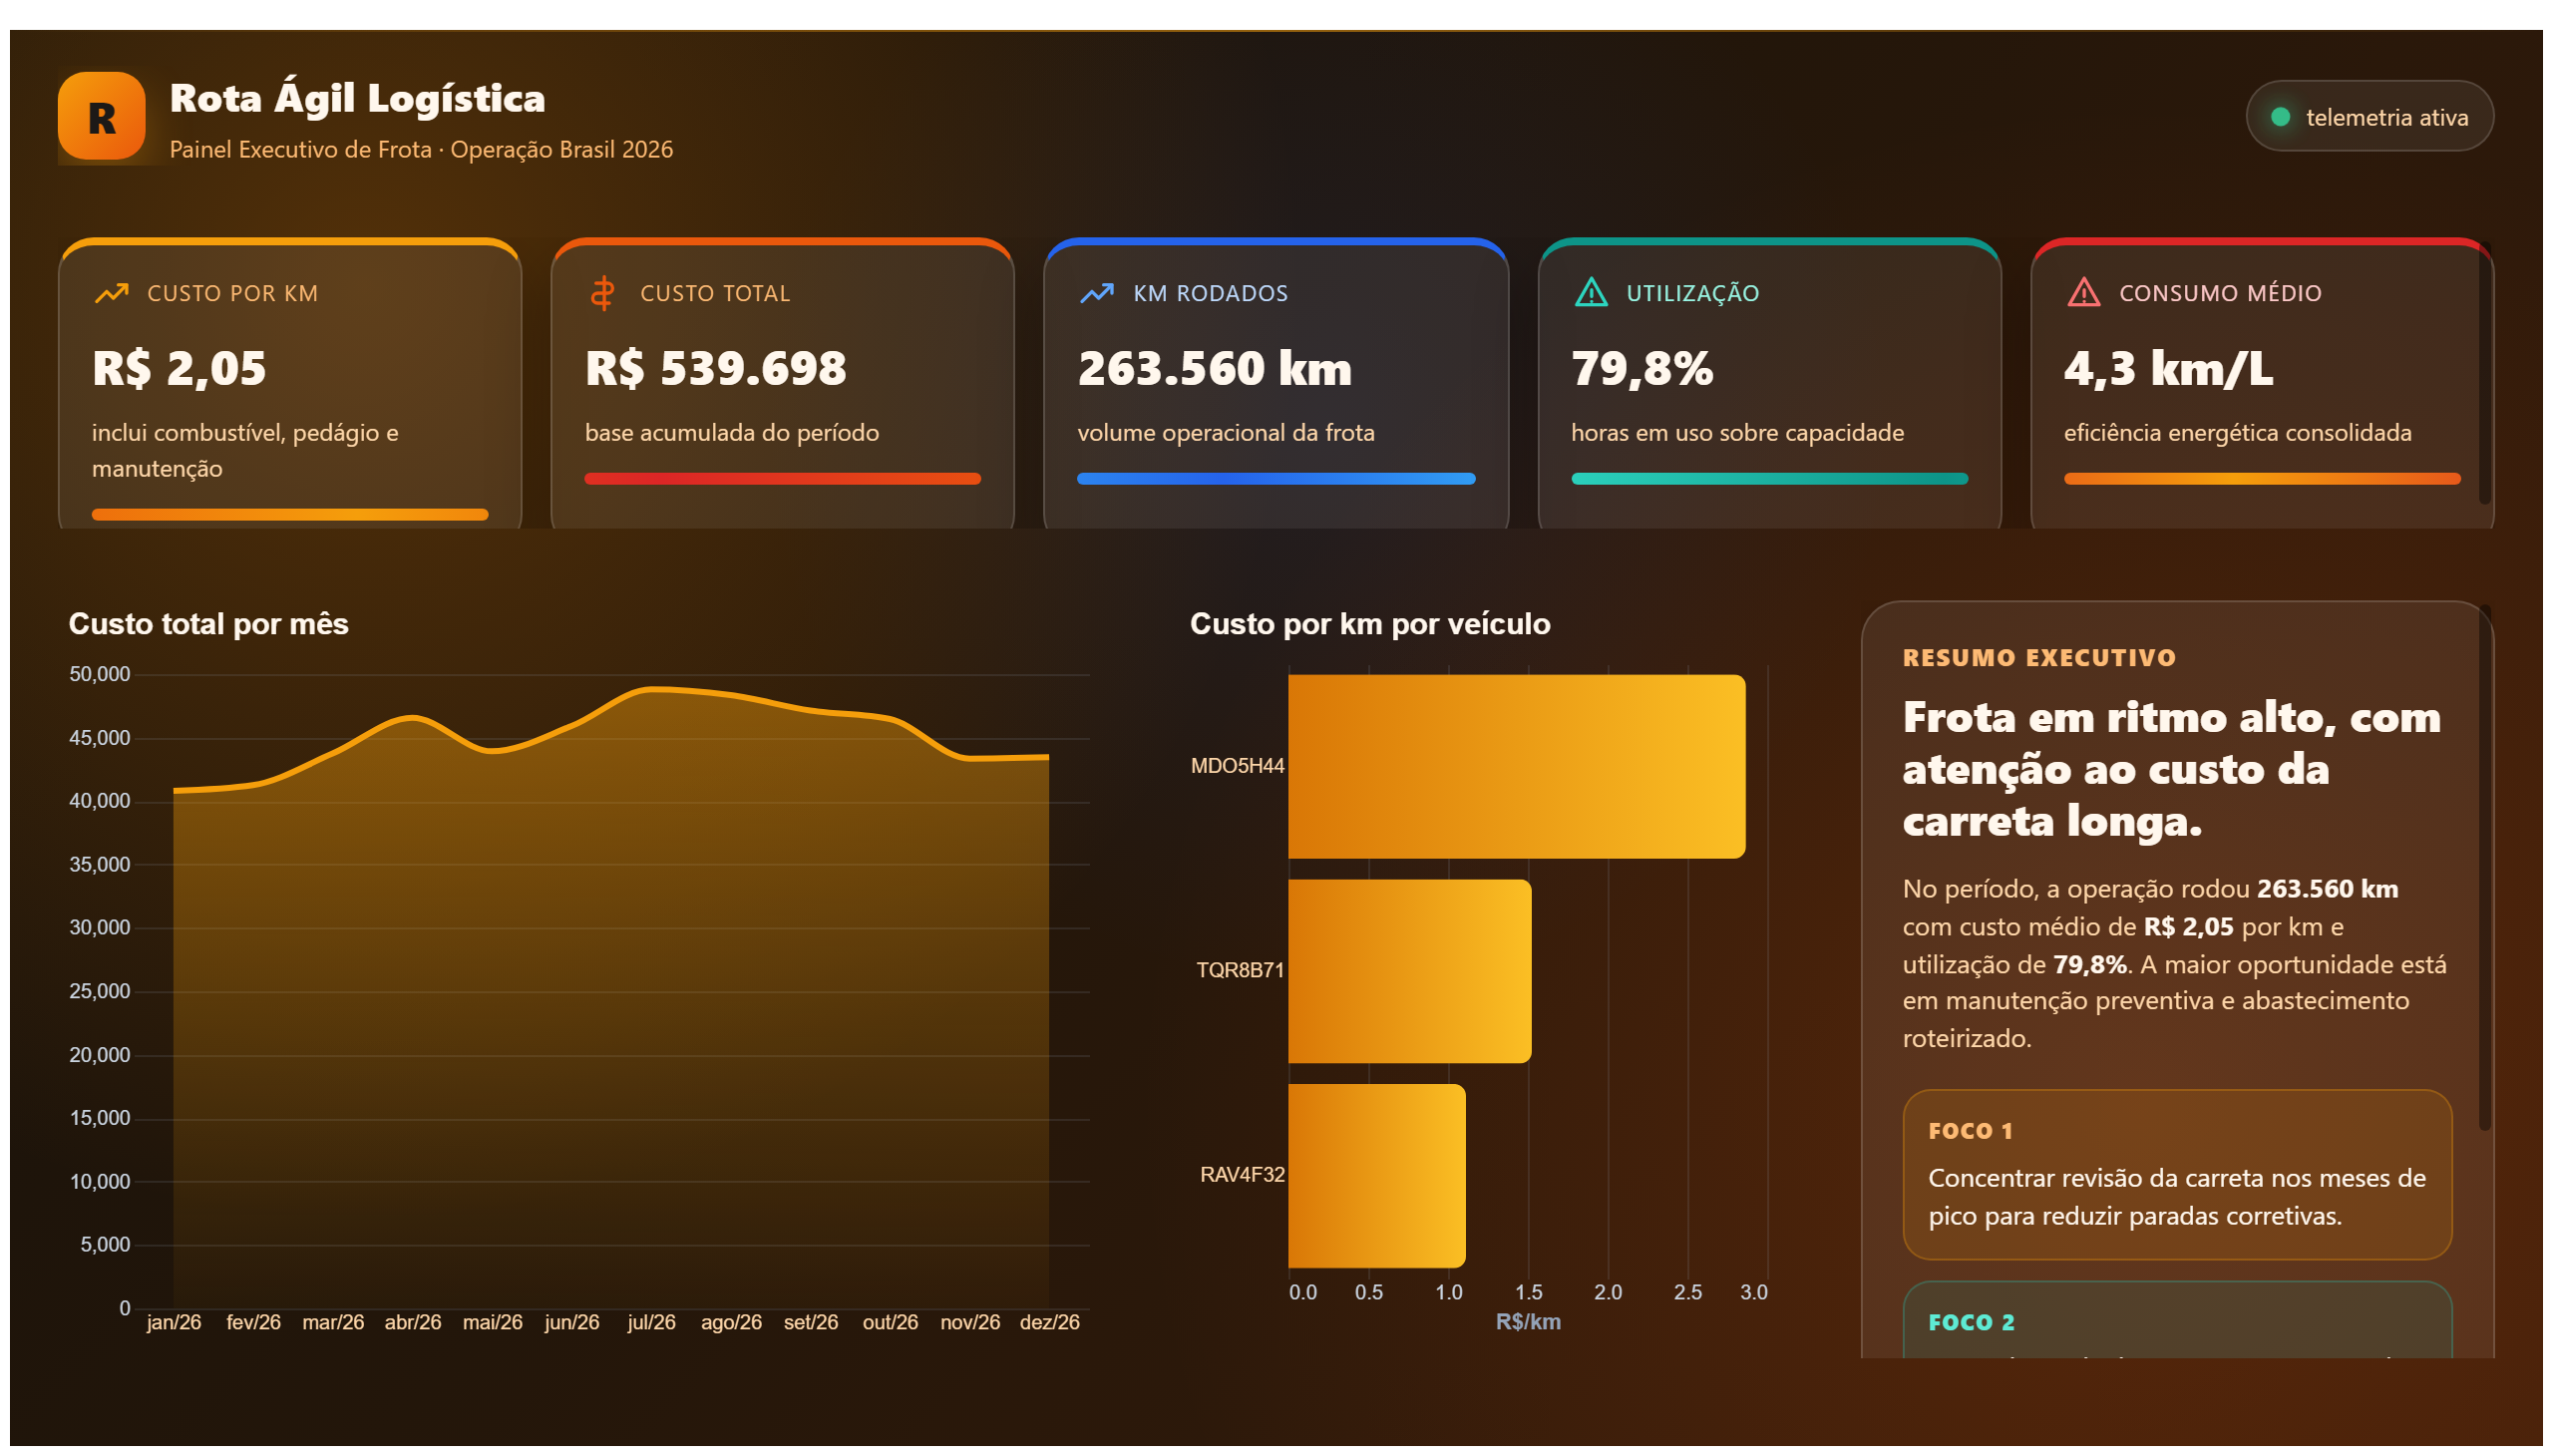
Fleet Management Transportation & Logistics dashboard provides a comprehensive overview of fleet operations within the transportation and logistics sector, focusing primarily on efficiency and cost control. It enables users to monitor key performance indicators such as vehicle utilization, fuel consumption, maintenance schedules, and operational costs. By consolidating these metrics, the dashboard helps organizations identify inefficiencies and optimize resource allocation.
This dashboard is designed to answer critical business questions like: How efficiently is the fleet being utilized? Where are the highest operational costs incurred? Which vehicles require maintenance to avoid downtime? It supports decision-making processes by highlighting trends and anomalies in fleet performance, enabling logistics managers to implement cost-saving strategies and improve service reliability.
Ideal for supply chain professionals, fleet managers, and logistics coordinators, this dashboard serves as a vital tool to enhance operational transparency and drive continuous improvement in transportation management. It aligns with the broader goals of reducing expenses while maintaining high service levels in supply chain operations.
The dashboard tracks metrics such as vehicle utilization rates, fuel consumption, maintenance schedules, and operational costs to provide a holistic view of fleet efficiency.
By identifying areas of high fuel consumption and maintenance needs, the dashboard enables managers to optimize routes and schedules, reducing unnecessary expenses.
The dashboard is primarily designed for supply chain professionals, fleet managers, and logistics coordinators responsible for managing transportation operations.
We build a custom version for your business — US$ 50 per page, delivered within 7 calendar days.
Complete projects built by the Excelverton factory: view them live with a free account and download the PBIP as a channel subscriber (1/month) or Pro subscriber (unlimited).
Save favorites, build collections and use the AI assistant — at no cost.