HR Upgraded
This report presents improvements in human resources management.
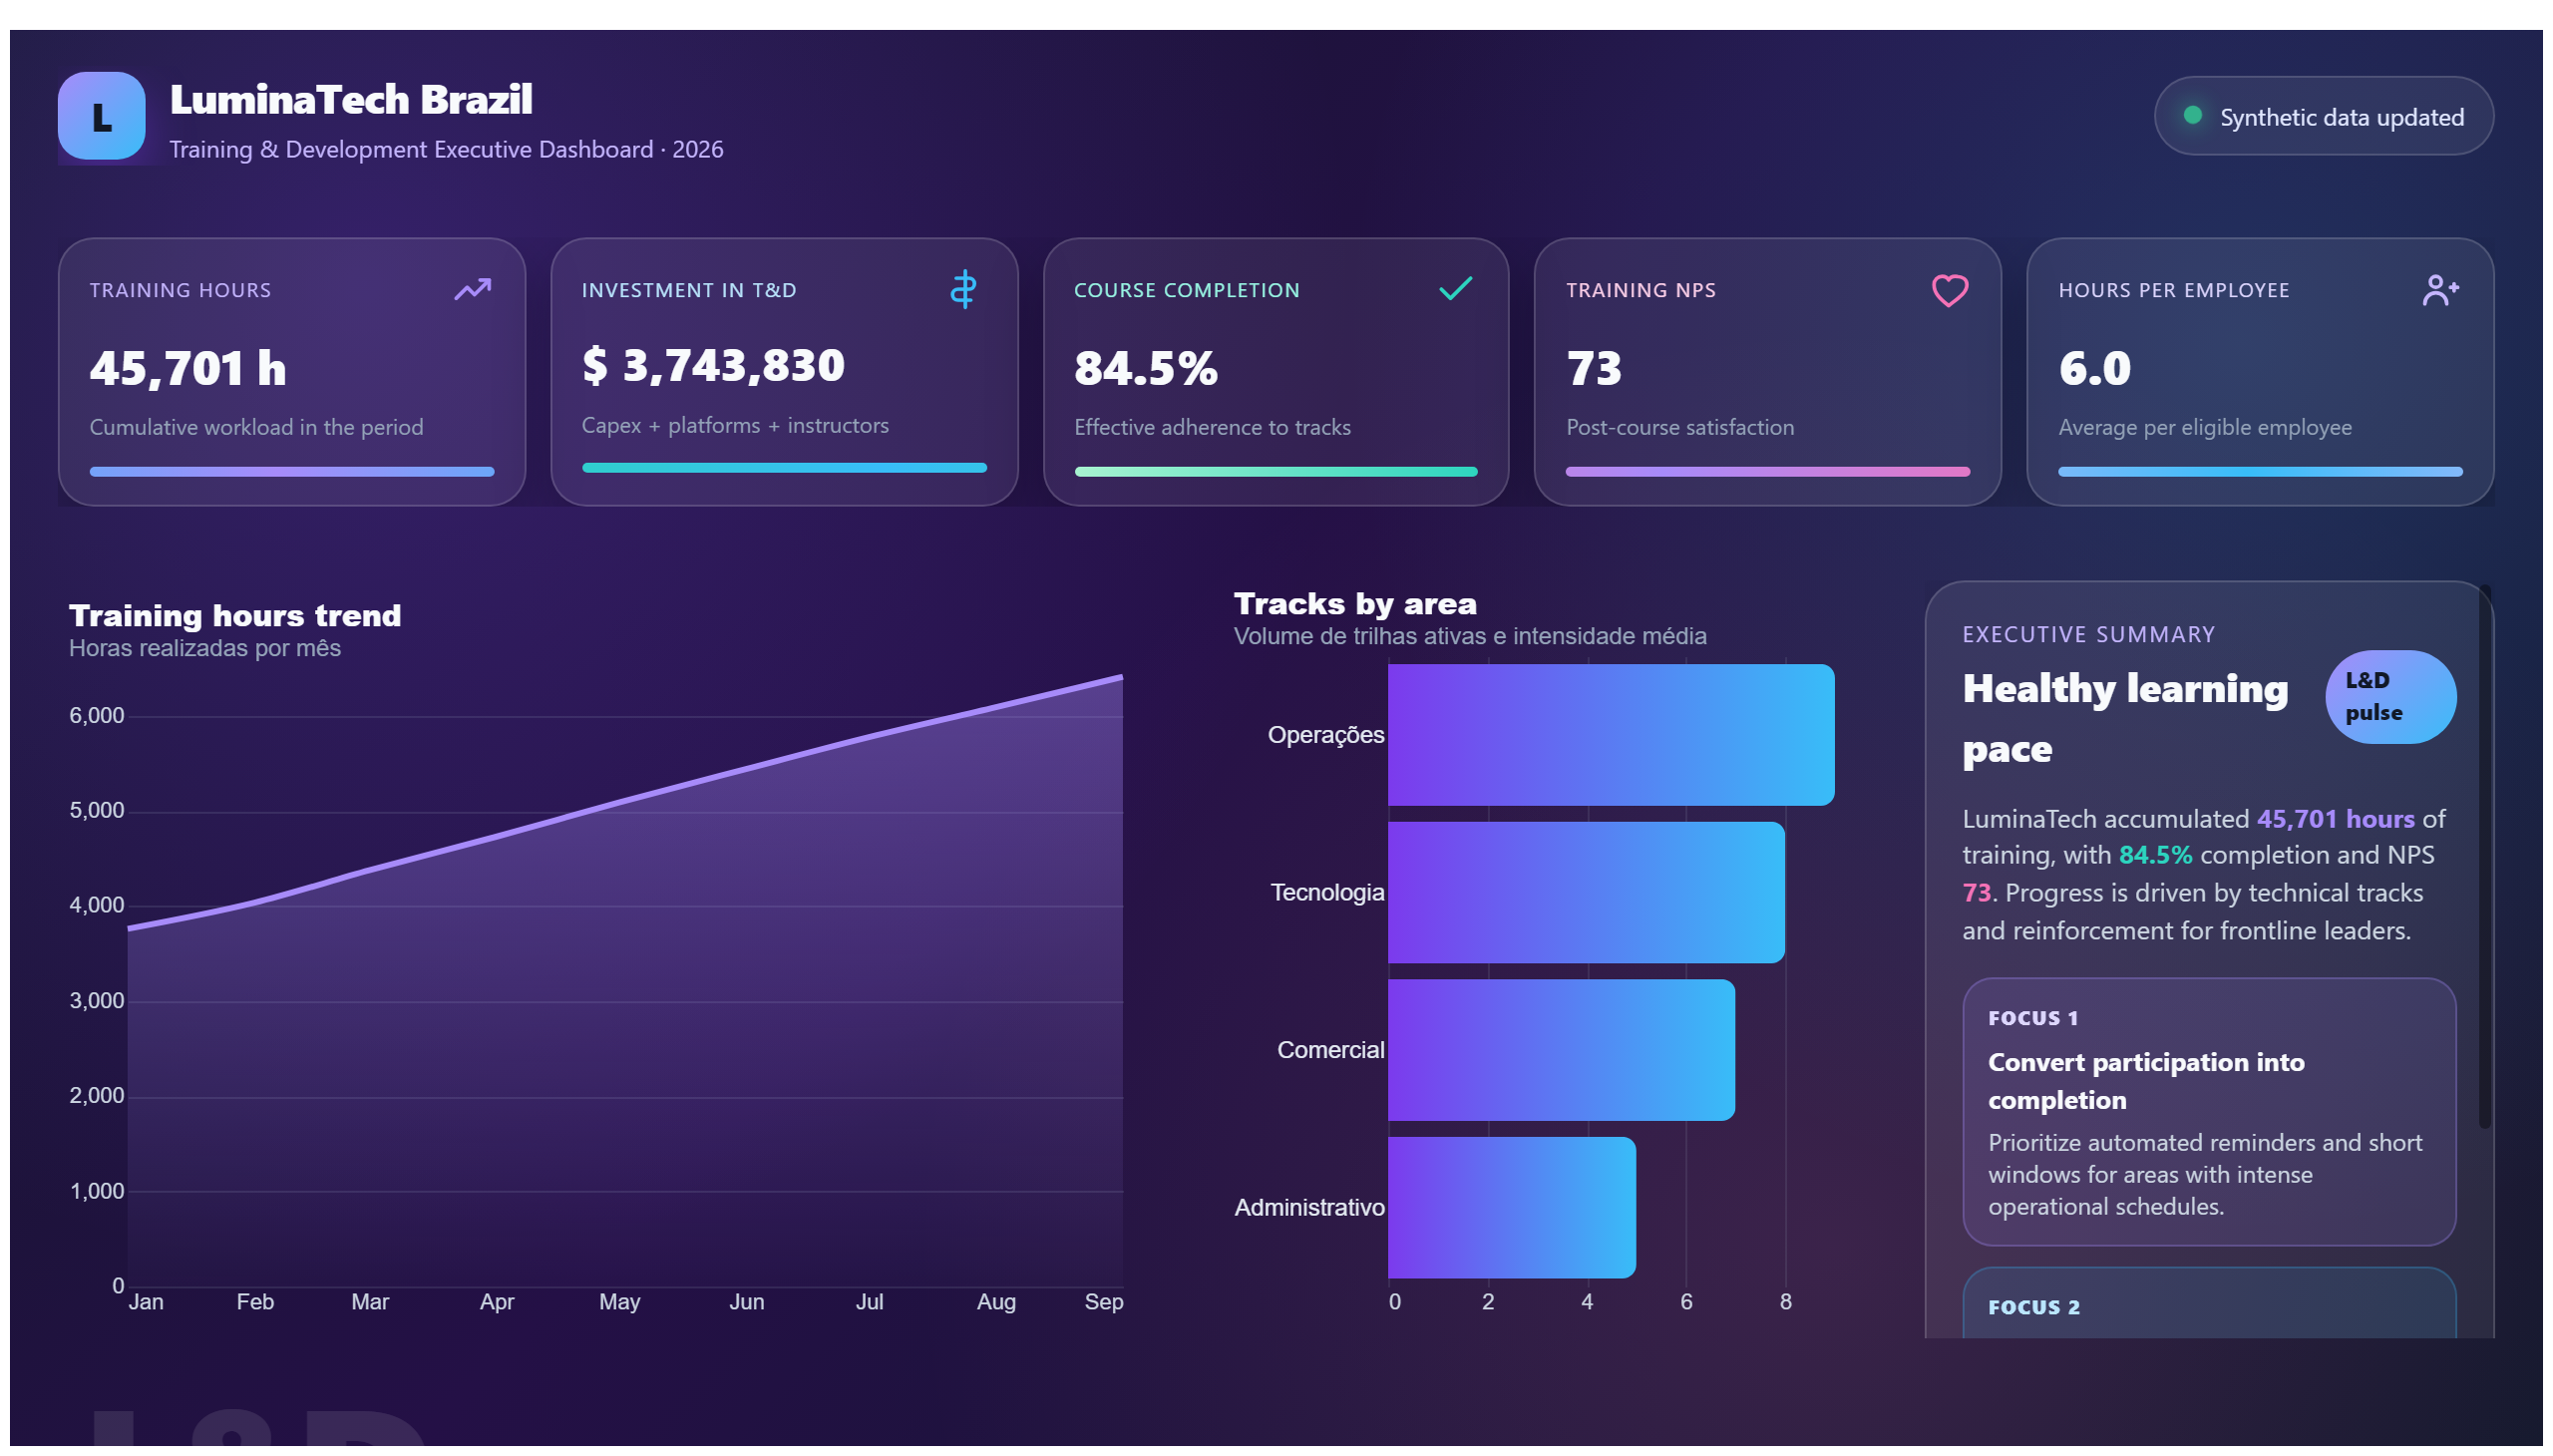
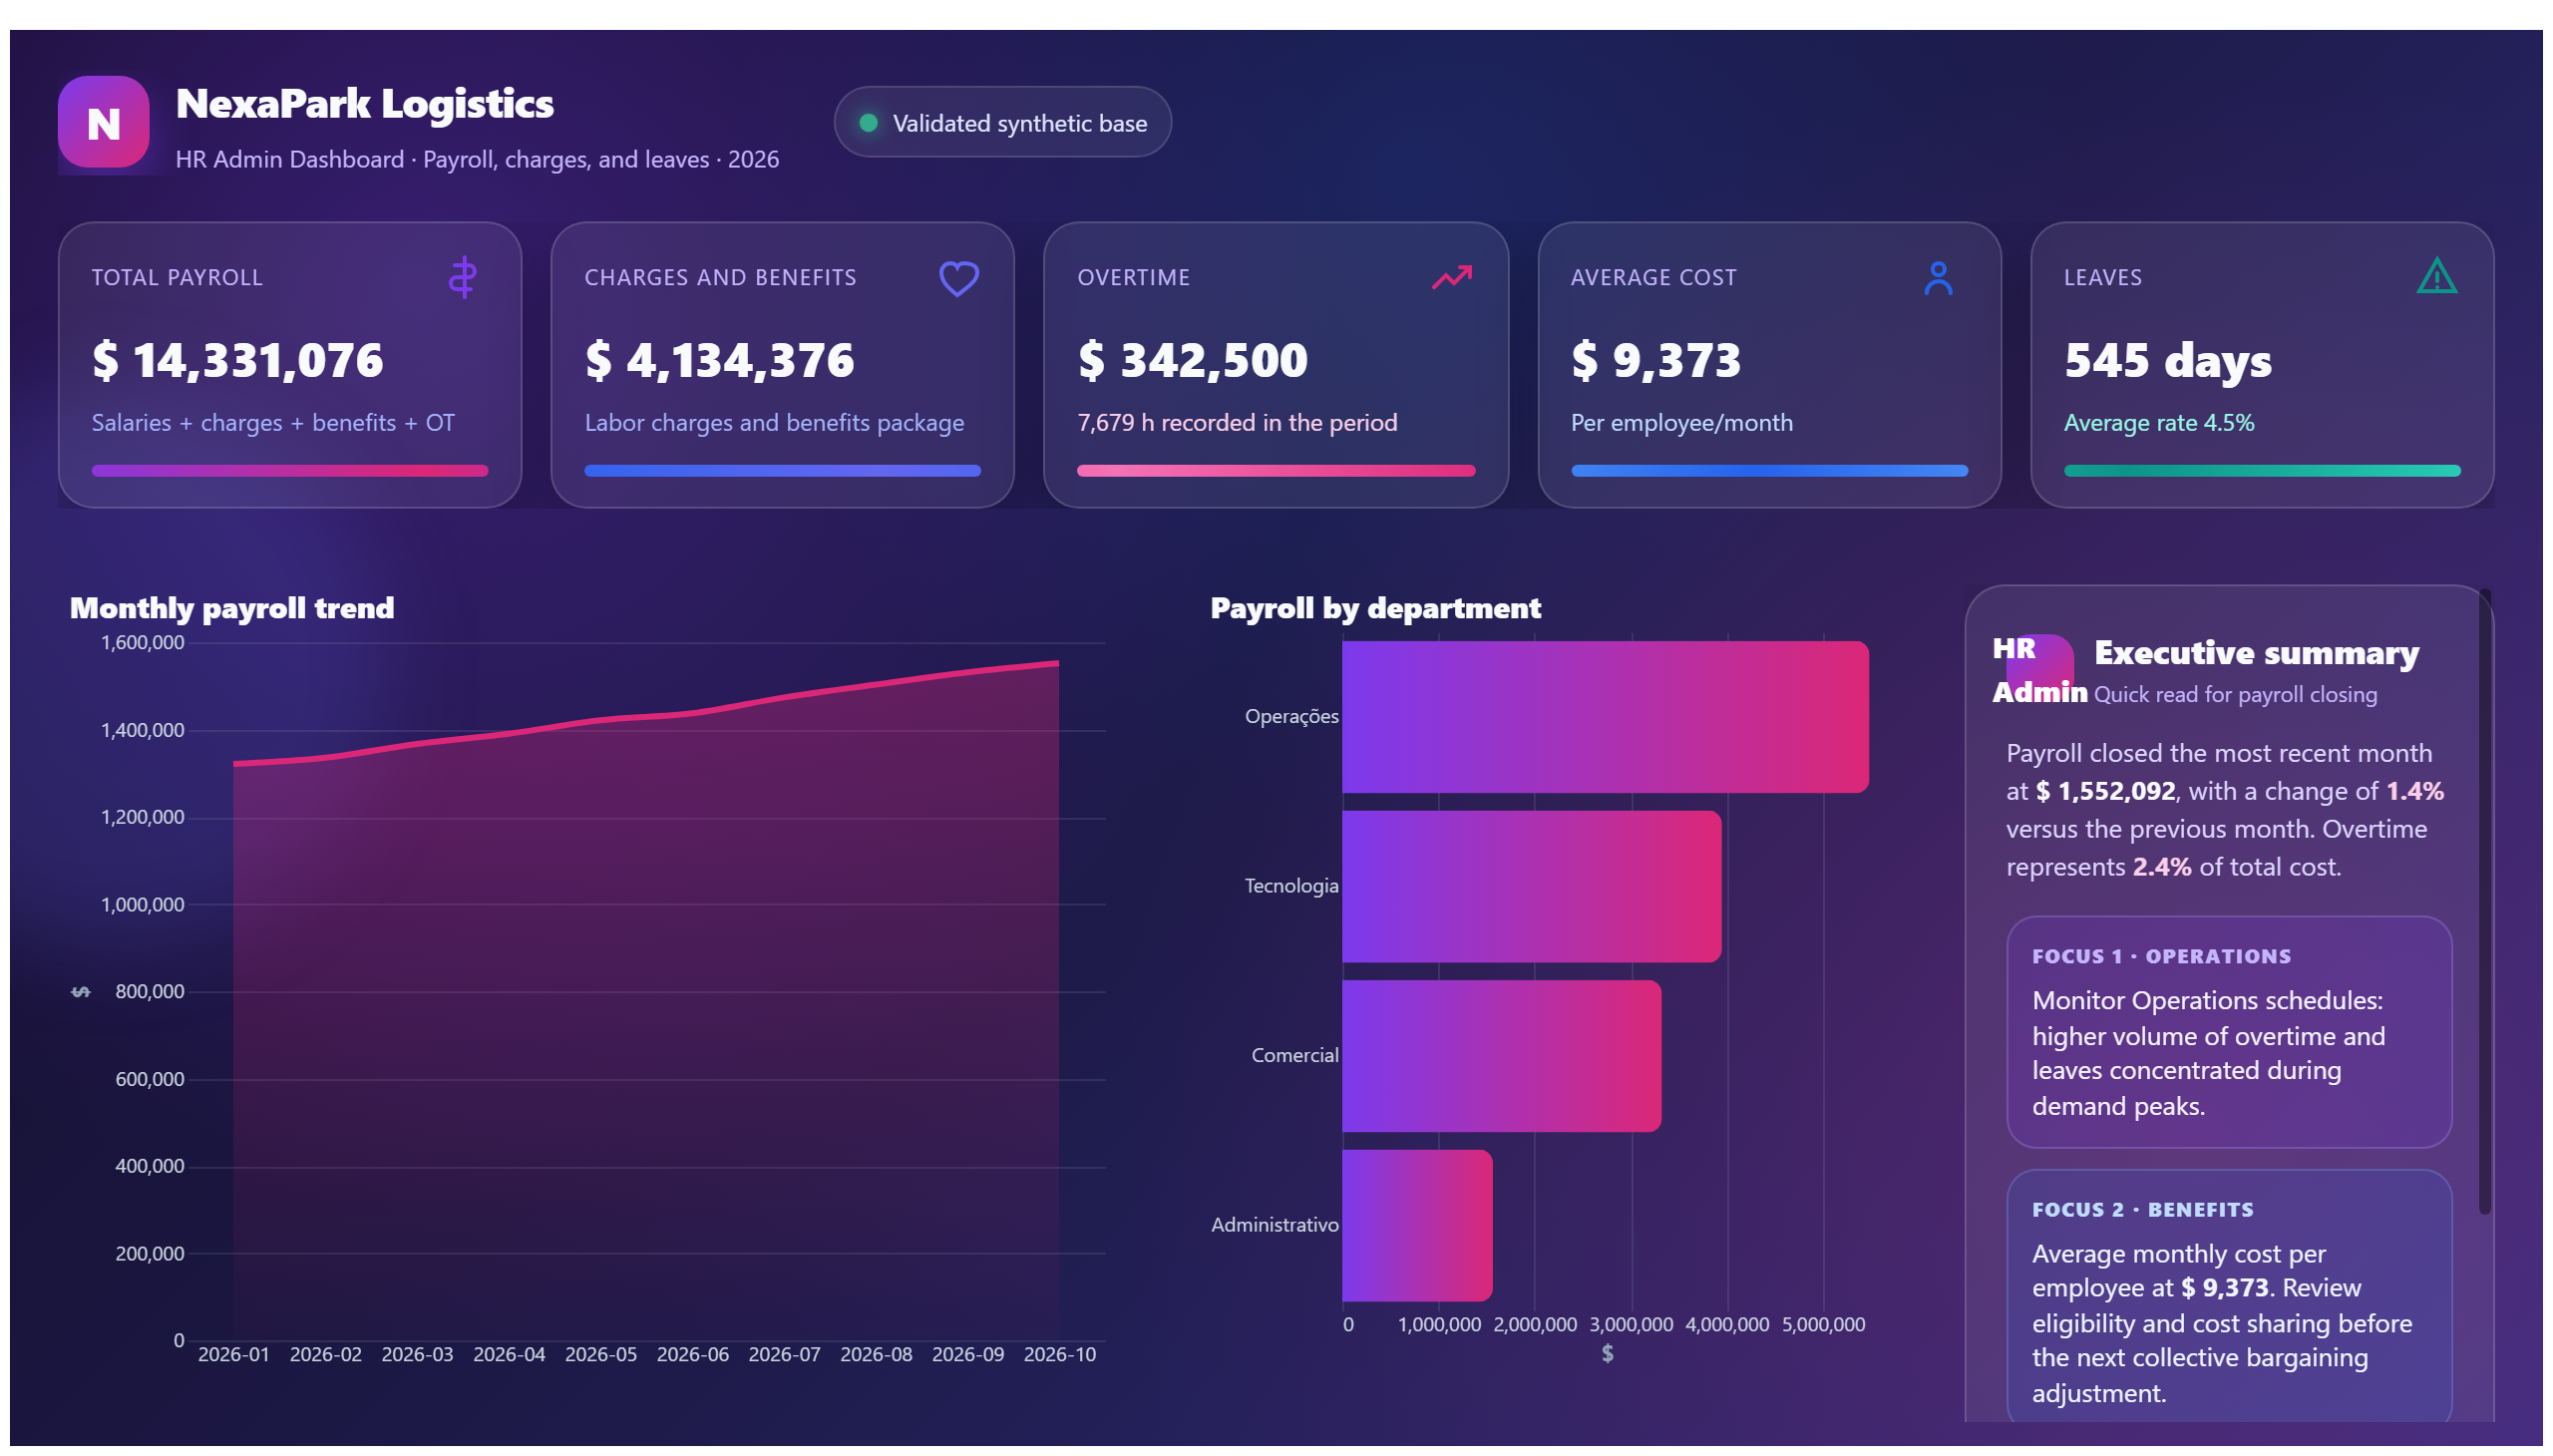
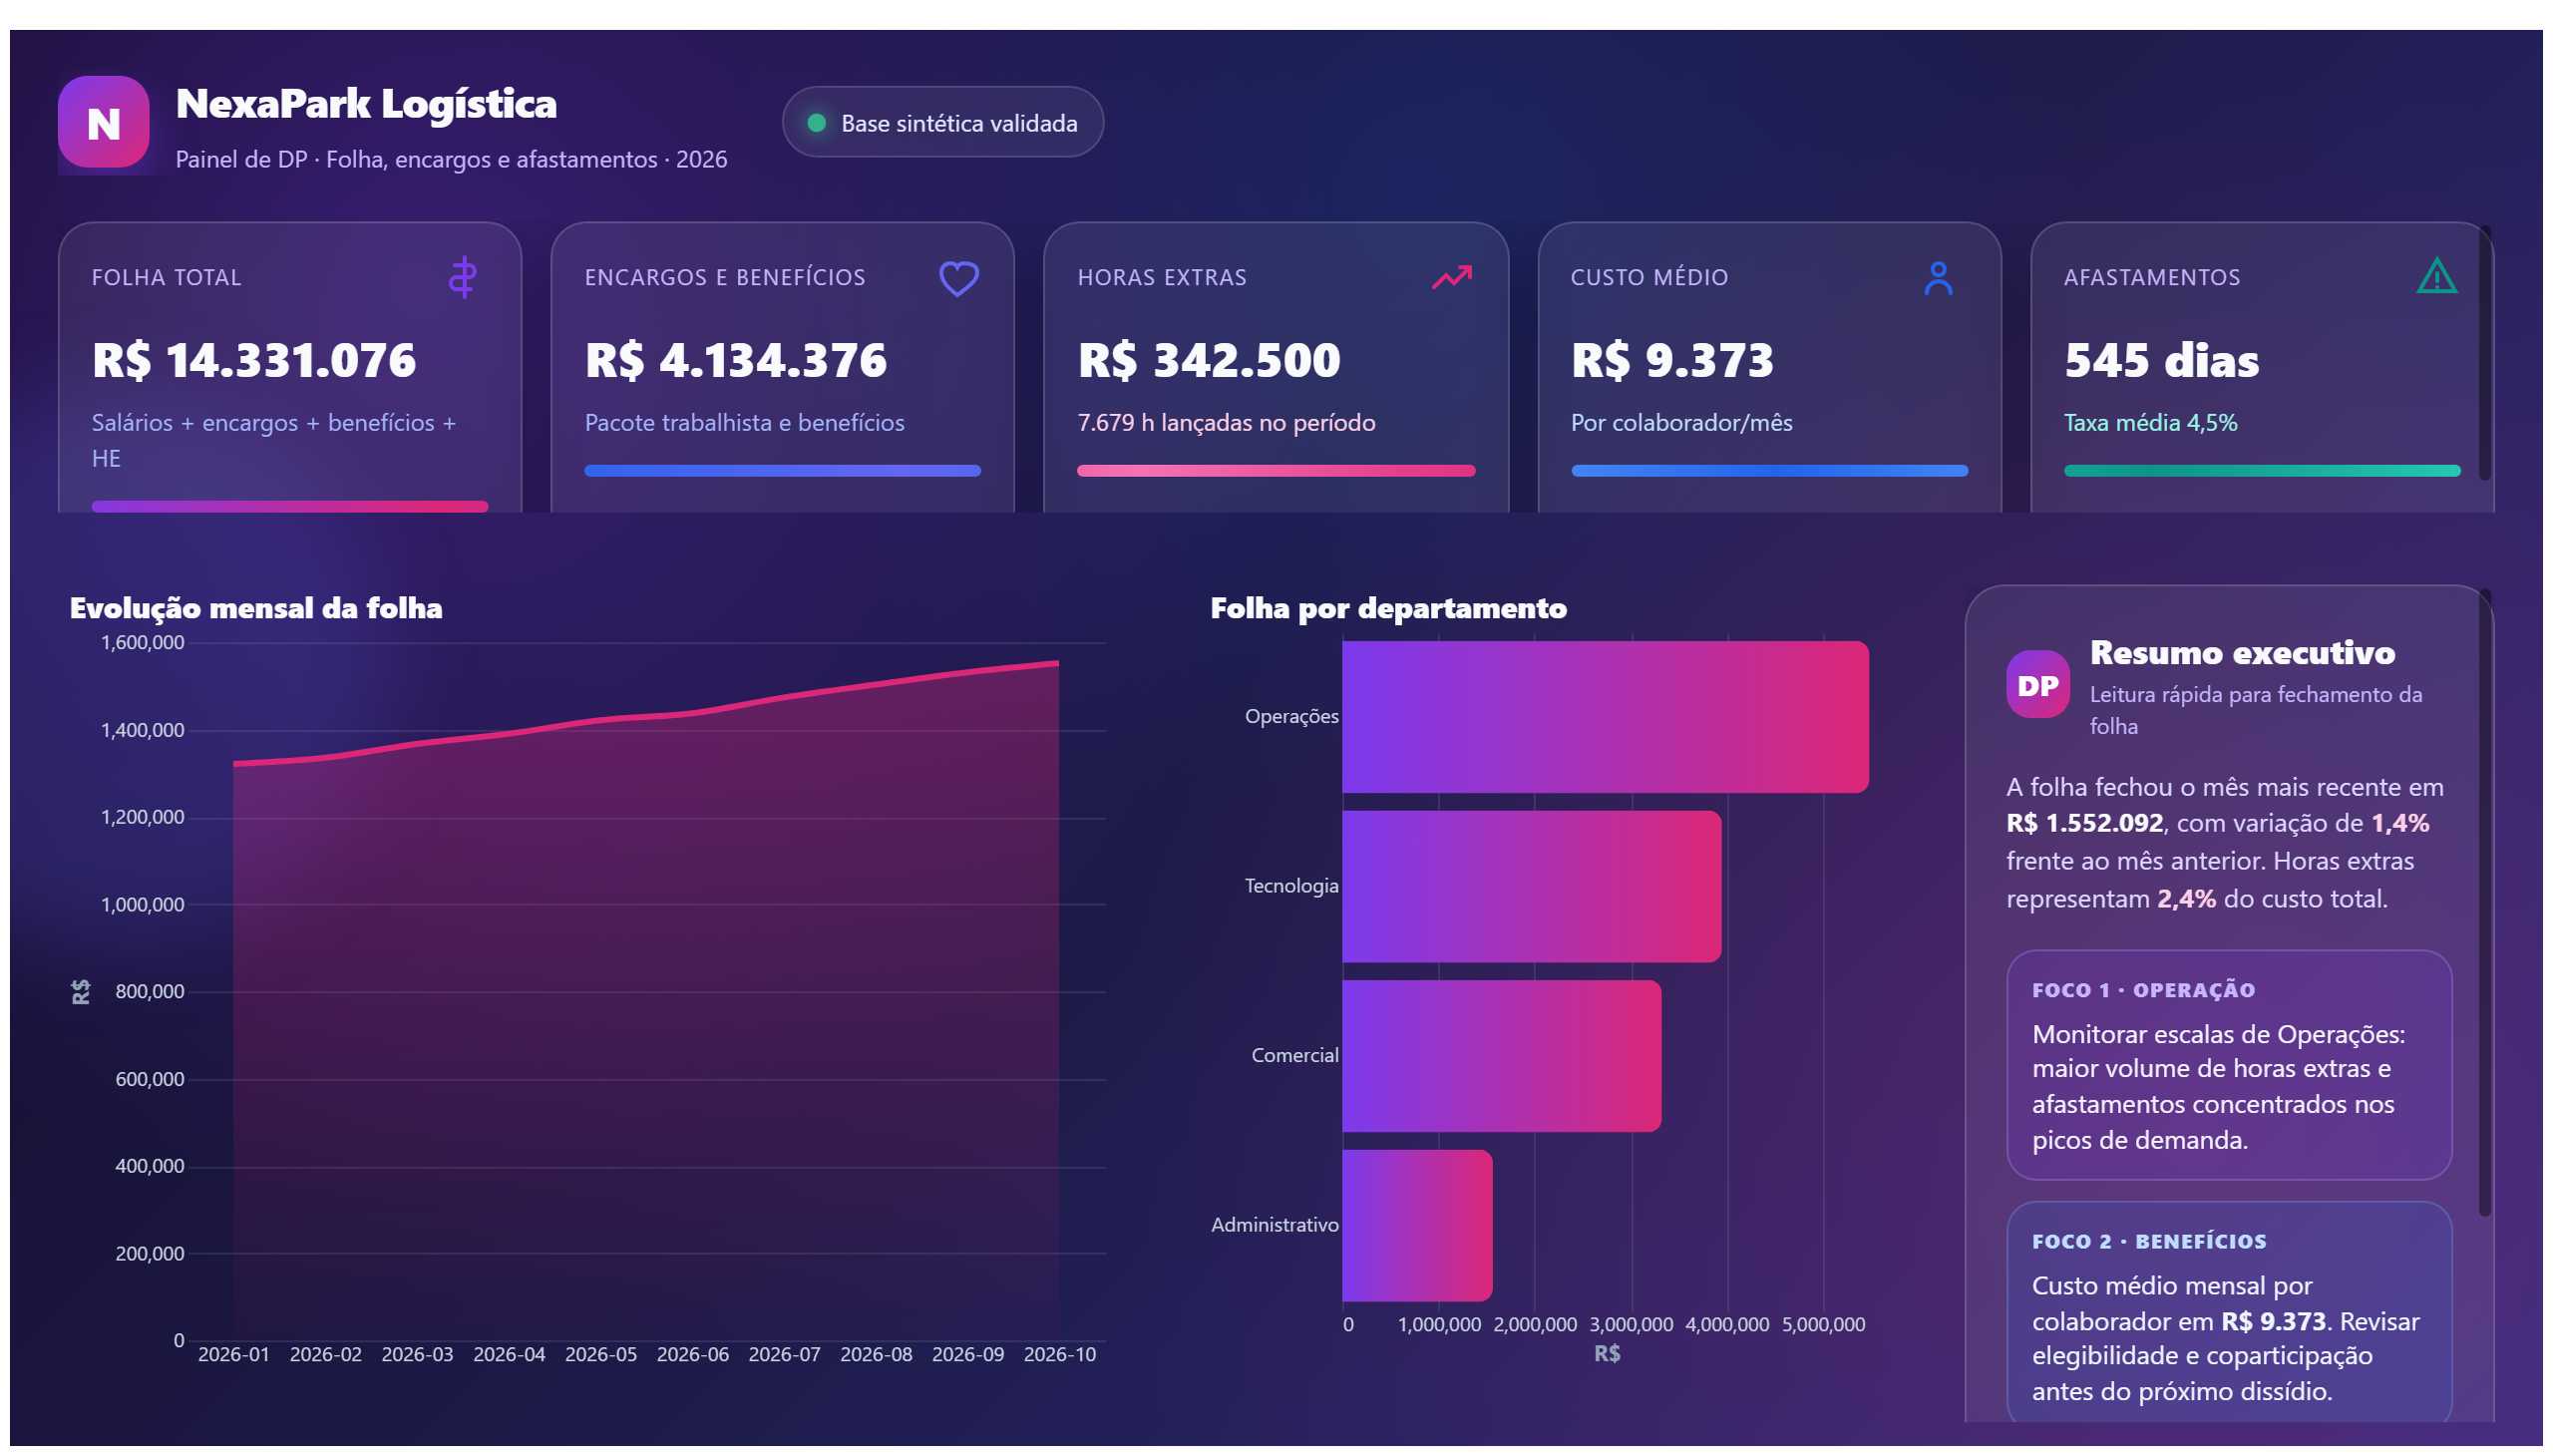
This dashboard is a fictitious example and does not contain real data. Dados fictícios para demonstração.
Save your favorite dashboards, get new templates by area and ask the AI assistant — for free.
This is a free Power BI dashboard called Dashboard demonstrativo de RH, in the RH domain. Explore KPIs, interactive visualizations and get inspired for your own data and business intelligence projects.
This dashboard is a fictitious example and does not contain real data. Dados fictícios para demonstração.
This dashboard, titled "Empresa falsa dashboard," serves as a fictional example designed to illustrate the potential layout and structure of a human resources (HR) dashboard. While it does not contain real data, it demonstrates how HR-related metrics and insights can be organized and presented effectively. The dashboard is ideal for showcasing key HR indicators such as employee demographics, turnover rates, or recruitment progress, although specific metrics are not detailed here.
Its primary purpose is to help HR professionals and business leaders visualize how data can be leveraged to answer important business questions. For example, it can guide users in understanding workforce composition, monitoring employee retention, or evaluating recruitment strategies. Despite being a demo, it provides a conceptual framework for designing dashboards that support decision-making in HR departments.
No, this dashboard is a fictional example and does not include any real data.
The dashboard is focused on the Human Resources (HR) domain.
Since it is a demo with no real data, it is intended for demonstration purposes only and not for real HR decisions.
We build a custom version for your business — US$ 50 per page, delivered within 7 calendar days.
Explore more Power BI dashboards from the same domain to compare KPIs, layouts and analytics models.
This report presents improvements in human resources management.
This case study analyzes human resources analytics, focusing on metrics and outcomes.
This dashboard may present data visualizations related to human resources.
This report presents an organizational chart, used to show a company's organizational structure.
Complete projects built by the Excelverton factory: view them live and download the PBIP — 1 free downloads every 30 days with a free account, unlimited on Pro.
Save favorites, build collections and use the AI assistant — at no cost.