Clase03
This report may be a class exercise focused on data analysis.
Create a free account
Save your favorite dashboards, get new templates by area and ask the AI assistant — for free.
About the Clase03 dashboard
This is a free Power BI dashboard called Clase03, in the Educação domain. Explore KPIs, interactive visualizations and get inspired for your own data and business intelligence projects.
This report may be a class exercise focused on data analysis.
Dashboard analysis
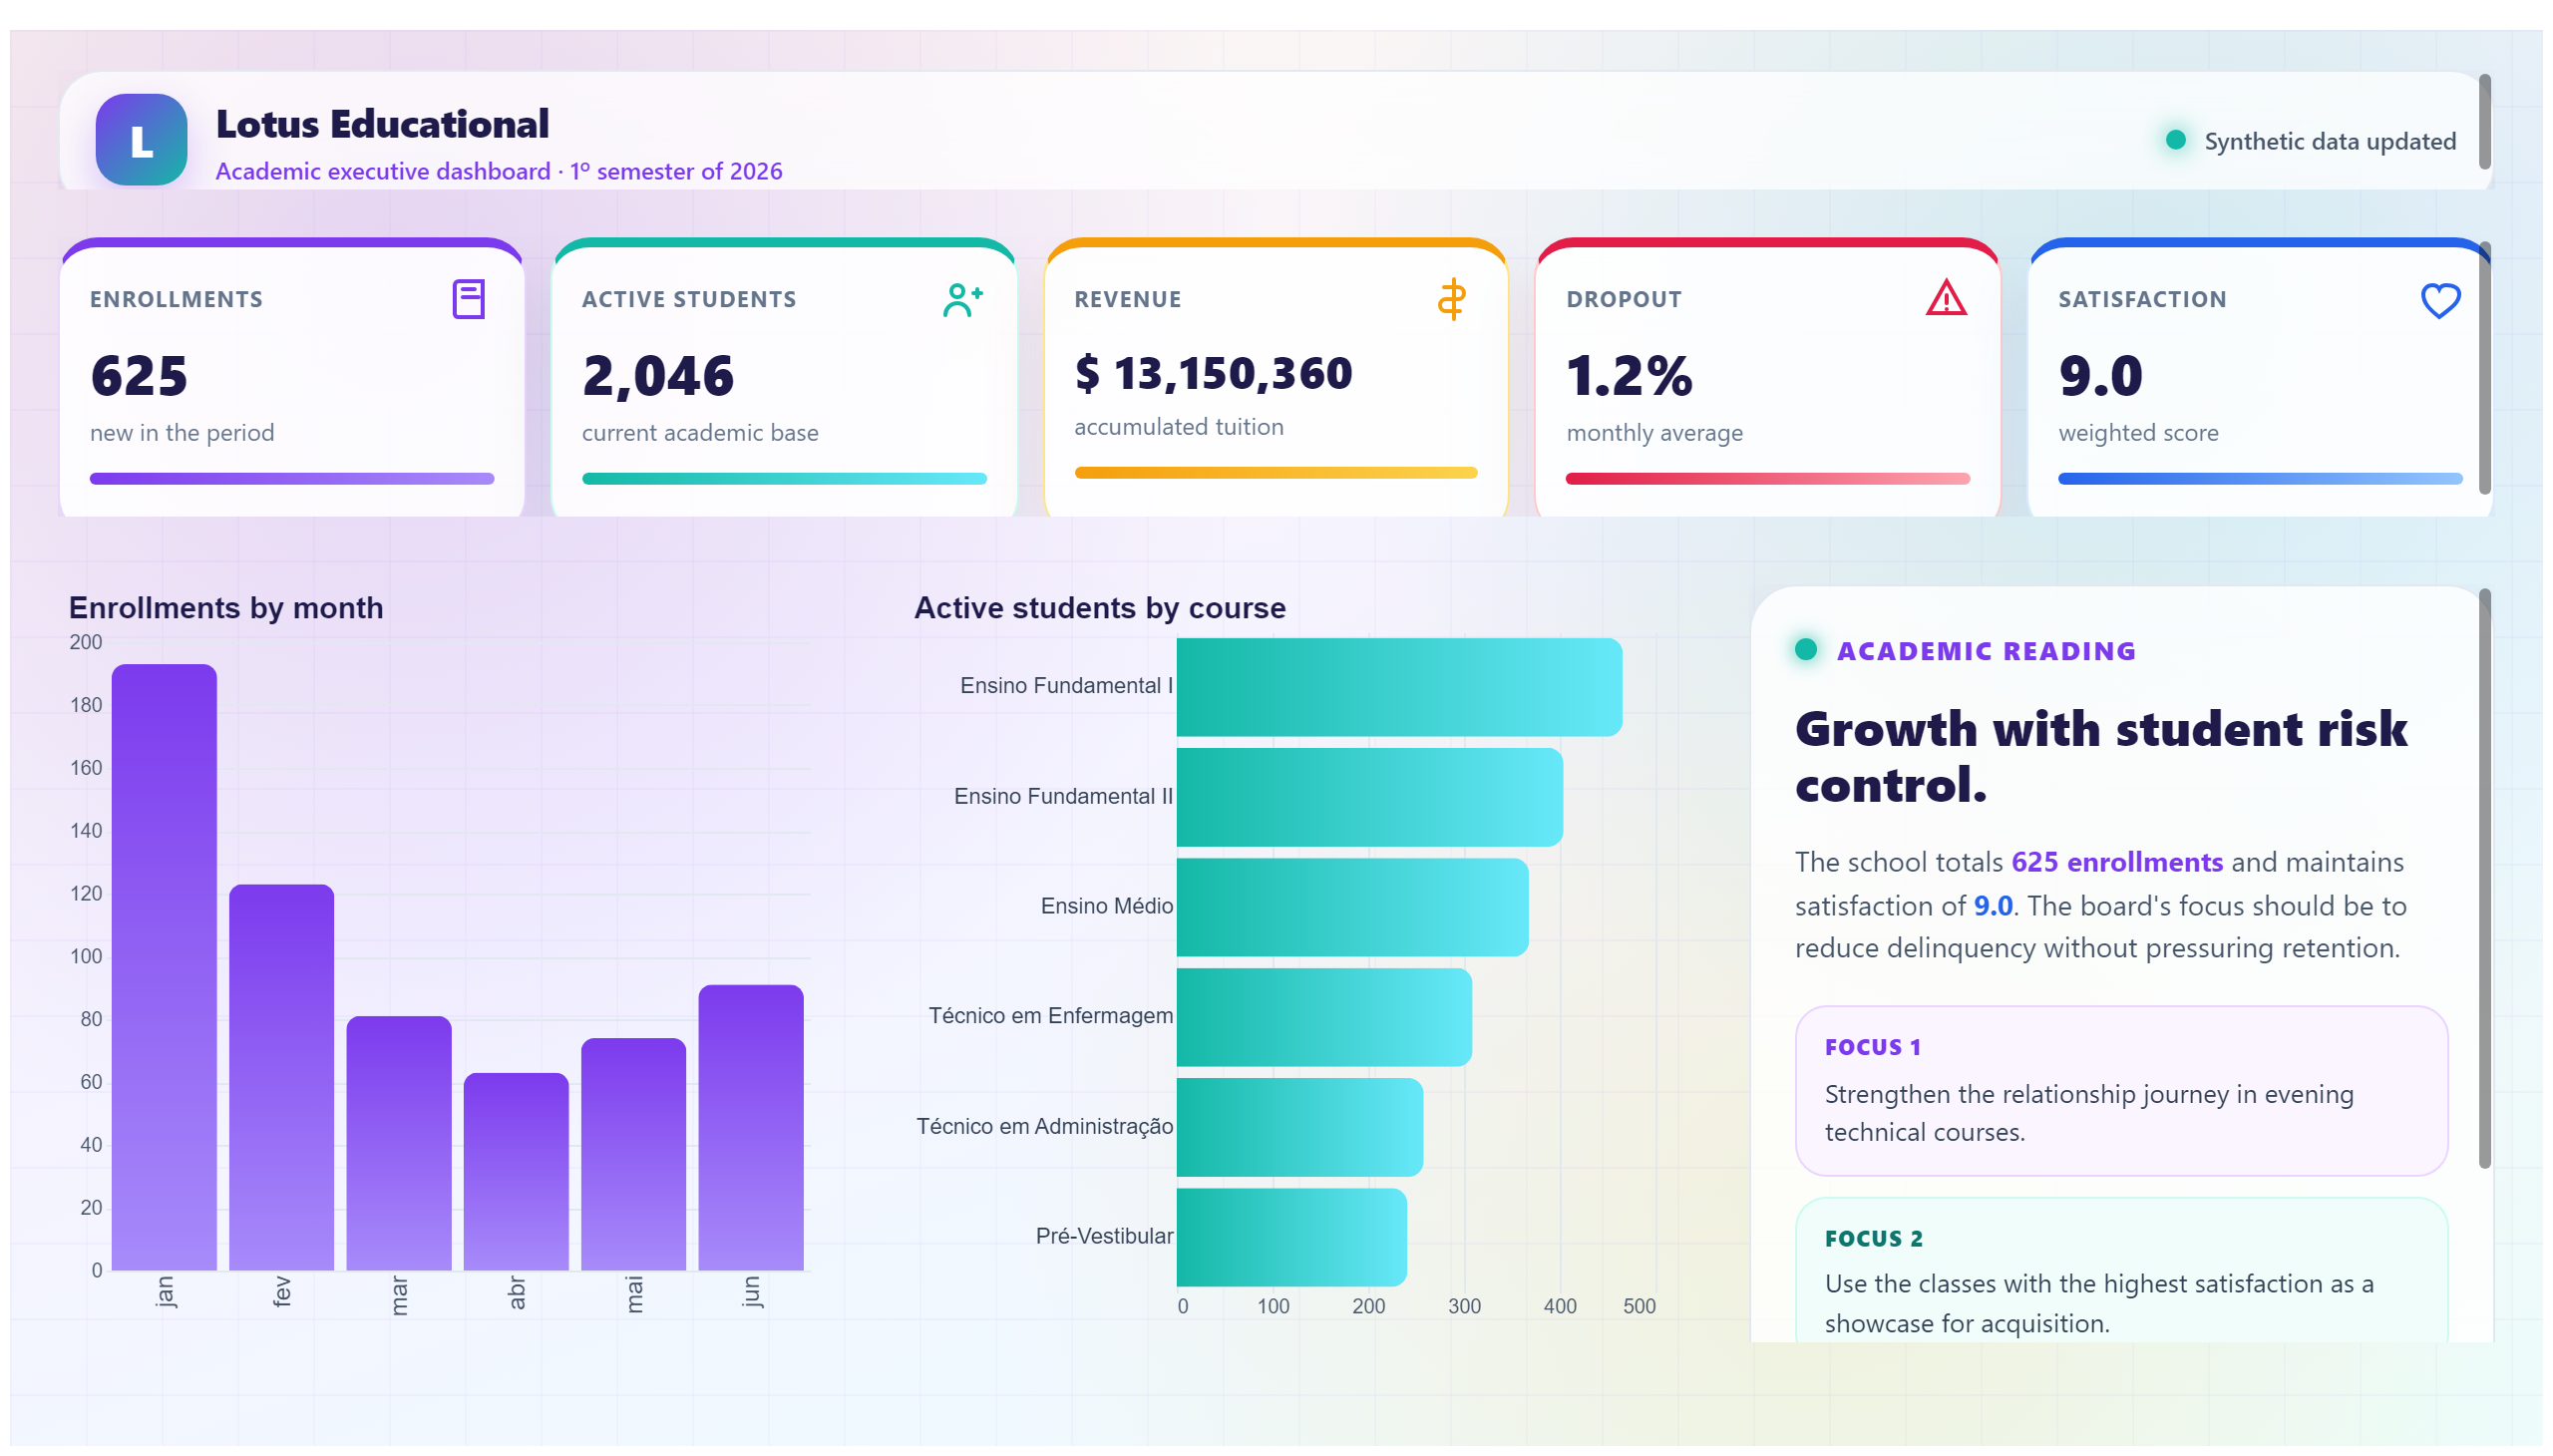
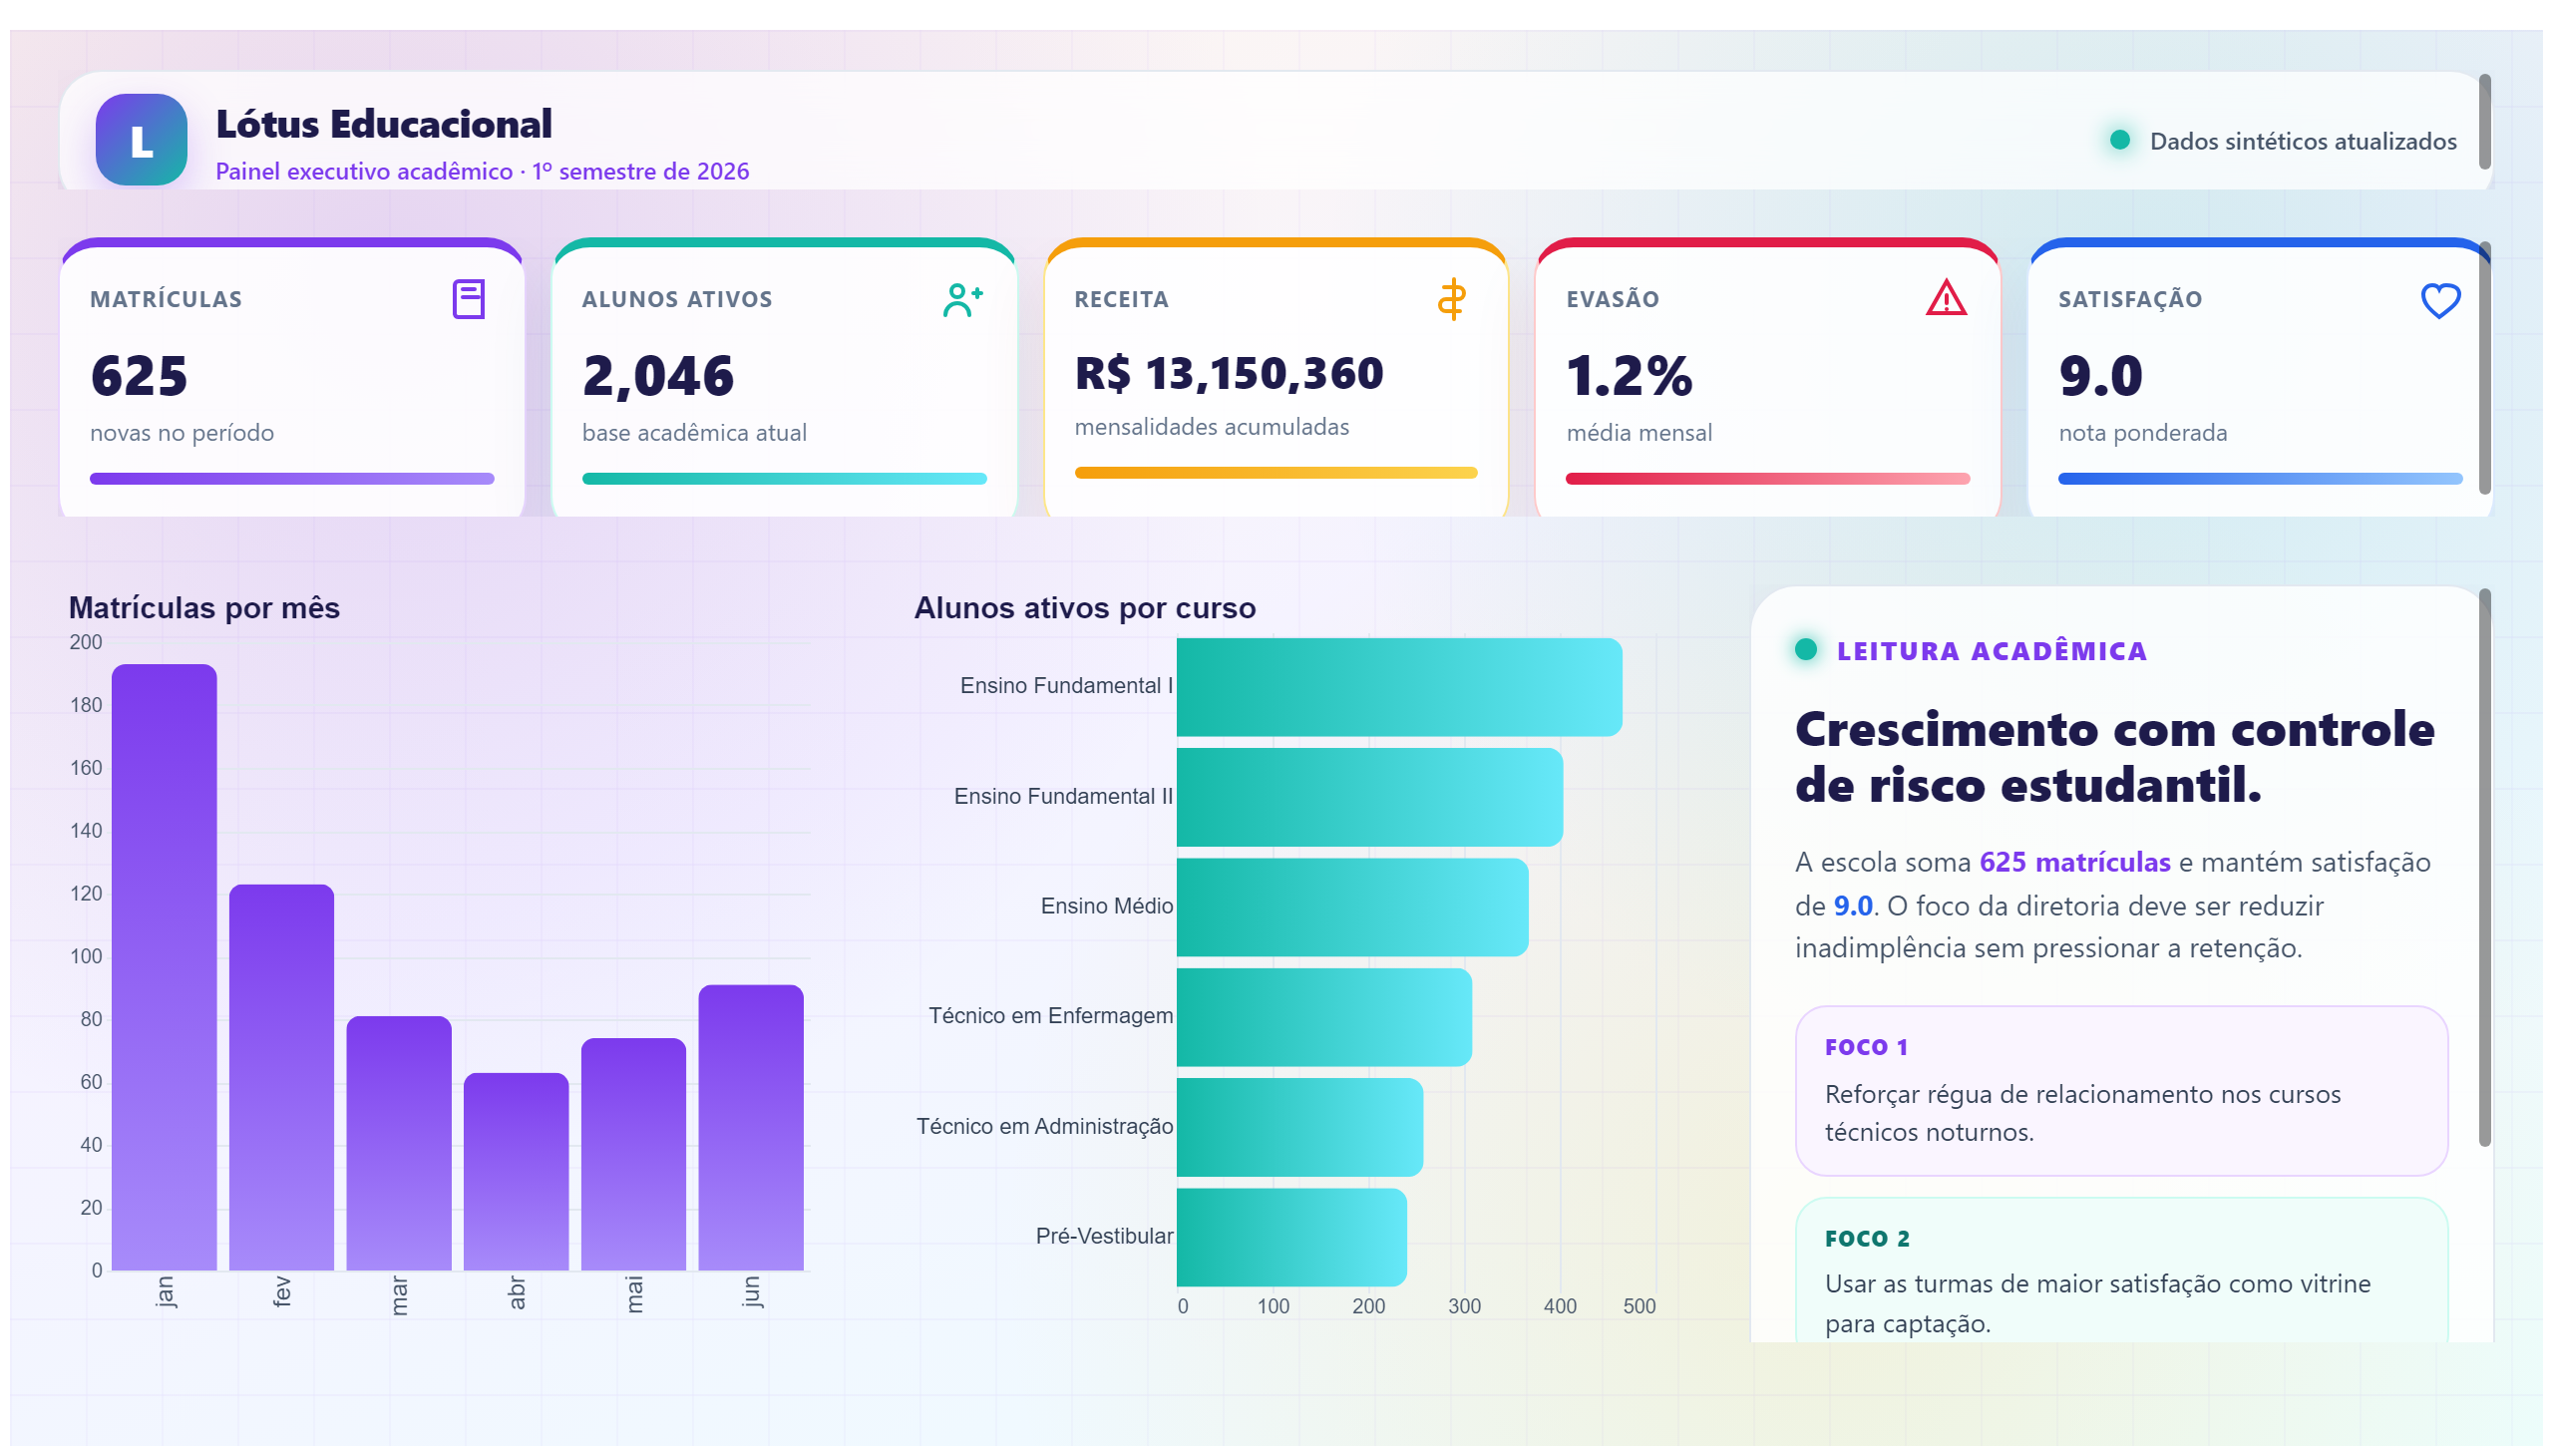
Clase03 is an educational dashboard designed as a classroom exercise focused on data analysis. It provides users with practical insights into how to interpret and manipulate data effectively within an academic context. The report serves as a hands-on tool for students and educators to explore fundamental data analysis concepts and apply them to real-world scenarios.
The dashboard answers key business questions such as how data trends evolve over time, what patterns can be identified in the dataset, and how different variables relate to each other. It is particularly useful for those learning data analysis techniques, helping them to understand the process of extracting meaningful information from raw data.
Overall, Clase03 is tailored for the education domain, specifically targeting students and instructors interested in enhancing their data analysis skills. It encourages interactive learning by providing a structured yet flexible environment for exploring data-driven decision-making.
Frequently asked questions about this dashboard
What is the primary purpose of the Clase03 dashboard?
The primary purpose is to serve as a classroom exercise focused on teaching data analysis concepts within an educational setting.
Who is the intended audience for this dashboard?
The intended audience includes students and educators involved in data analysis and education domains.
What kind of business questions does this dashboard help answer?
It helps answer questions related to data trends, patterns, and relationships between variables to support learning in data analysis.
Want a dashboard like this with your data?
We build a custom version for your business — US$ 50 per page, delivered within 7 calendar days.
Education Power BI templates
Complete projects built by the Excelverton factory: view them live with a free account and download the PBIP as a channel subscriber (1/month) or Pro subscriber (unlimited).
Create your free account
Save favorites, build collections and use the AI assistant — at no cost.