DataCo Supply Chain- CP-1
This report analyzes the company's supply chain, possibly focusing on efficiency and costs.
Create a free account
Save your favorite dashboards, get new templates by area and ask the AI assistant — for free.
About the DataCo Supply Chain- CP-1 dashboard
This is a free Power BI dashboard called DataCo Supply Chain- CP-1, in the Logística domain. Explore KPIs, interactive visualizations and get inspired for your own data and business intelligence projects.
This report analyzes the company's supply chain, possibly focusing on efficiency and costs.
Dashboard analysis
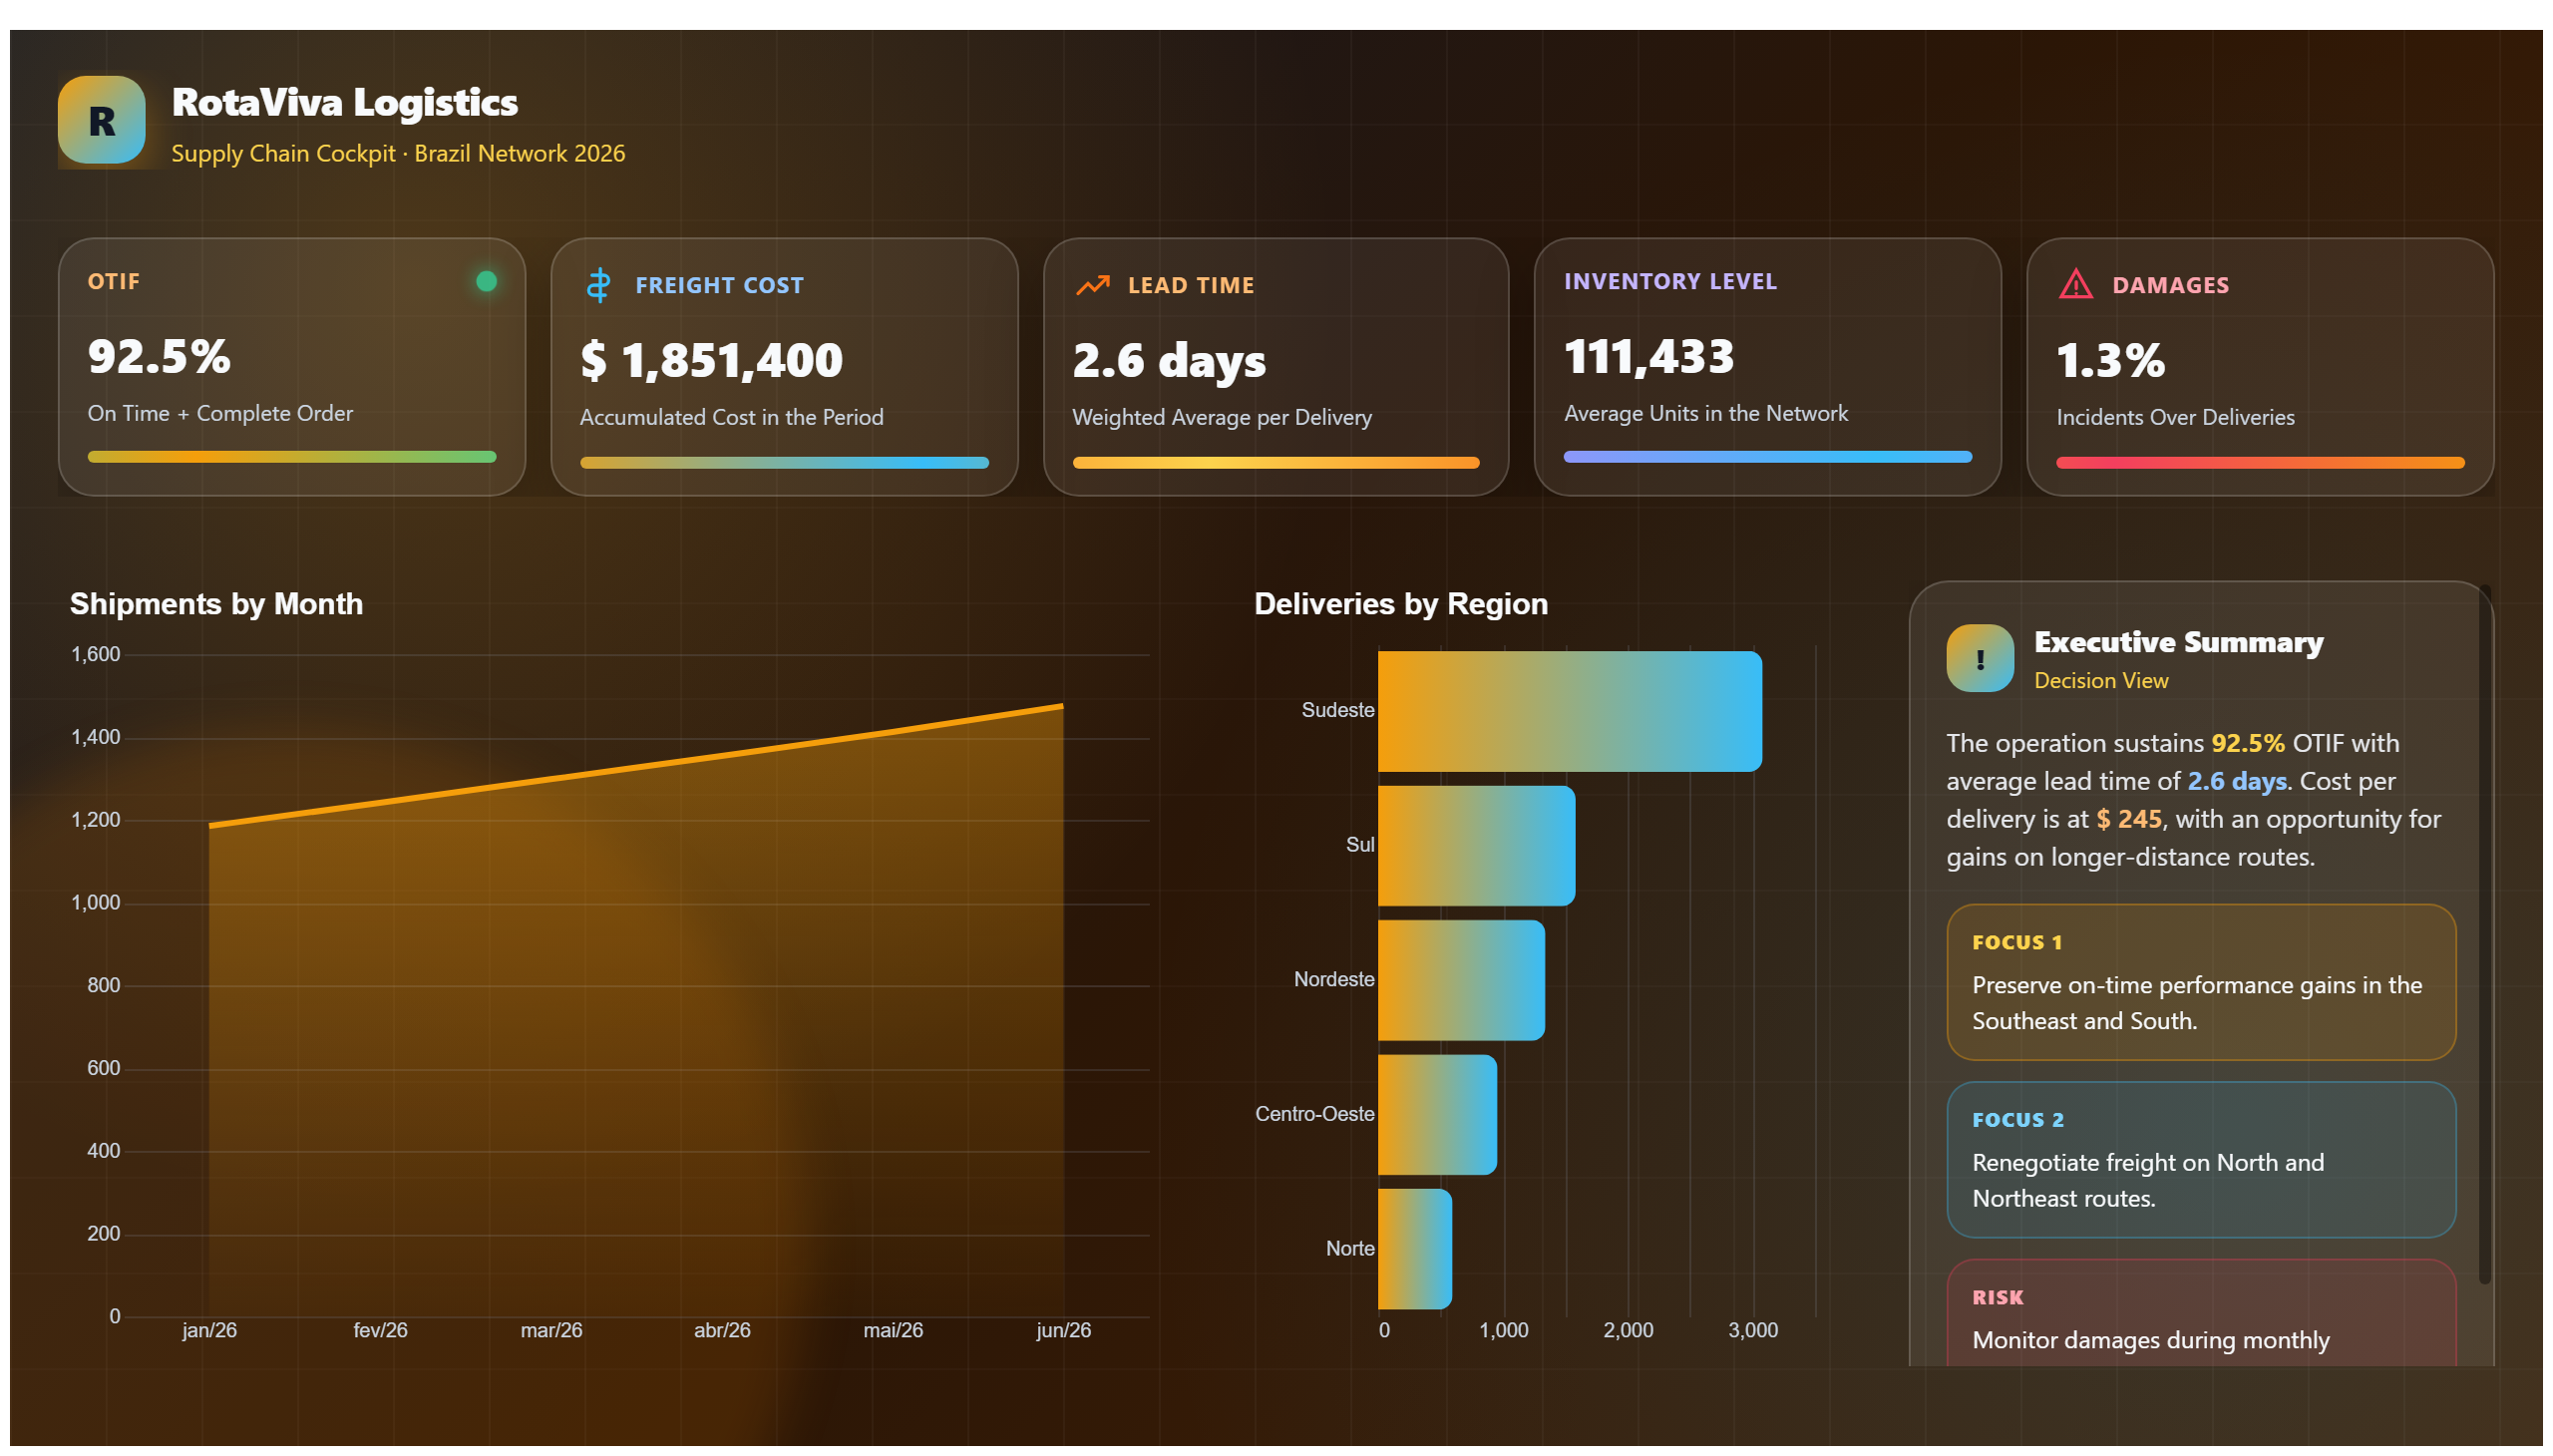
The DataCo Supply Chain- CP-1 dashboard provides a comprehensive view of the company's supply chain operations, focusing primarily on efficiency and cost management. It visualizes key metrics that help stakeholders understand how well the supply chain is performing in terms of resource utilization, delivery times, and overall cost control. By consolidating this data into an interactive report, the dashboard enables users to quickly identify bottlenecks or inefficiencies that may be driving up expenses or delaying shipments.
This report answers critical business questions such as: Where are the main cost drivers within the supply chain? How efficient are the current processes in meeting demand? Which areas require immediate attention to improve operational performance? It is particularly useful for supply chain managers, operations analysts, and financial controllers who need to monitor performance indicators and make data-driven decisions to optimize the supply chain.
Overall, this dashboard serves as a vital tool for improving supply chain transparency and supporting strategic initiatives aimed at reducing costs while maintaining or enhancing service levels.
Frequently asked questions about this dashboard
What key metrics does the DataCo Supply Chain- CP-1 dashboard track?
The dashboard tracks metrics related to supply chain efficiency and costs, including resource utilization, delivery times, and overall operational expenses.
Who is the primary audience for this dashboard?
The primary users are supply chain managers, operations analysts, and financial controllers focused on monitoring and improving supply chain performance.
How can this dashboard help improve supply chain operations?
By identifying inefficiencies and cost drivers, the dashboard enables stakeholders to target areas for improvement, optimize processes, and reduce expenses.
Want a dashboard like this with your data?
We build a custom version for your business — US$ 50 per page, delivered within 7 calendar days.
Logistics Power BI templates
Complete projects built by the Excelverton factory: view them live with a free account and download the PBIP as a channel subscriber (1/month) or Pro subscriber (unlimited).
Create your free account
Save favorites, build collections and use the AI assistant — at no cost.