Dashboard preview
FrotasLogistica
This report analyzes fleet logistics data, including efficiency and costs.
This report addresses logistical aspects, possibly showing transportation and storage data.
Save your favorite dashboards, get new templates by area and ask the AI assistant — for free.
This is a free Power BI dashboard called BaseLogistica, in the Logística domain. Explore KPIs, interactive visualizations and get inspired for your own data and business intelligence projects.
This report addresses logistical aspects, possibly showing transportation and storage data.
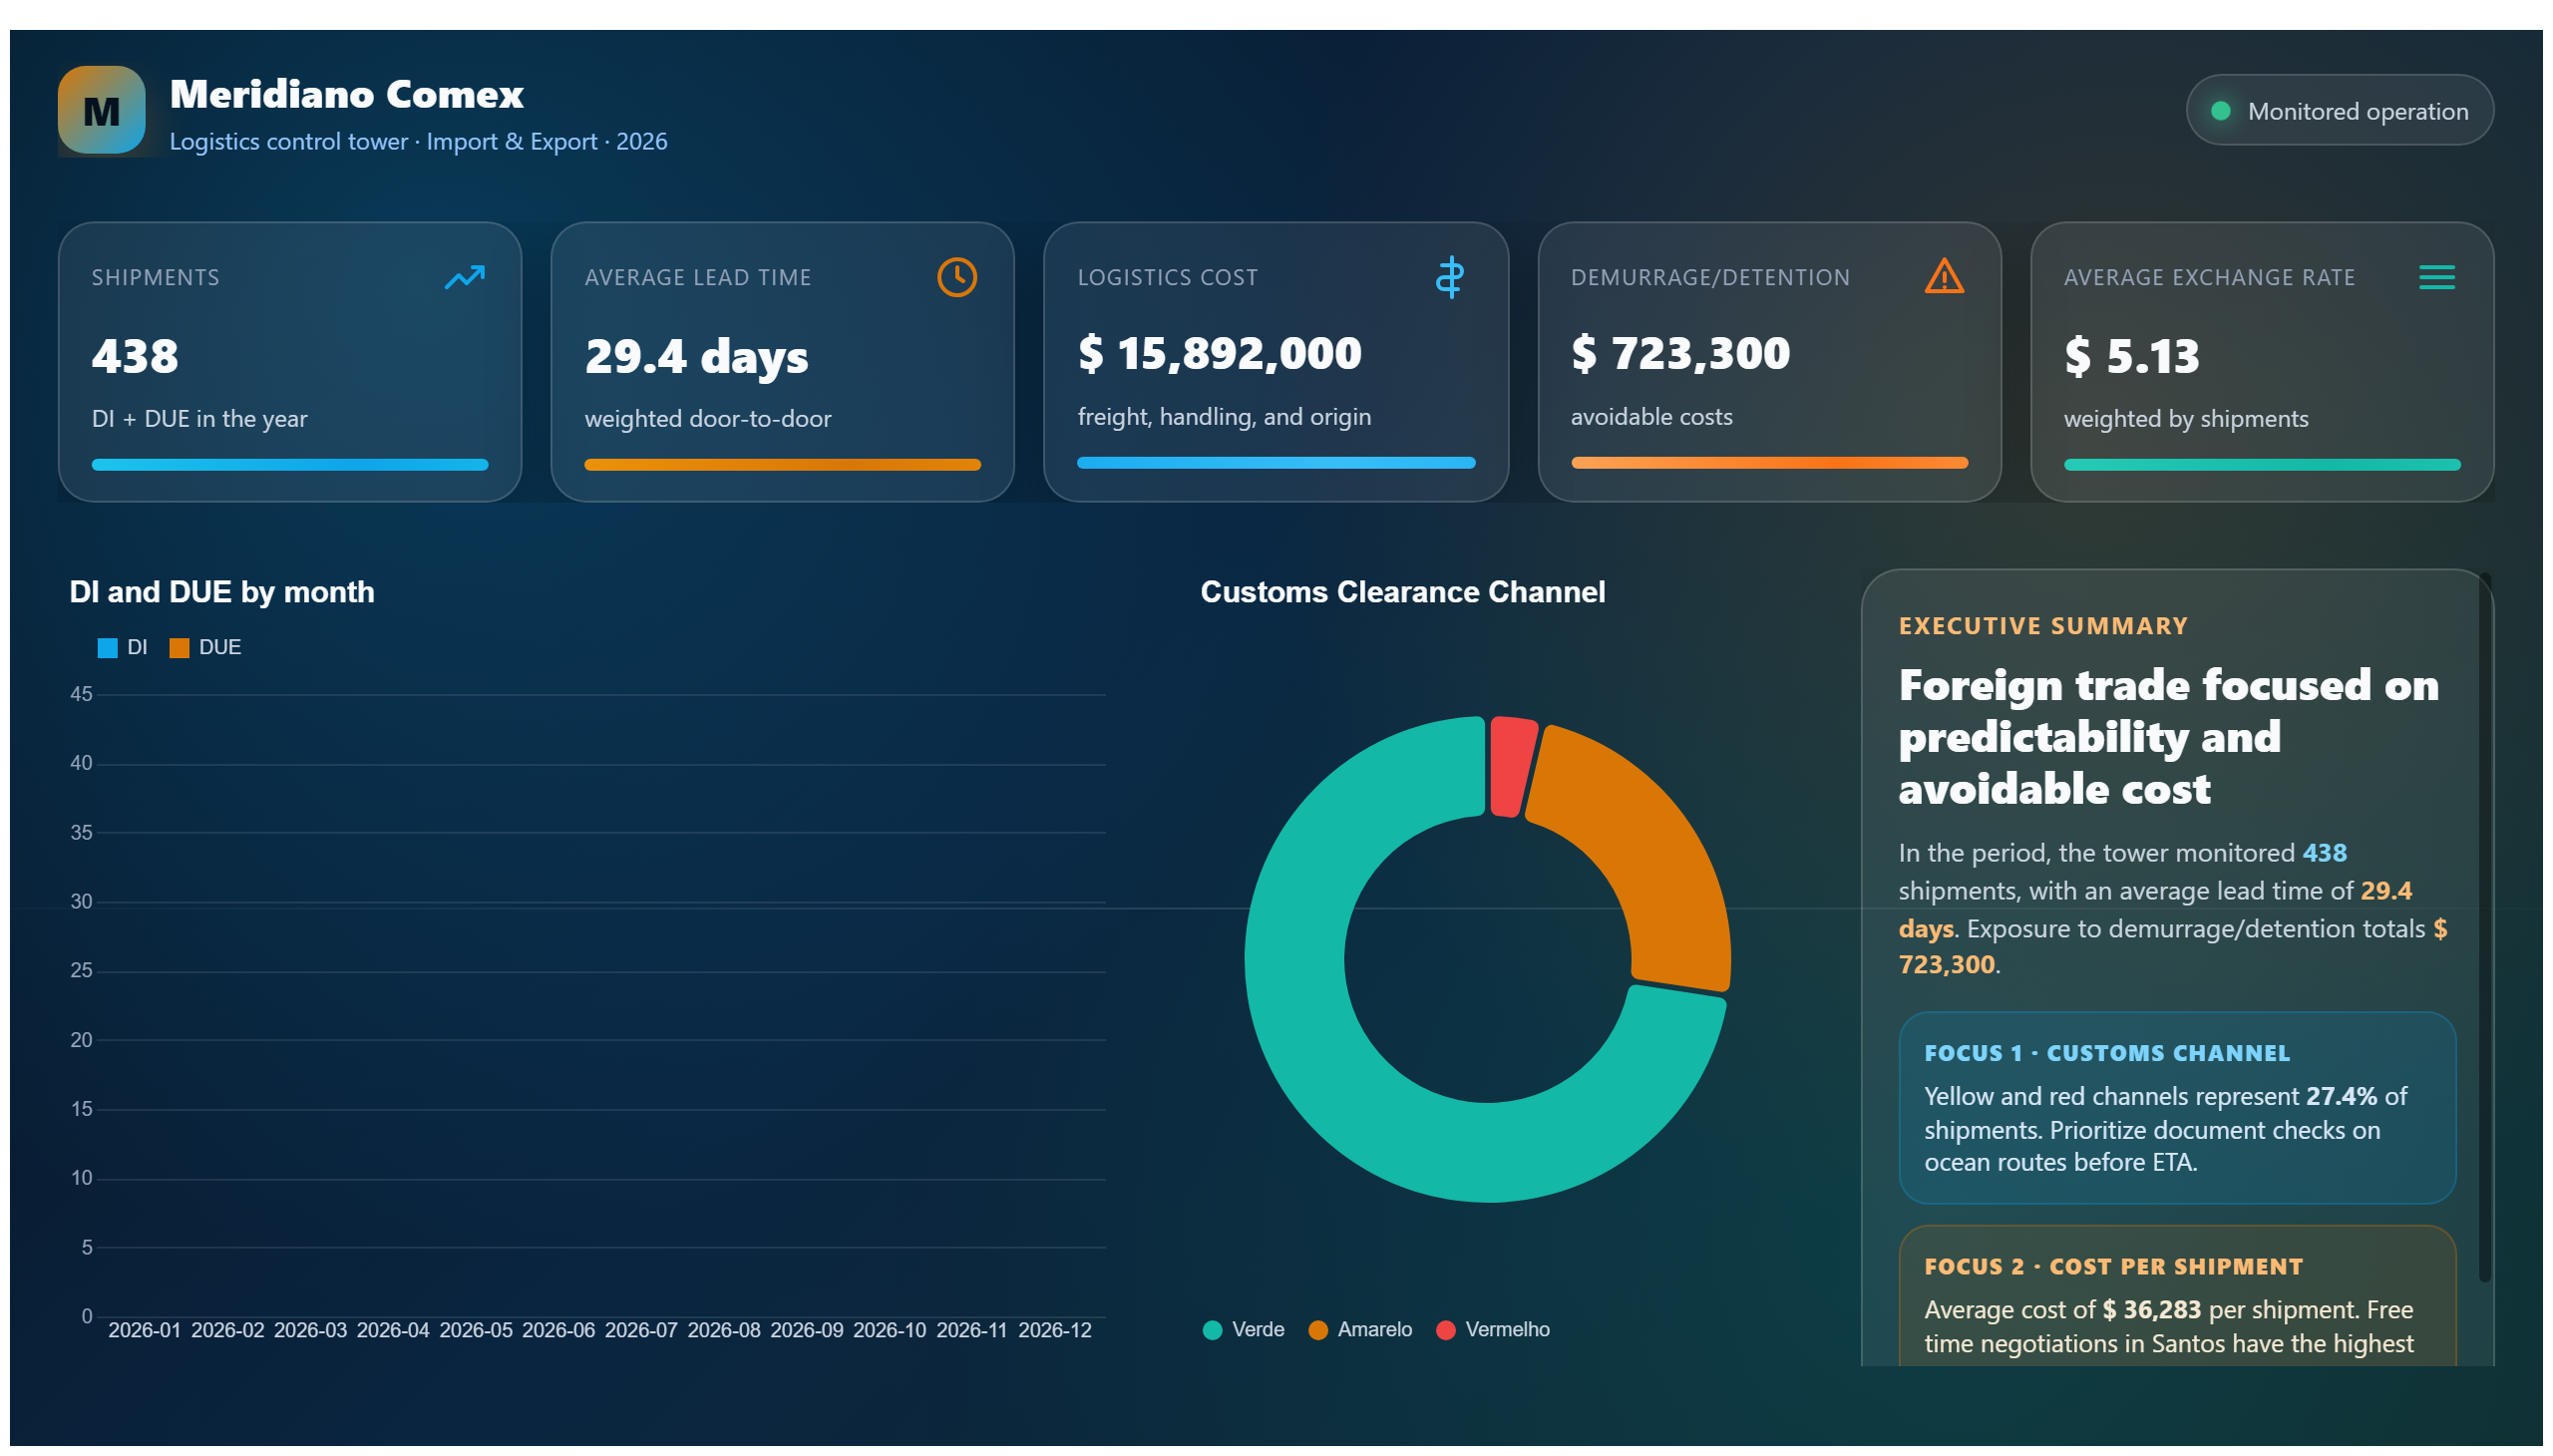
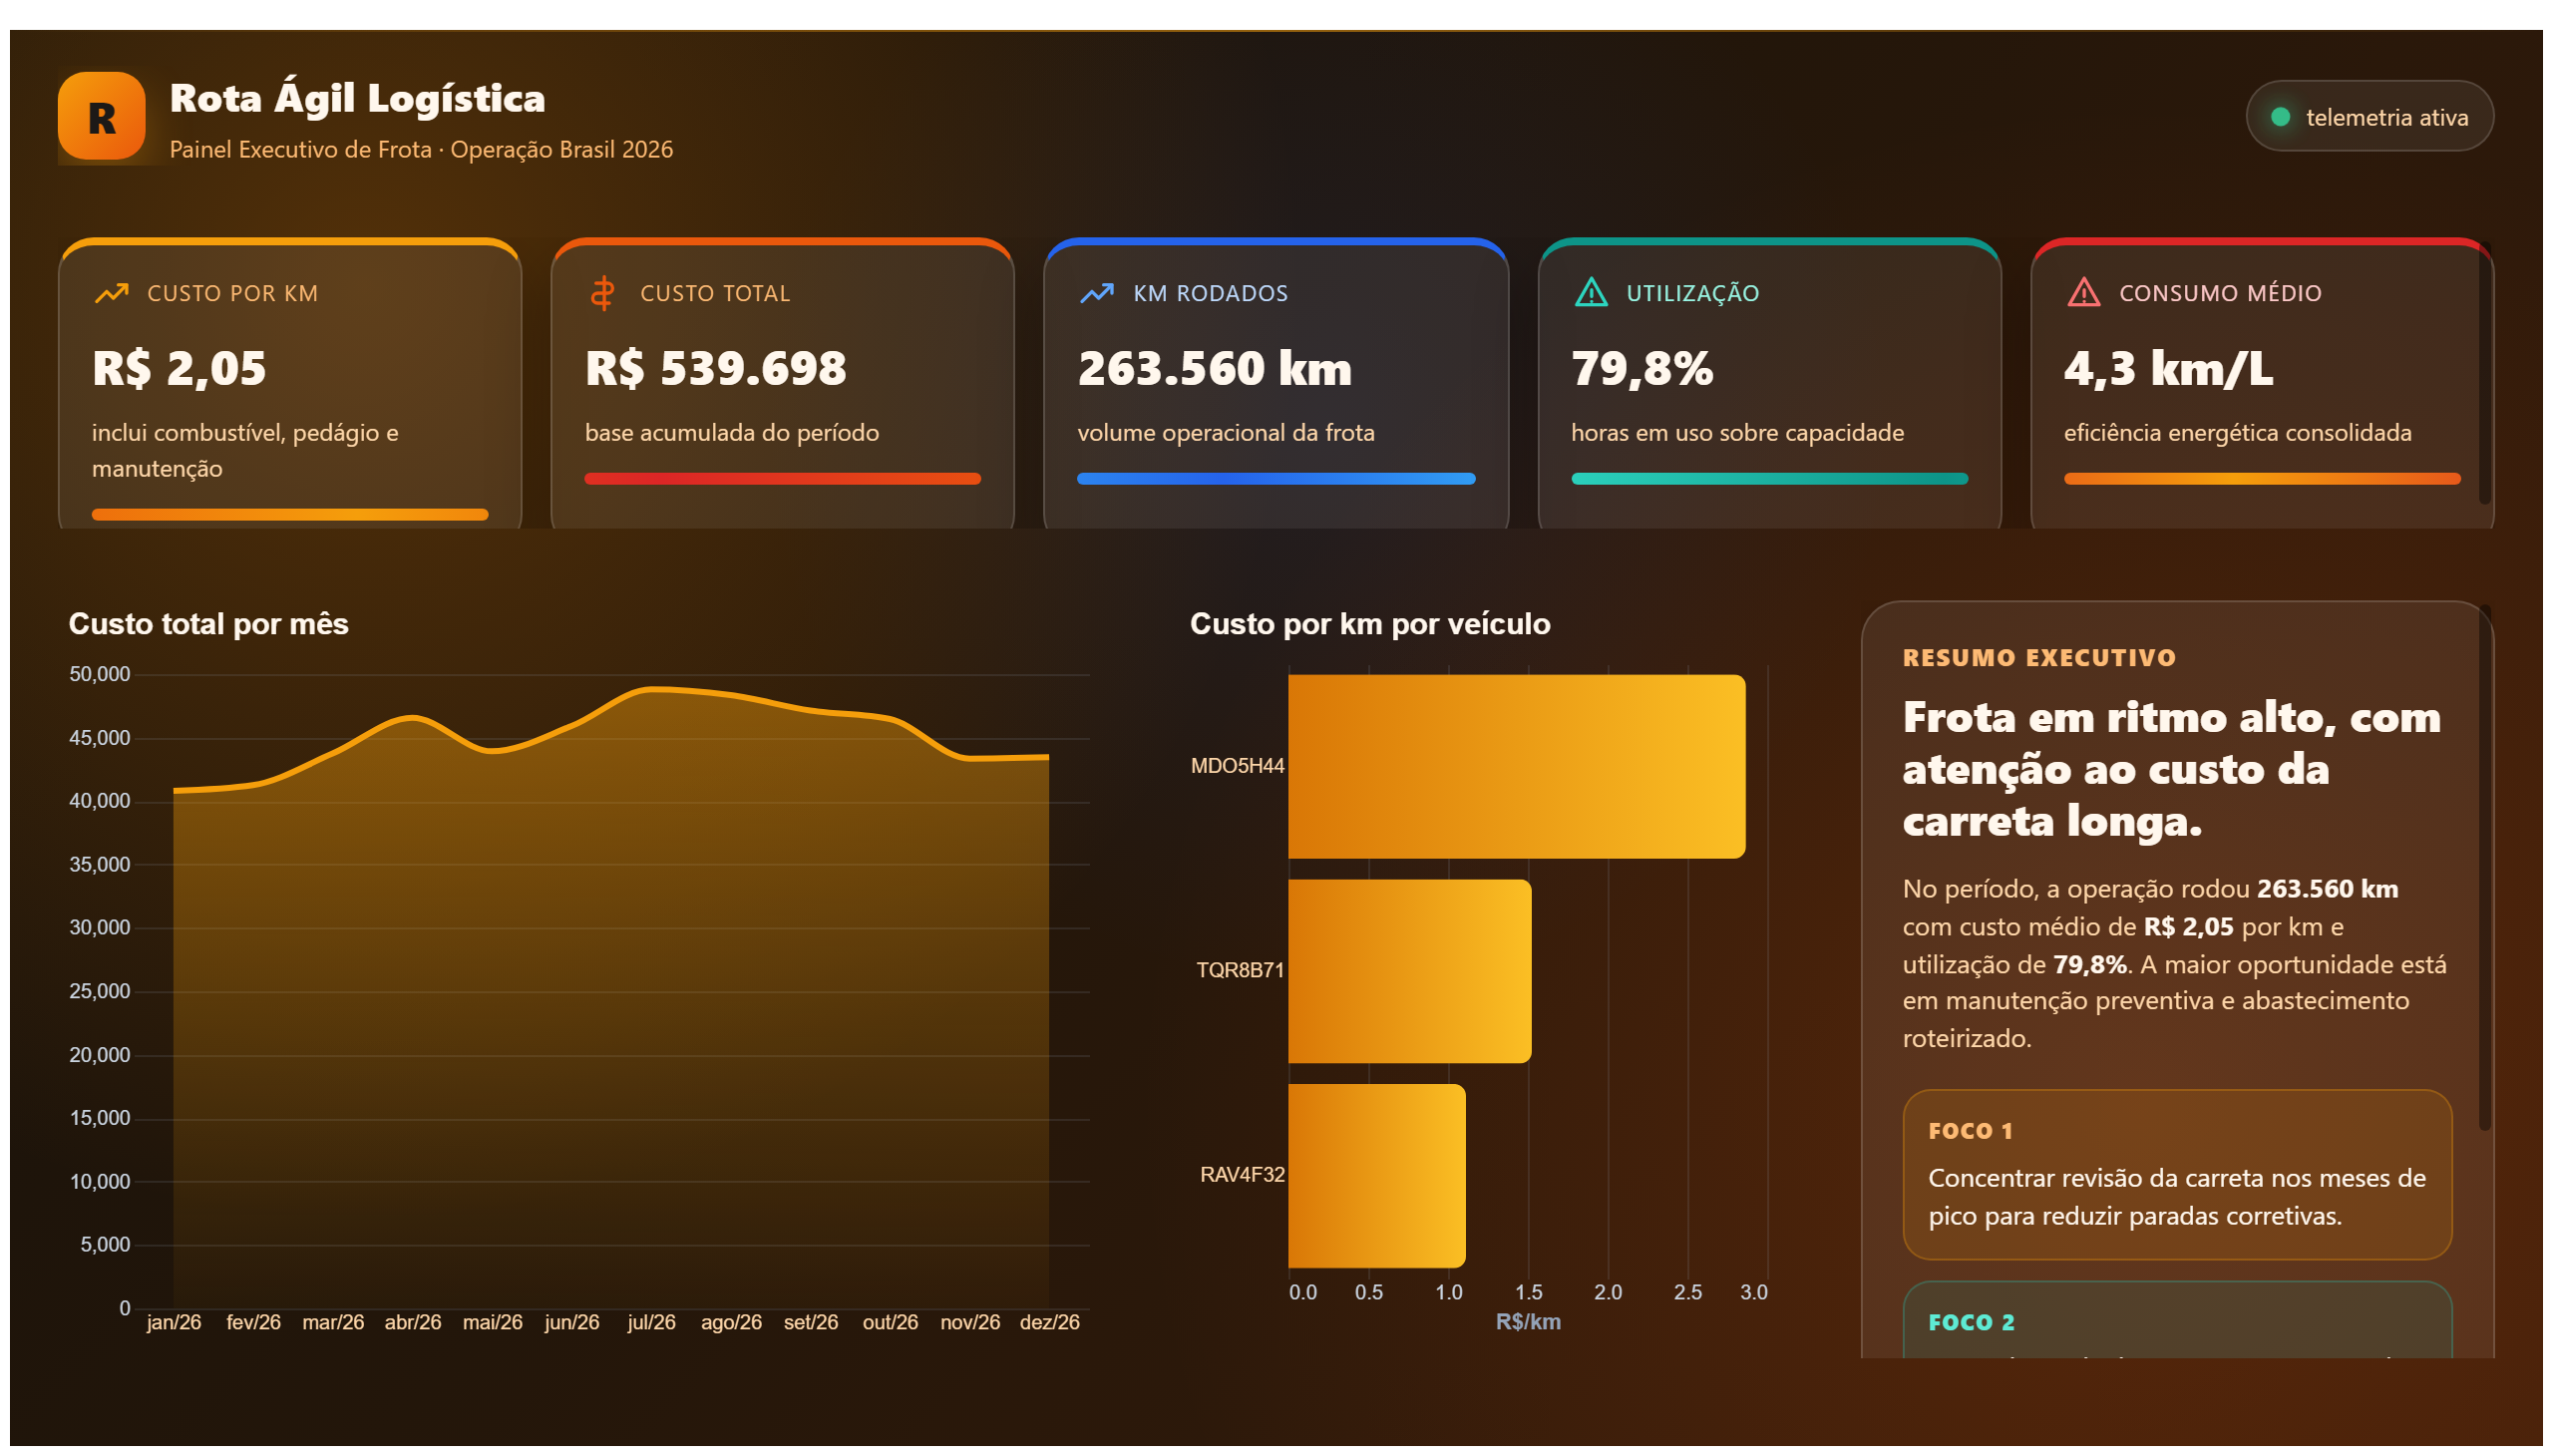
The BaseLogistica dashboard offers a comprehensive overview of logistical operations, focusing on key aspects such as transportation and storage. It provides users with critical insights into how goods are moved and stored within the supply chain, enabling better management of resources and operational efficiency. By visualizing data related to shipment volumes, transit times, and warehouse capacities, the dashboard helps identify bottlenecks and opportunities for optimization.
This report answers essential business questions like: How efficient are current transportation routes? Are storage facilities being utilized optimally? What are the trends in shipment delays or inventory turnover? These insights support decision-making processes for logistics managers, supply chain analysts, and operational planners who aim to streamline logistics workflows and reduce costs.
Overall, the BaseLogistica dashboard is a valuable tool for professionals involved in supply chain management, offering actionable data to enhance transportation planning and warehouse management, ultimately improving overall supply chain performance.
The dashboard visualizes data related to transportation and storage, including shipment volumes, transit times, and warehouse capacity utilization.
The primary audience includes logistics managers, supply chain analysts, and operational planners responsible for managing transportation and storage within the supply chain.
By identifying inefficiencies in transportation routes and storage utilization, the dashboard enables users to optimize logistics processes, reduce delays, and improve overall operational efficiency.
We build a custom version for your business — US$ 50 per page, delivered within 7 calendar days.
Complete projects built by the Excelverton factory: view them live with a free account and download the PBIP as a channel subscriber (1/month) or Pro subscriber (unlimited).
Save favorites, build collections and use the AI assistant — at no cost.