Educational Outcomes and Literacy Across the Globe
This report may show educational outcomes and literacy rates in different regions of the world.
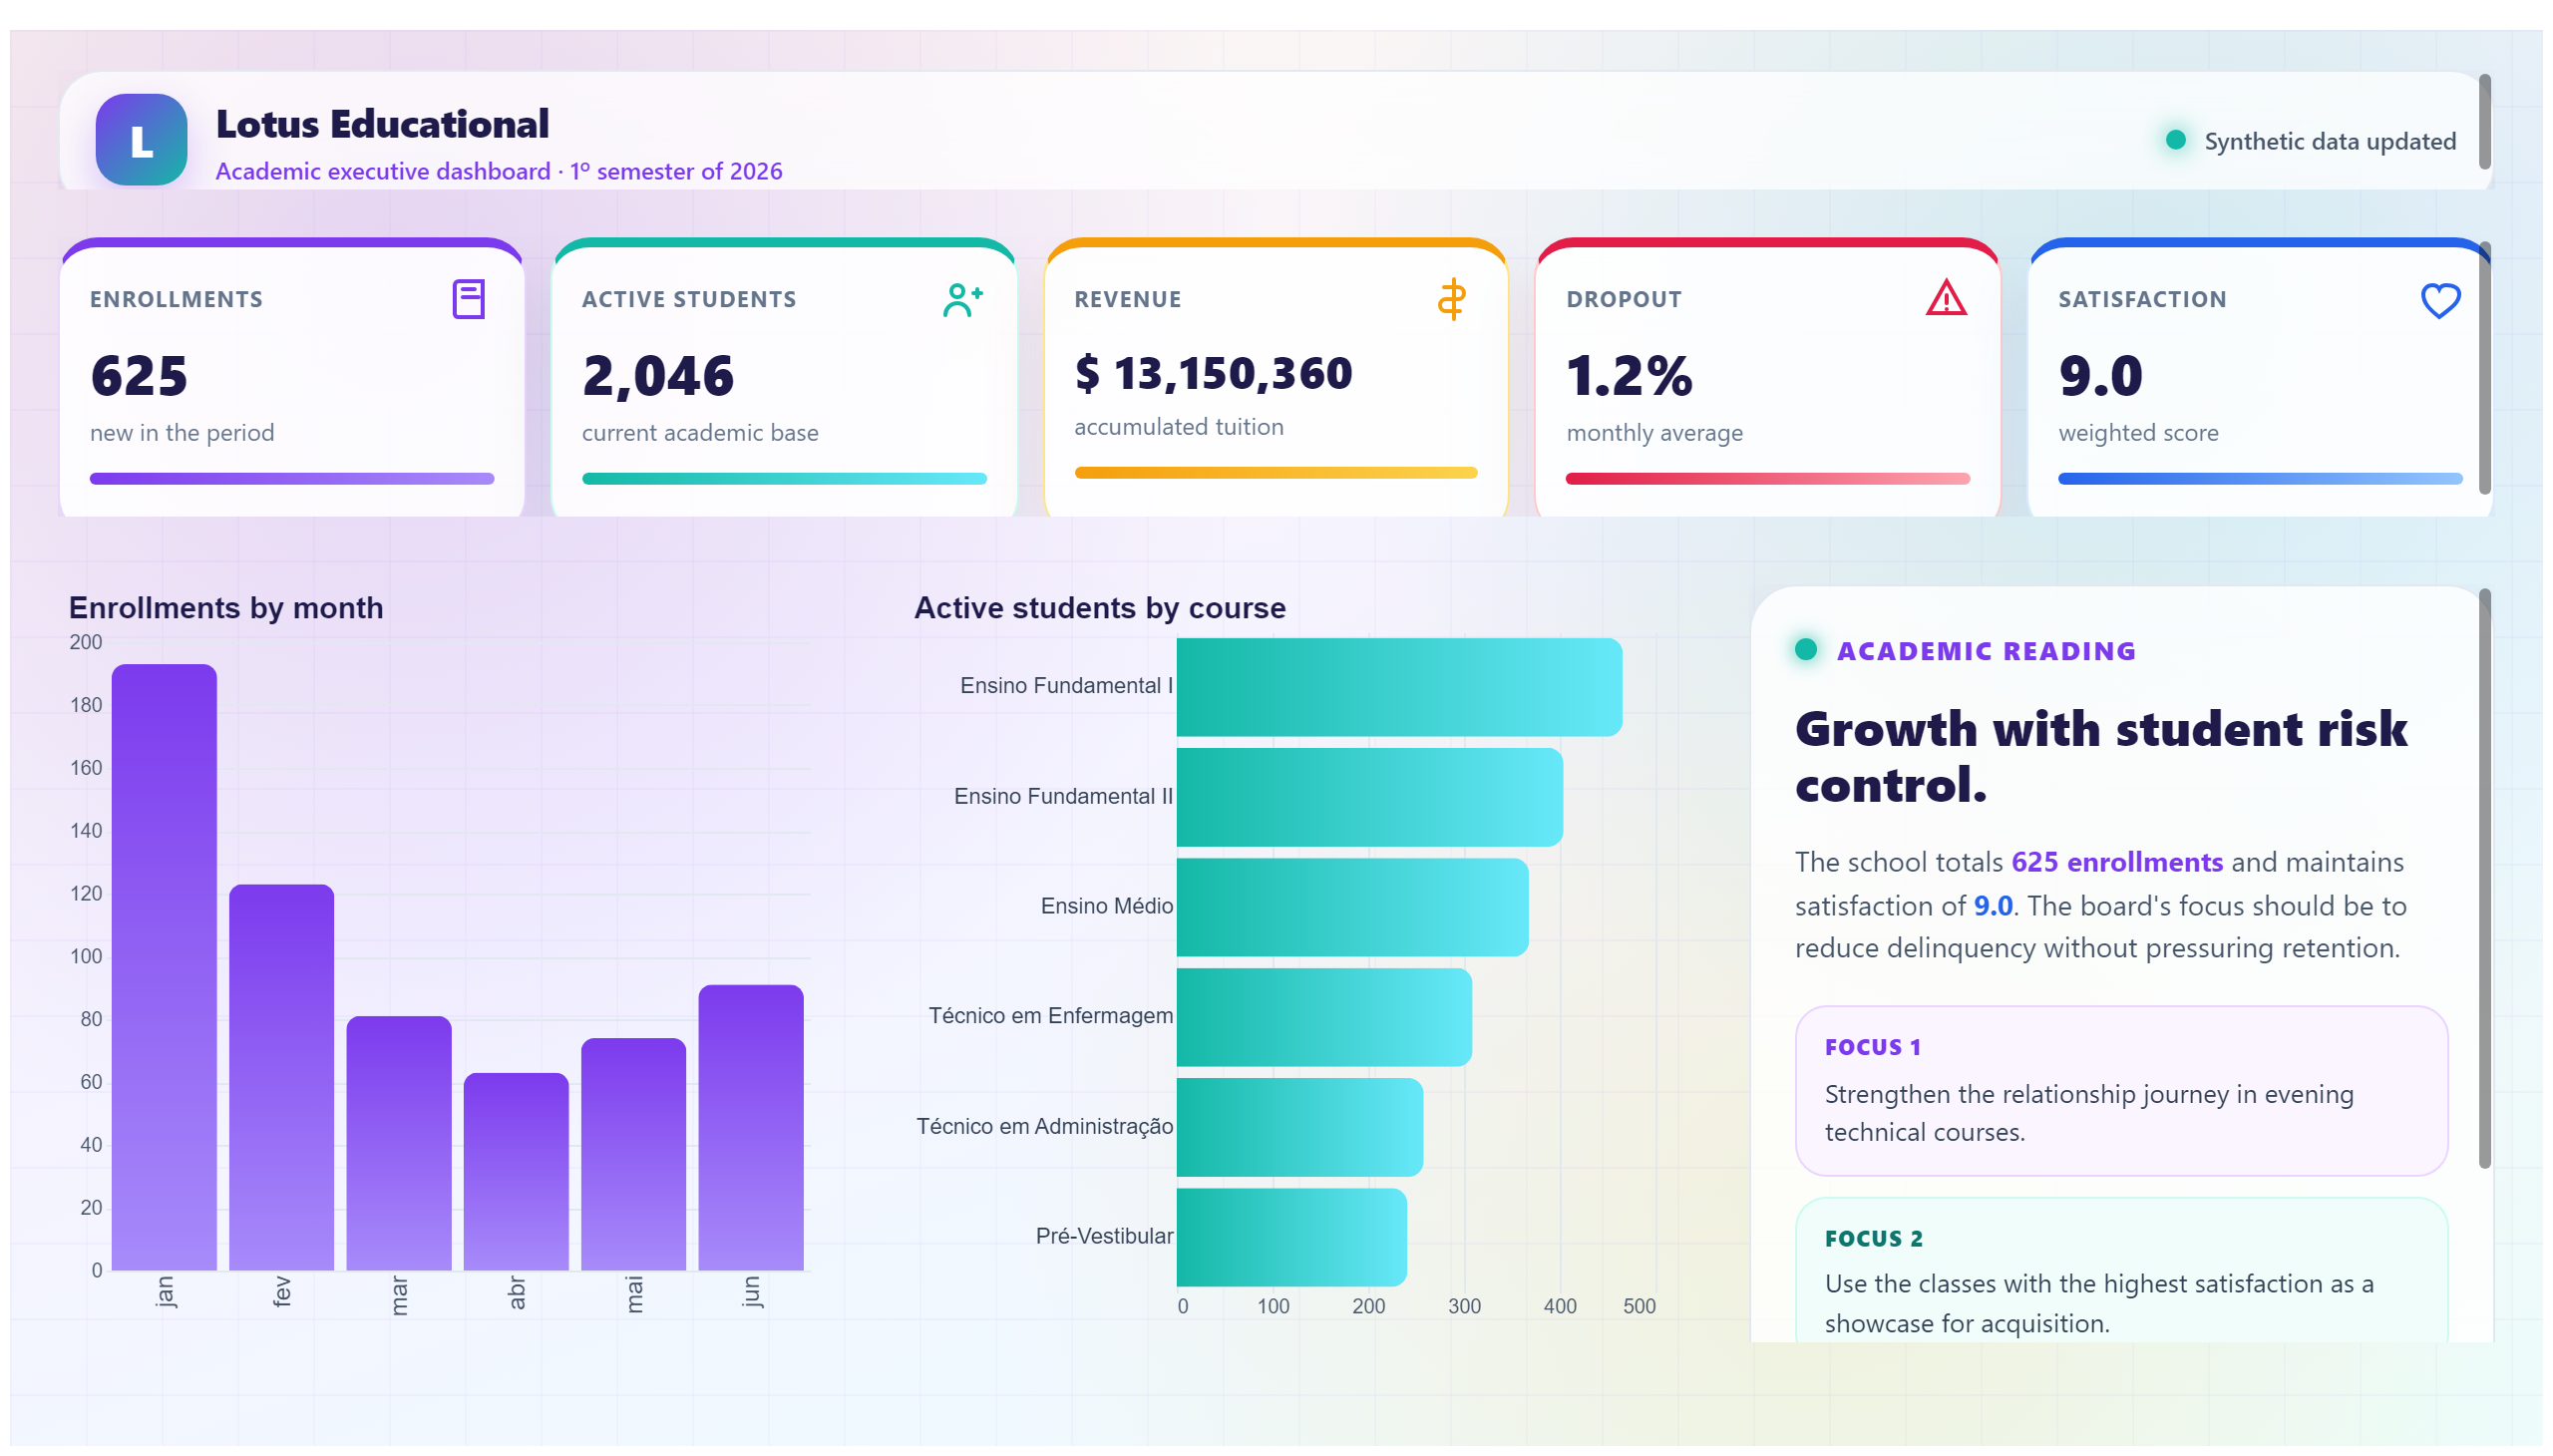
This report presents information about courses and their performance statistics.
Save your favorite dashboards, get new templates by area and ask the AI assistant — for free.
This is a free Power BI dashboard called BD CURSOS, in the Educação domain. Explore KPIs, interactive visualizations and get inspired for your own data and business intelligence projects.
This report presents information about courses and their performance statistics.
The BD CURSOS dashboard provides a comprehensive overview of courses and their performance metrics within the education domain. It consolidates key data points about various courses, enabling users to assess how each course is performing based on defined statistics. This report is designed to offer insights into course effectiveness, enrollment trends, and overall engagement.
By analyzing this dashboard, educational administrators and decision-makers can answer critical business questions such as: Which courses are attracting the most students? How do different courses compare in terms of completion rates or success metrics? Are there courses that require improvement or additional resources? The dashboard serves as a vital tool for monitoring course performance and making data-driven decisions to enhance educational offerings.
Overall, the BD CURSOS dashboard is ideal for education managers, course coordinators, and analysts who need to track and optimize course outcomes. Its clear presentation of performance statistics helps stakeholders identify strengths and weaknesses in their curriculum and supports strategic planning to improve student learning experiences.
The dashboard includes statistics related to course enrollment numbers, completion rates, and other key performance indicators that measure course effectiveness.
The primary audience consists of education managers, course coordinators, and analysts responsible for monitoring and improving course performance.
By providing insights into which courses perform well and which need attention, the dashboard supports data-driven decisions to allocate resources and enhance course quality.
We build a custom version for your business — US$ 50 per page, delivered within 7 calendar days.
Explore more Power BI dashboards from the same domain to compare KPIs, layouts and analytics models.
This report may show educational outcomes and literacy rates in different regions of the world.
Report on the topic of pets, possibly addressing related data or analyses.
Summative evaluation of a module, focusing on learning outcomes.
Tutorial on bins lists, possibly for learning data manipulation.
Complete projects built by the Excelverton factory: view them live and download the PBIP — 1 free downloads every 30 days with a free account, unlimited on Pro.
Save favorites, build collections and use the AI assistant — at no cost.