FrotasLogistica
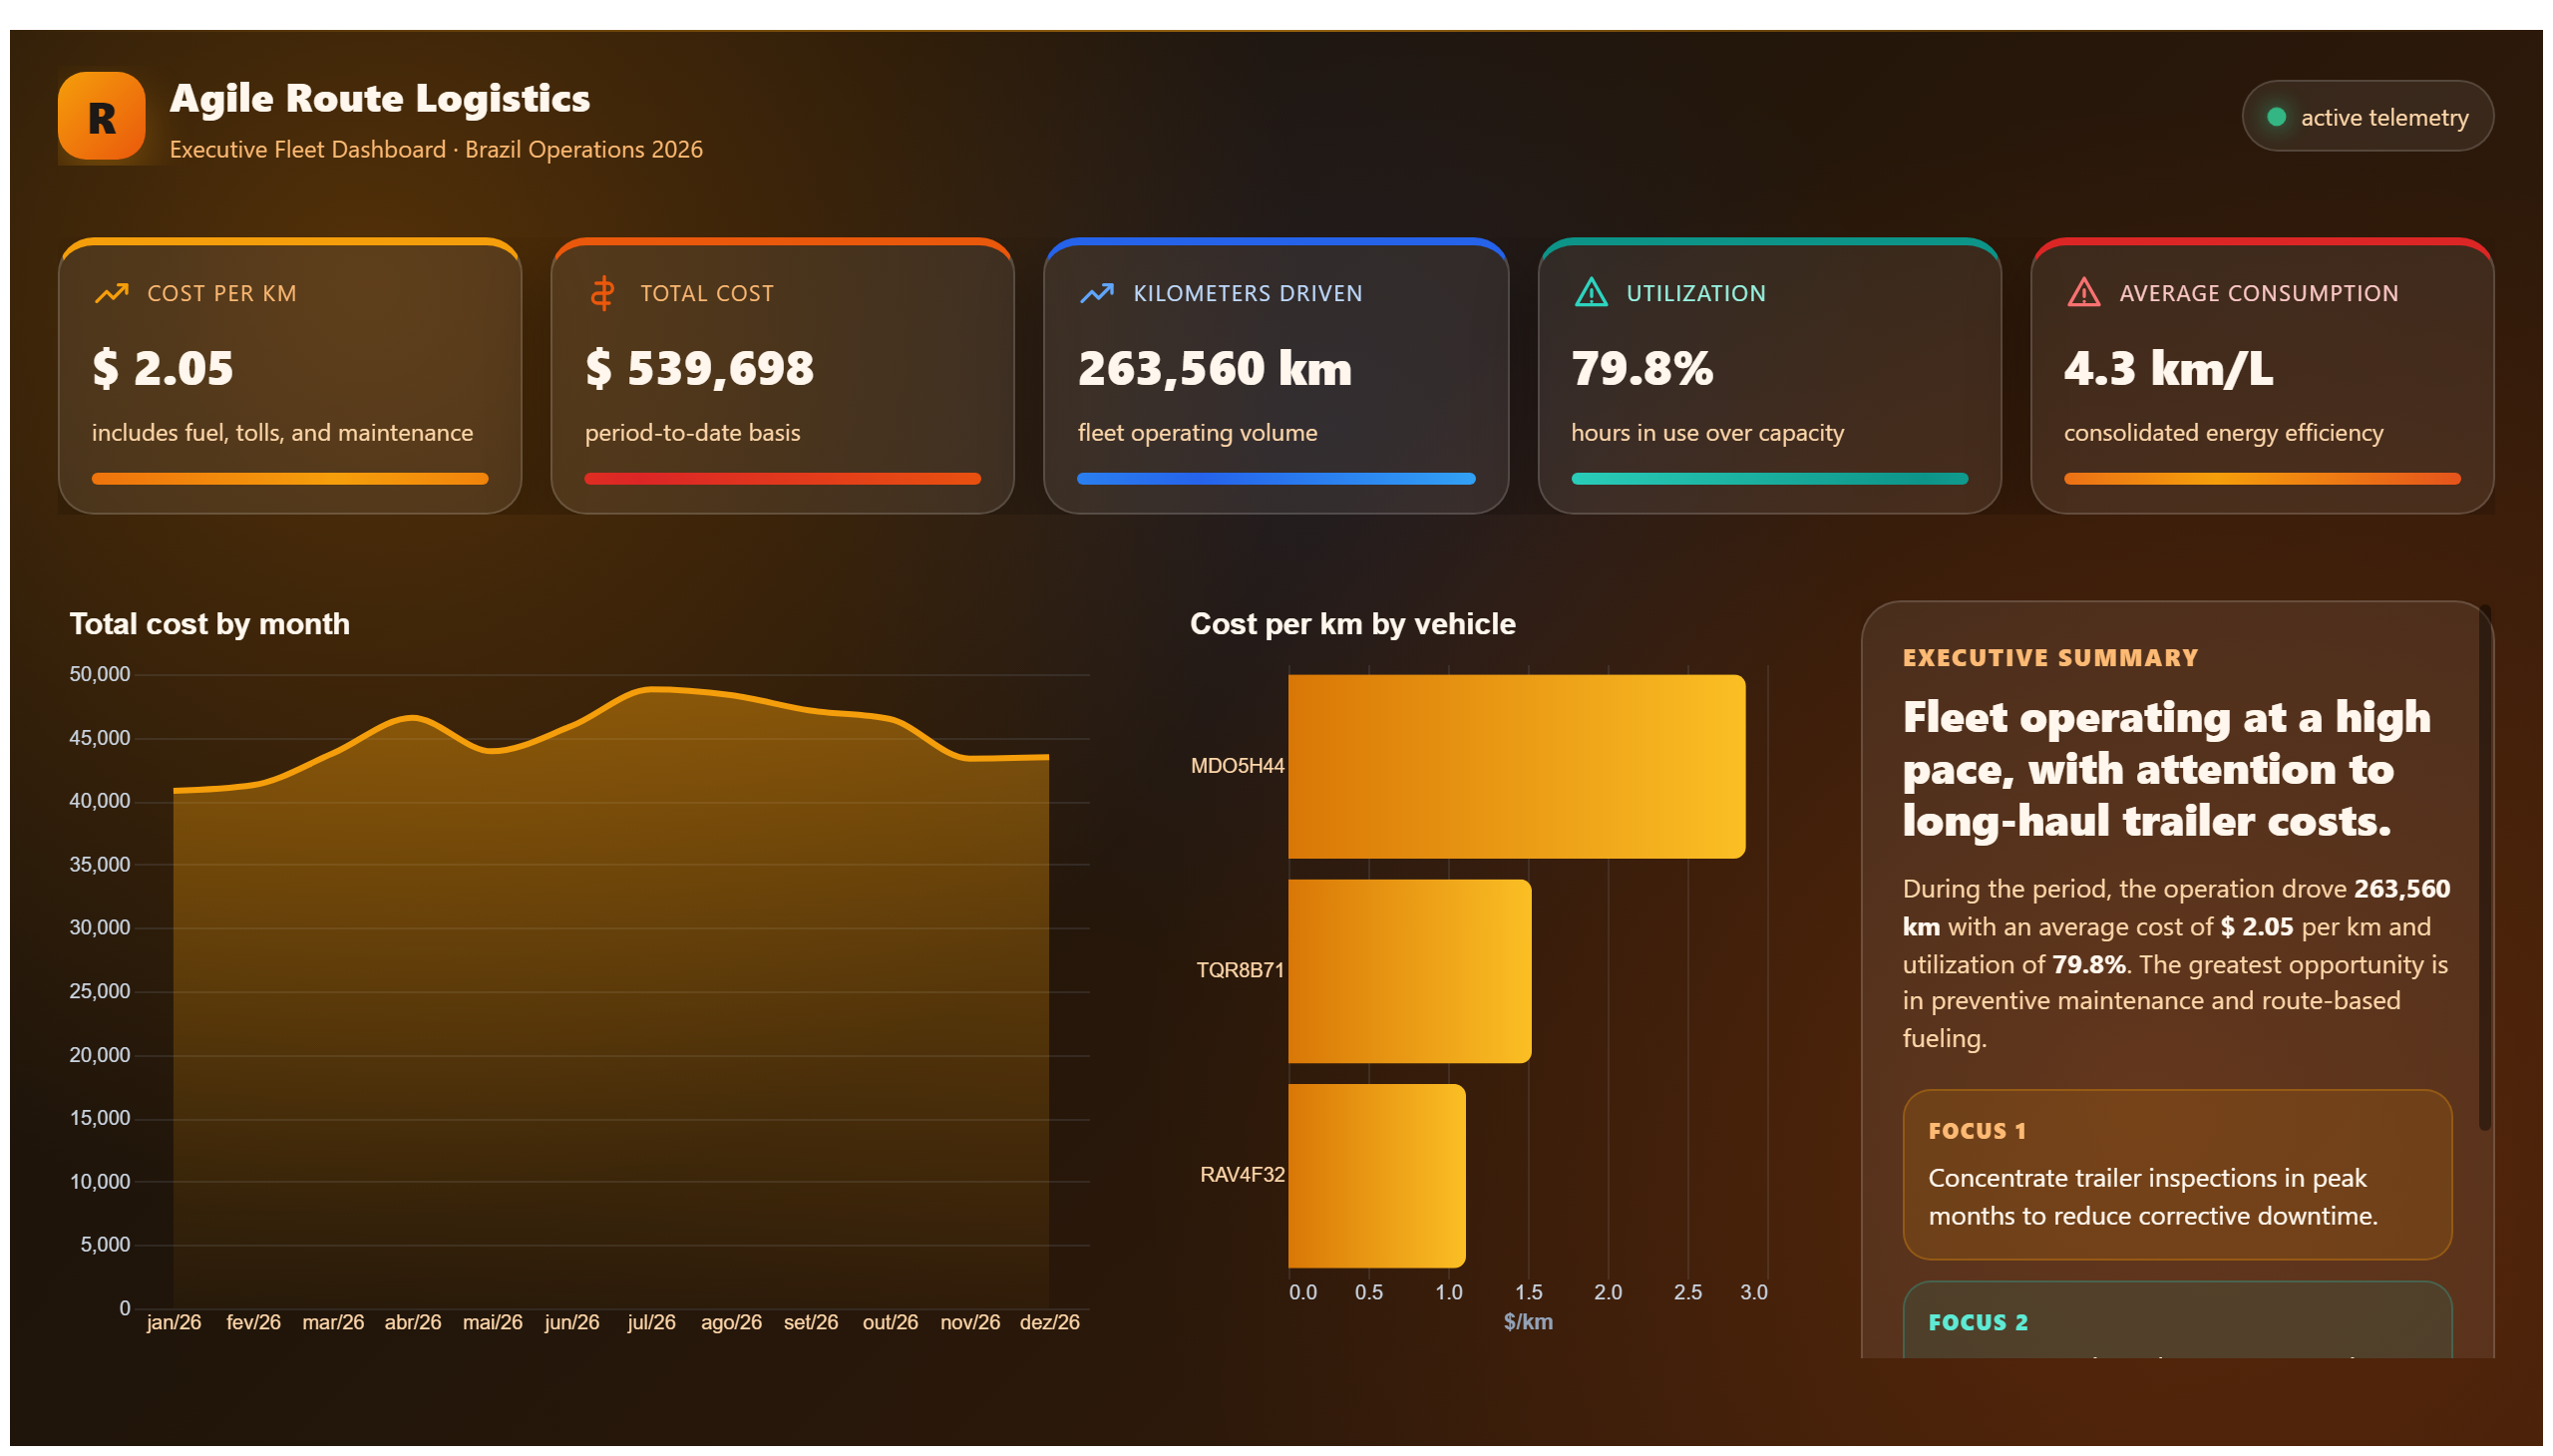
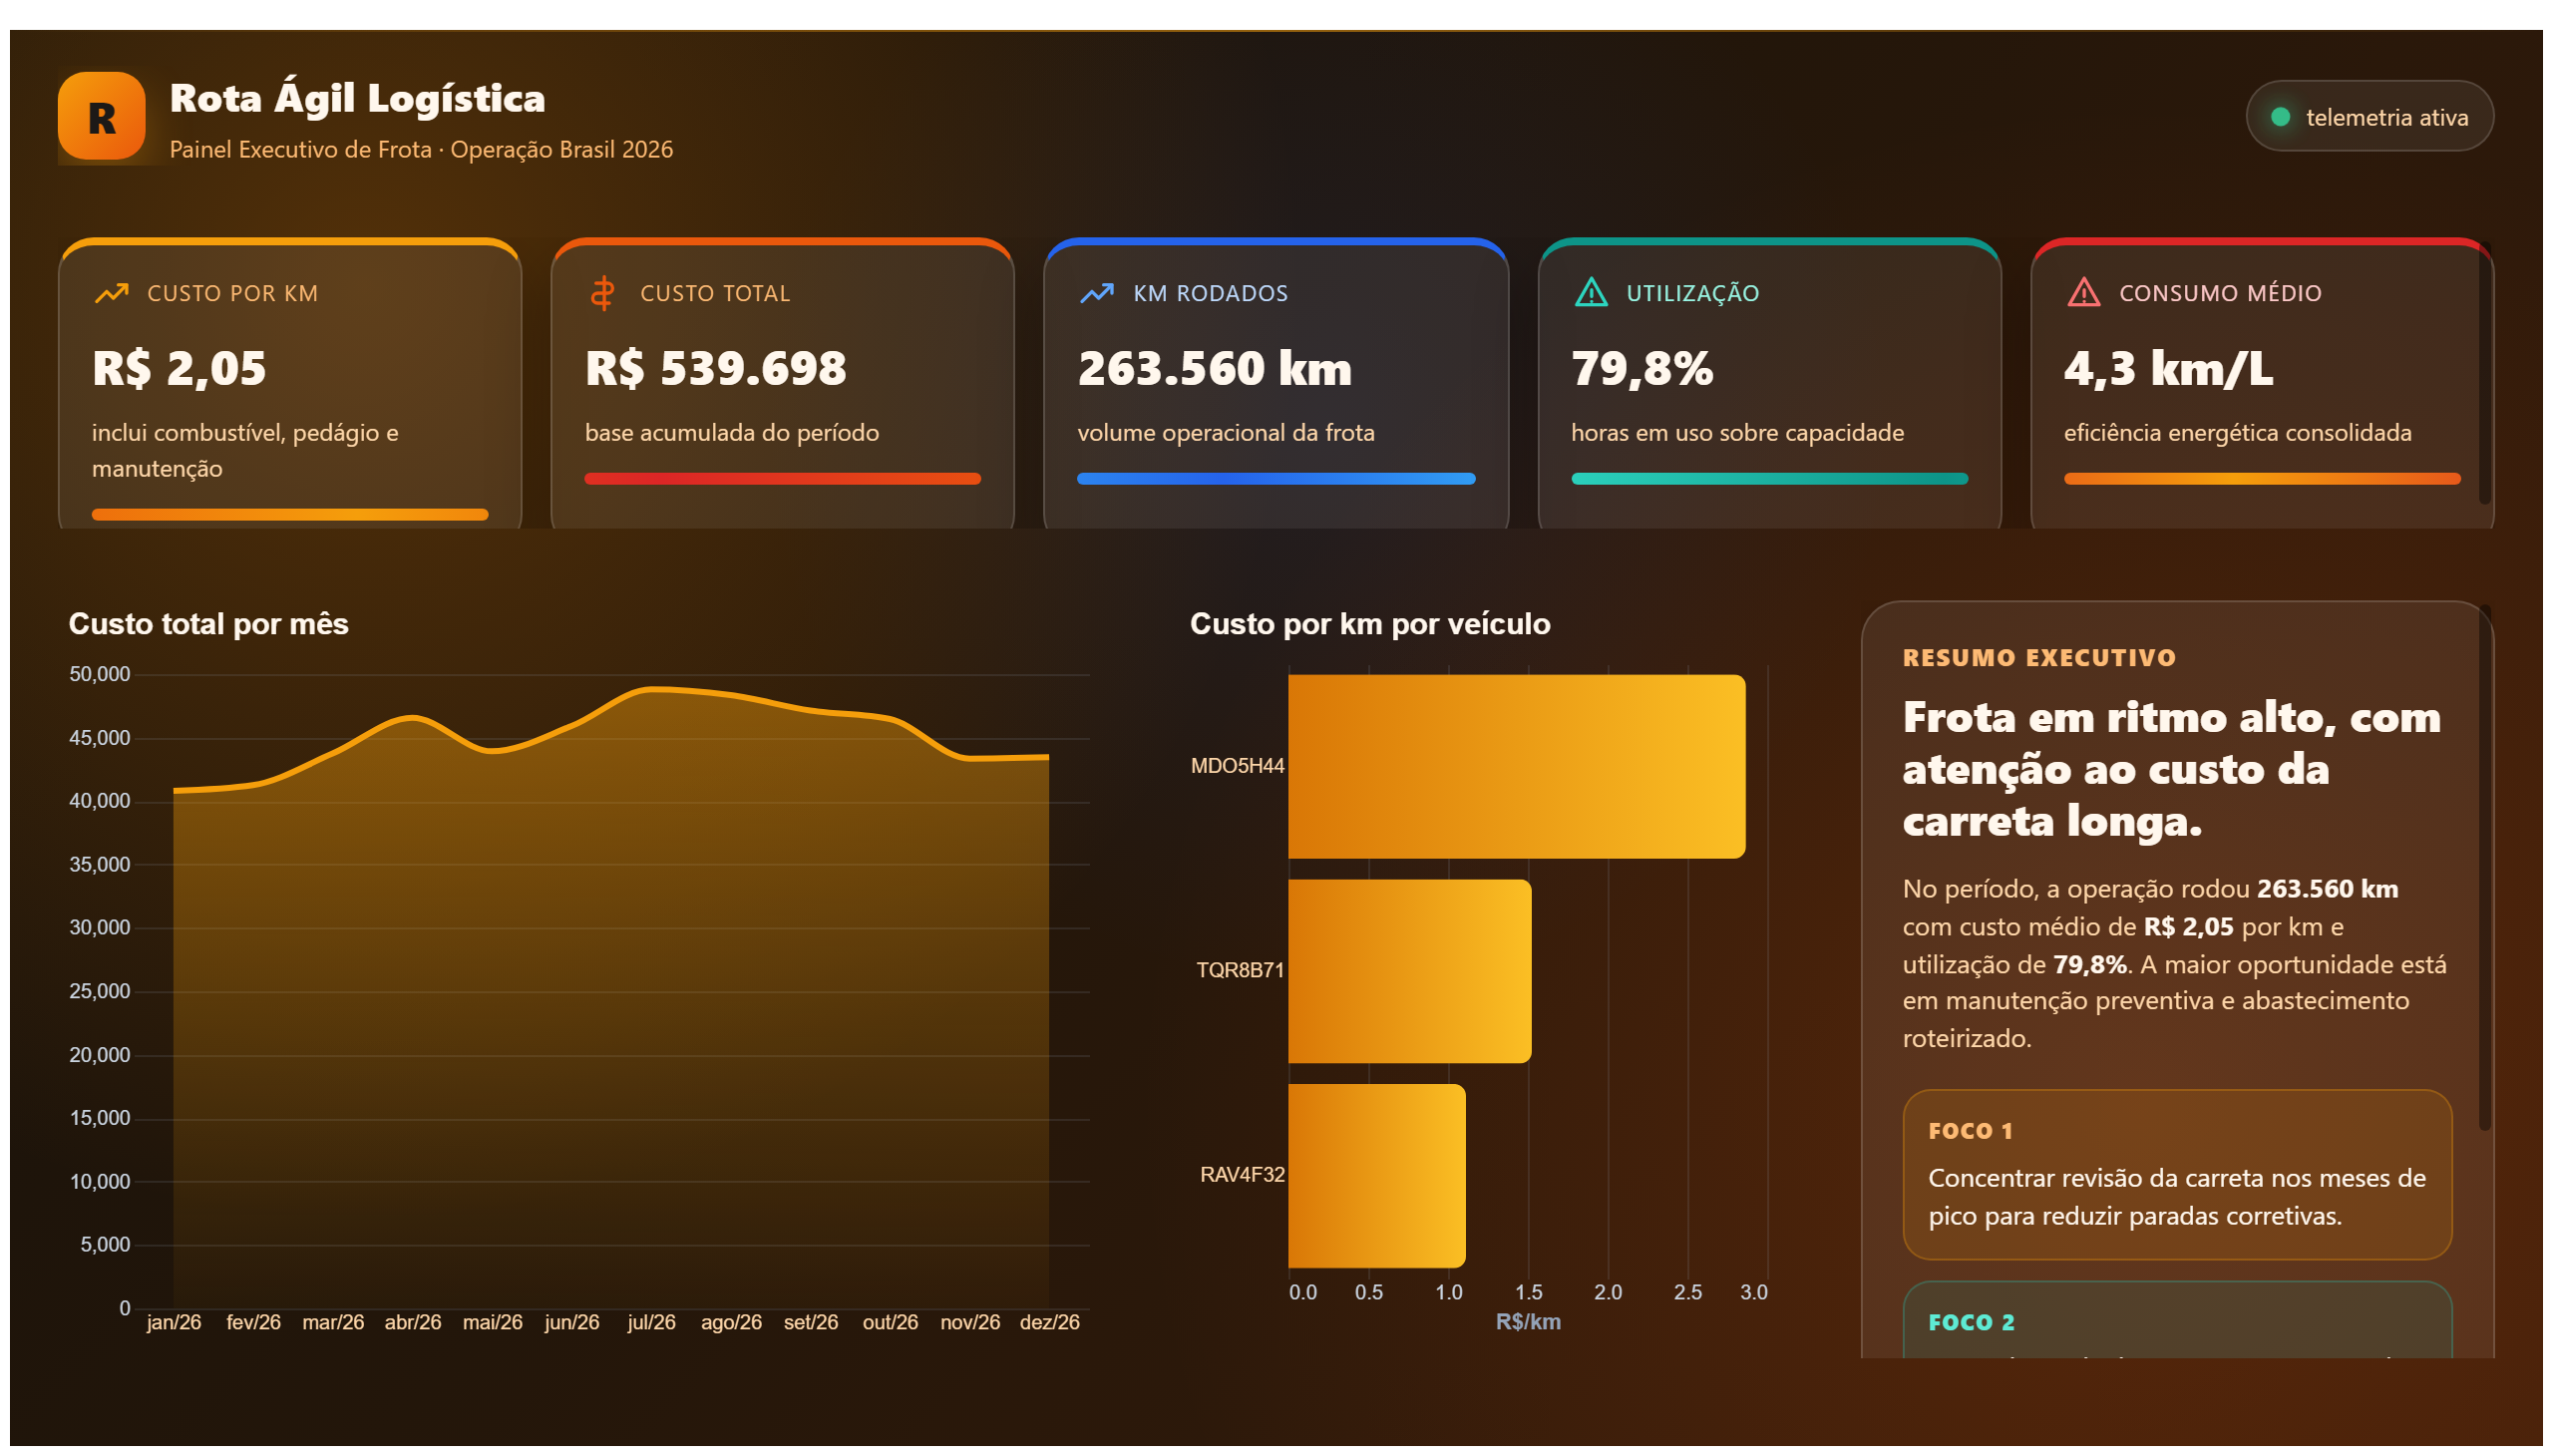
This report analyzes fleet logistics data, including efficiency and costs.
This report may provide data about inventory and its management.
Save your favorite dashboards, get new templates by area and ask the AI assistant — for free.
This is a free Power BI dashboard called CH5_R1a_Inventory, in the Logística domain. Explore KPIs, interactive visualizations and get inspired for your own data and business intelligence projects.
This report may provide data about inventory and its management.
The CH5_R1a_Inventory dashboard offers a comprehensive view of inventory levels and management within the supply chain domain. It provides key insights into stock quantities, turnover rates, and inventory distribution across various locations or product categories. This enables supply chain managers and operational teams to monitor inventory status in real time, ensuring optimal stock levels and reducing the risk of overstocking or stockouts.
By visualizing inventory data, the dashboard helps answer critical business questions such as: Which products have excess inventory? Where are potential bottlenecks in stock replenishment? How efficiently is inventory being utilized across different warehouses? This information supports decision-making related to procurement, demand forecasting, and warehouse management, ultimately improving operational efficiency and cost control.
The dashboard is ideal for supply chain analysts, inventory managers, and operational leaders who need to maintain a balanced inventory and ensure smooth supply chain operations. Its actionable insights facilitate proactive inventory adjustments and strategic planning, contributing to enhanced service levels and customer satisfaction.
The dashboard displays data on stock quantities, inventory turnover rates, and distribution of inventory across different locations or product categories.
The primary users are supply chain analysts, inventory managers, and operational leaders responsible for monitoring and managing inventory levels.
By providing real-time insights into inventory status, it enables proactive management of stock levels, helping to avoid overstocking or stockouts and supporting efficient procurement and warehouse management.
We build a custom version for your business — US$ 50 per page, delivered within 7 calendar days.
Explore more Power BI dashboards from the same domain to compare KPIs, layouts and analytics models.
This report analyzes fleet logistics data, including efficiency and costs.
Report on fleet management in transportation and logistics, focusing on efficiency and costs.
Logistics report that may show product flow and inventory.
This report analyzes data related to a company's supply chain.
Complete projects built by the Excelverton factory: view them live and download the PBIP — 1 free downloads every 30 days with a free account, unlimited on Pro.
Save favorites, build collections and use the AI assistant — at no cost.