Gallery Deneb Grafico De barras
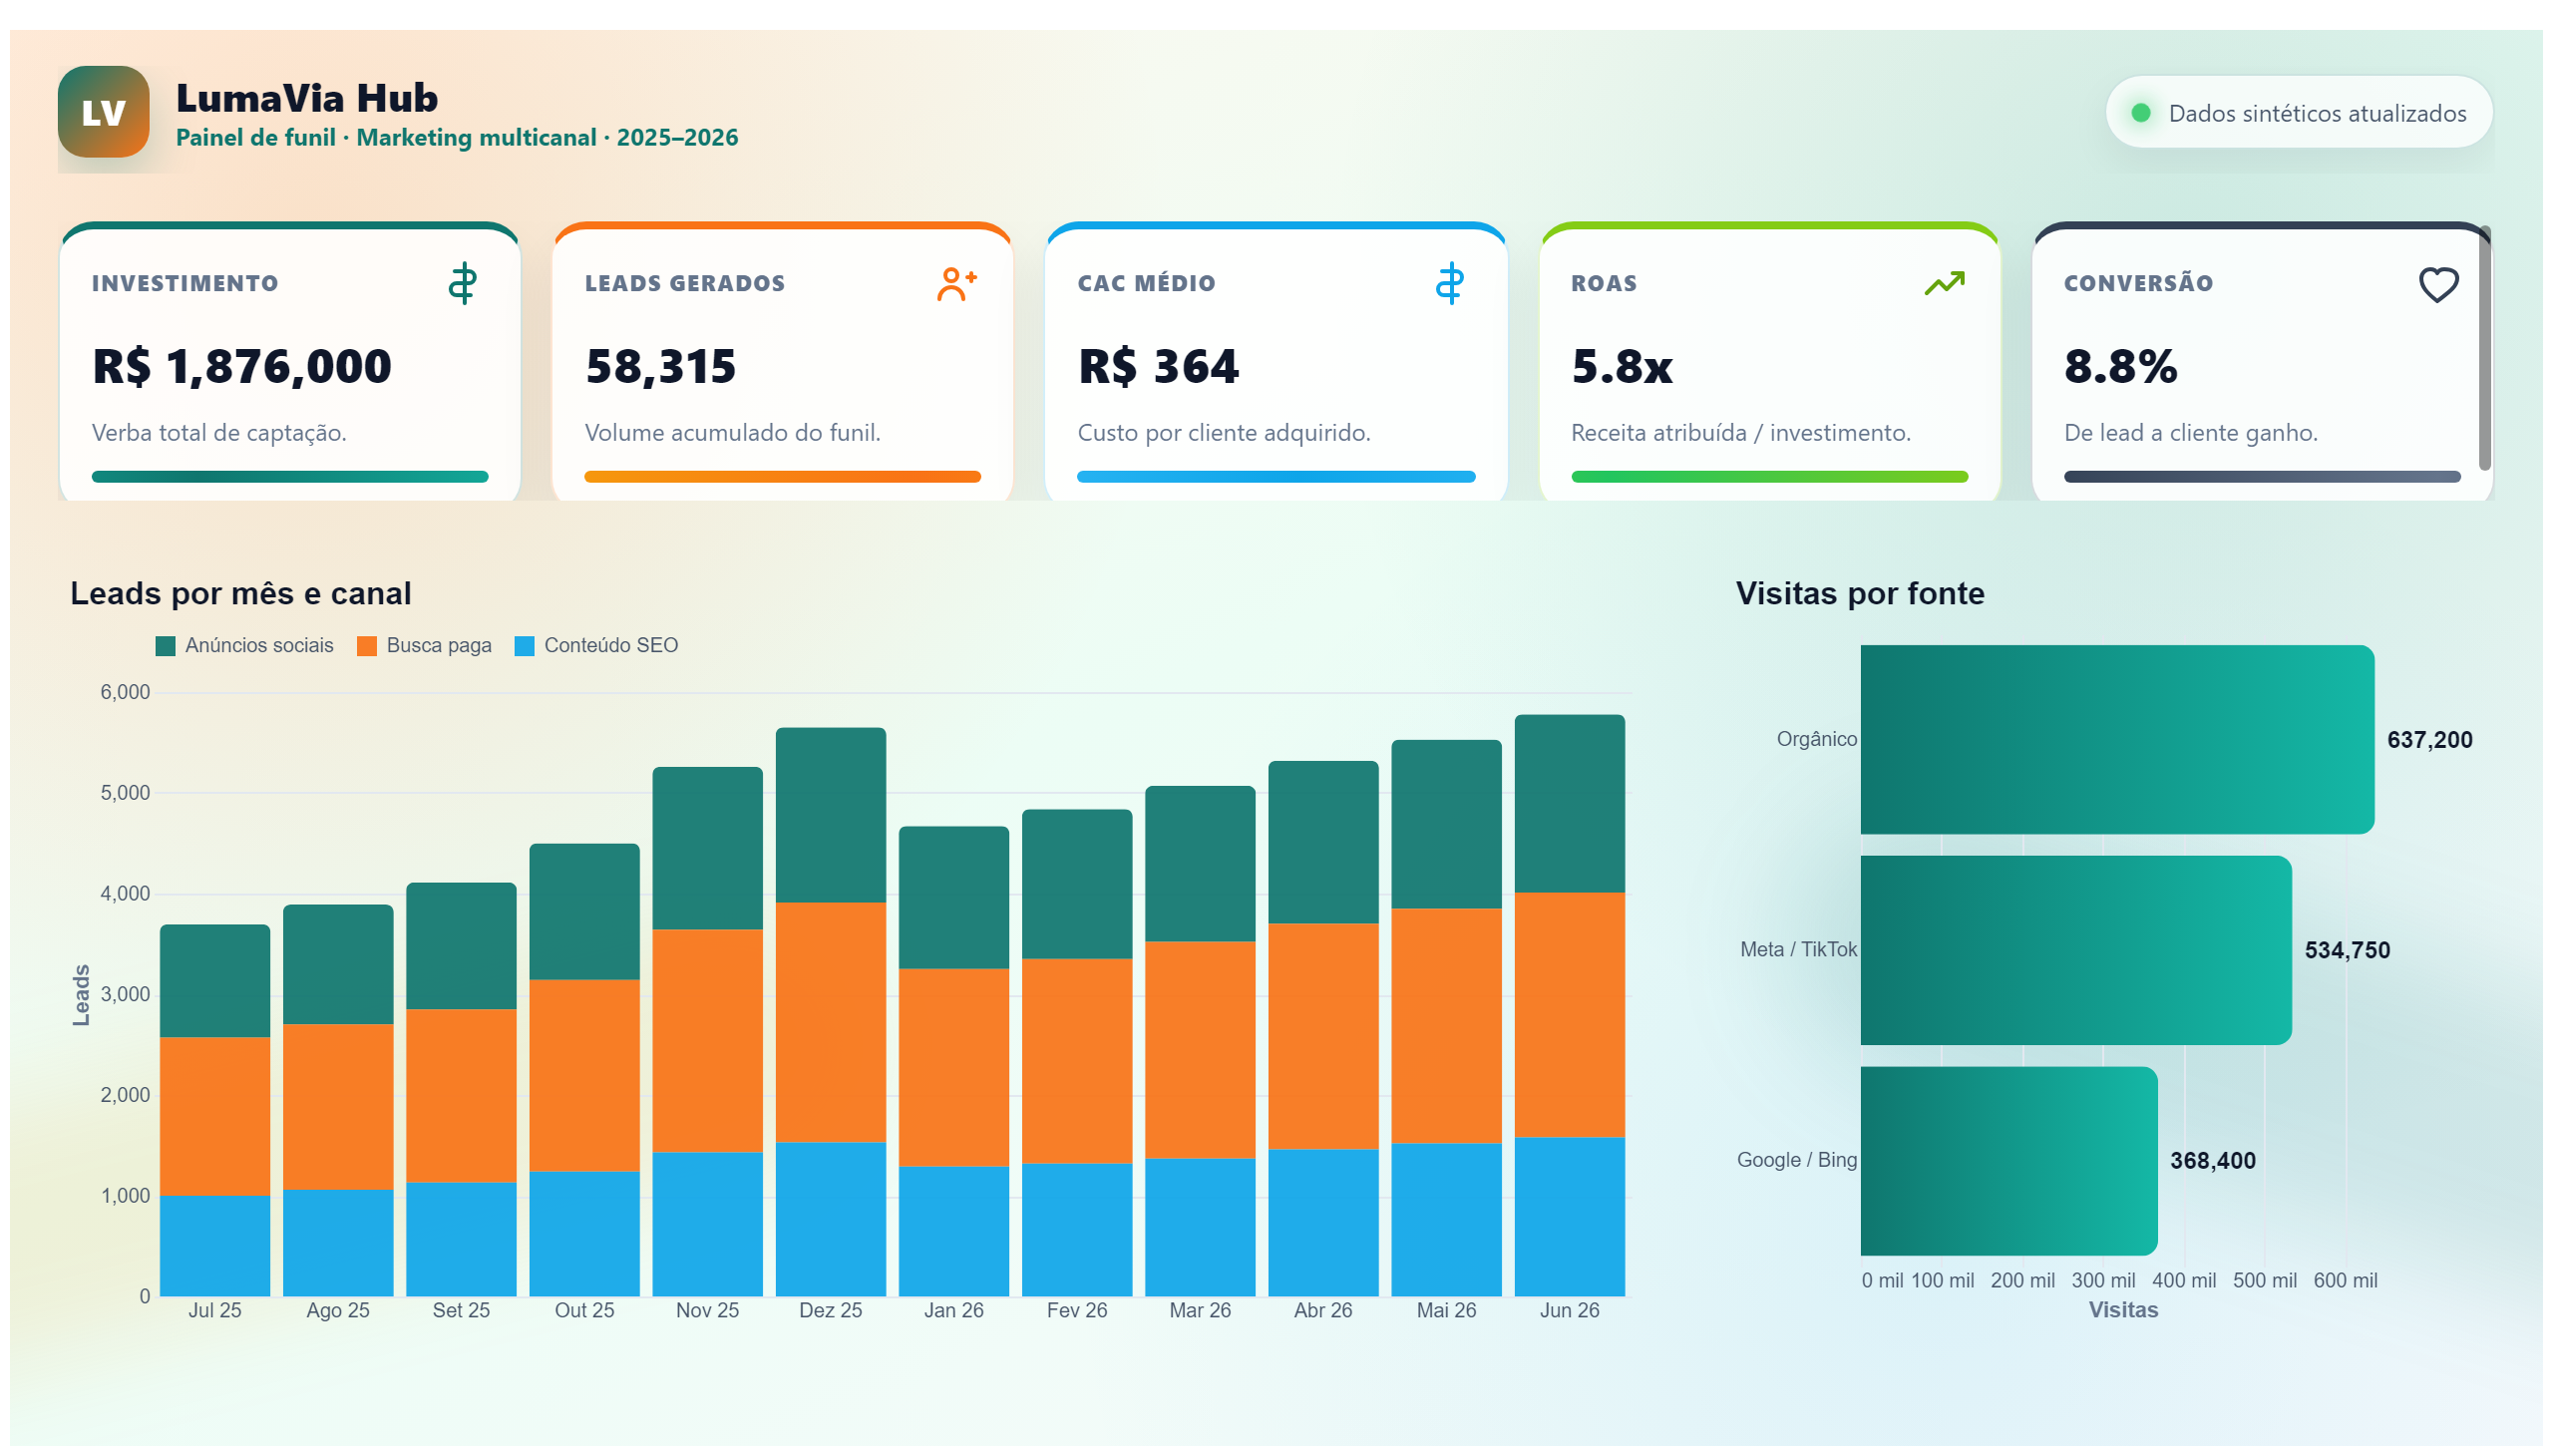
This report may show bar charts for analyzing marketing campaign performance.
Create a free account
Save your favorite dashboards, get new templates by area and ask the AI assistant — for free.
About the Gallery Deneb Grafico De barras dashboard
This is a free Power BI dashboard called Gallery Deneb Grafico De barras, in the Marketing domain. Explore KPIs, interactive visualizations and get inspired for your own data and business intelligence projects.
This report may show bar charts for analyzing marketing campaign performance.
Dashboard analysis
The Gallery Deneb Bar Chart dashboard offers a clear and concise visualization of marketing campaign performance through bar charts. It enables users to quickly compare different campaigns and assess their effectiveness based on key metrics. By presenting data in an intuitive graphical format, the dashboard supports decision-makers in identifying which campaigns are driving the best results.
This report answers critical business questions such as: Which marketing campaigns are performing the best? How do different campaigns compare in terms of key performance indicators? Where should marketing efforts be focused to maximize impact? It is particularly useful for marketing managers, analysts, and executives who need to monitor campaign success and optimize strategies accordingly.
Overall, the dashboard serves as a practical tool for marketing teams aiming to enhance their campaign analysis capabilities, enabling data-driven decisions that improve marketing outcomes.
Frequently asked questions about this dashboard
What type of visualizations does this dashboard primarily use?
This dashboard primarily uses bar charts to display the performance metrics of marketing campaigns.
Who is the intended audience for this dashboard?
The dashboard is designed for marketing professionals such as managers, analysts, and executives who need to evaluate and optimize campaign performance.
What business questions can this dashboard help answer?
It helps answer questions about which campaigns are performing best, how campaigns compare against each other, and where to focus marketing efforts for better results.
Want a dashboard like this with your data?
We build a custom version for your business — US$ 50 per page, delivered within 7 calendar days.
Marketing Power BI templates
Complete projects built by the Excelverton factory: view them live with a free account and download the PBIP as a channel subscriber (1/month) or Pro subscriber (unlimited).

Create your free account
Save favorites, build collections and use the AI assistant — at no cost.