Sustainable Supply Chain Performance Dashboard using Power BI Creating a Seperate tables - (Project Week 1)
This dashboard analyzes sustainable supply chain performance, using Power BI for visualizations.
Create a free account
Save your favorite dashboards, get new templates by area and ask the AI assistant — for free.
About the Sustainable Supply Chain Performance Dashboard using Power BI Creating a Seperate tables - (Project Week 1) dashboard
This is a free Power BI dashboard called Sustainable Supply Chain Performance Dashboard using Power BI Creating a Seperate tables - (Project Week 1), in the Logística domain. Explore KPIs, interactive visualizations and get inspired for your own data and business intelligence projects.
This dashboard analyzes sustainable supply chain performance, using Power BI for visualizations.
Dashboard analysis
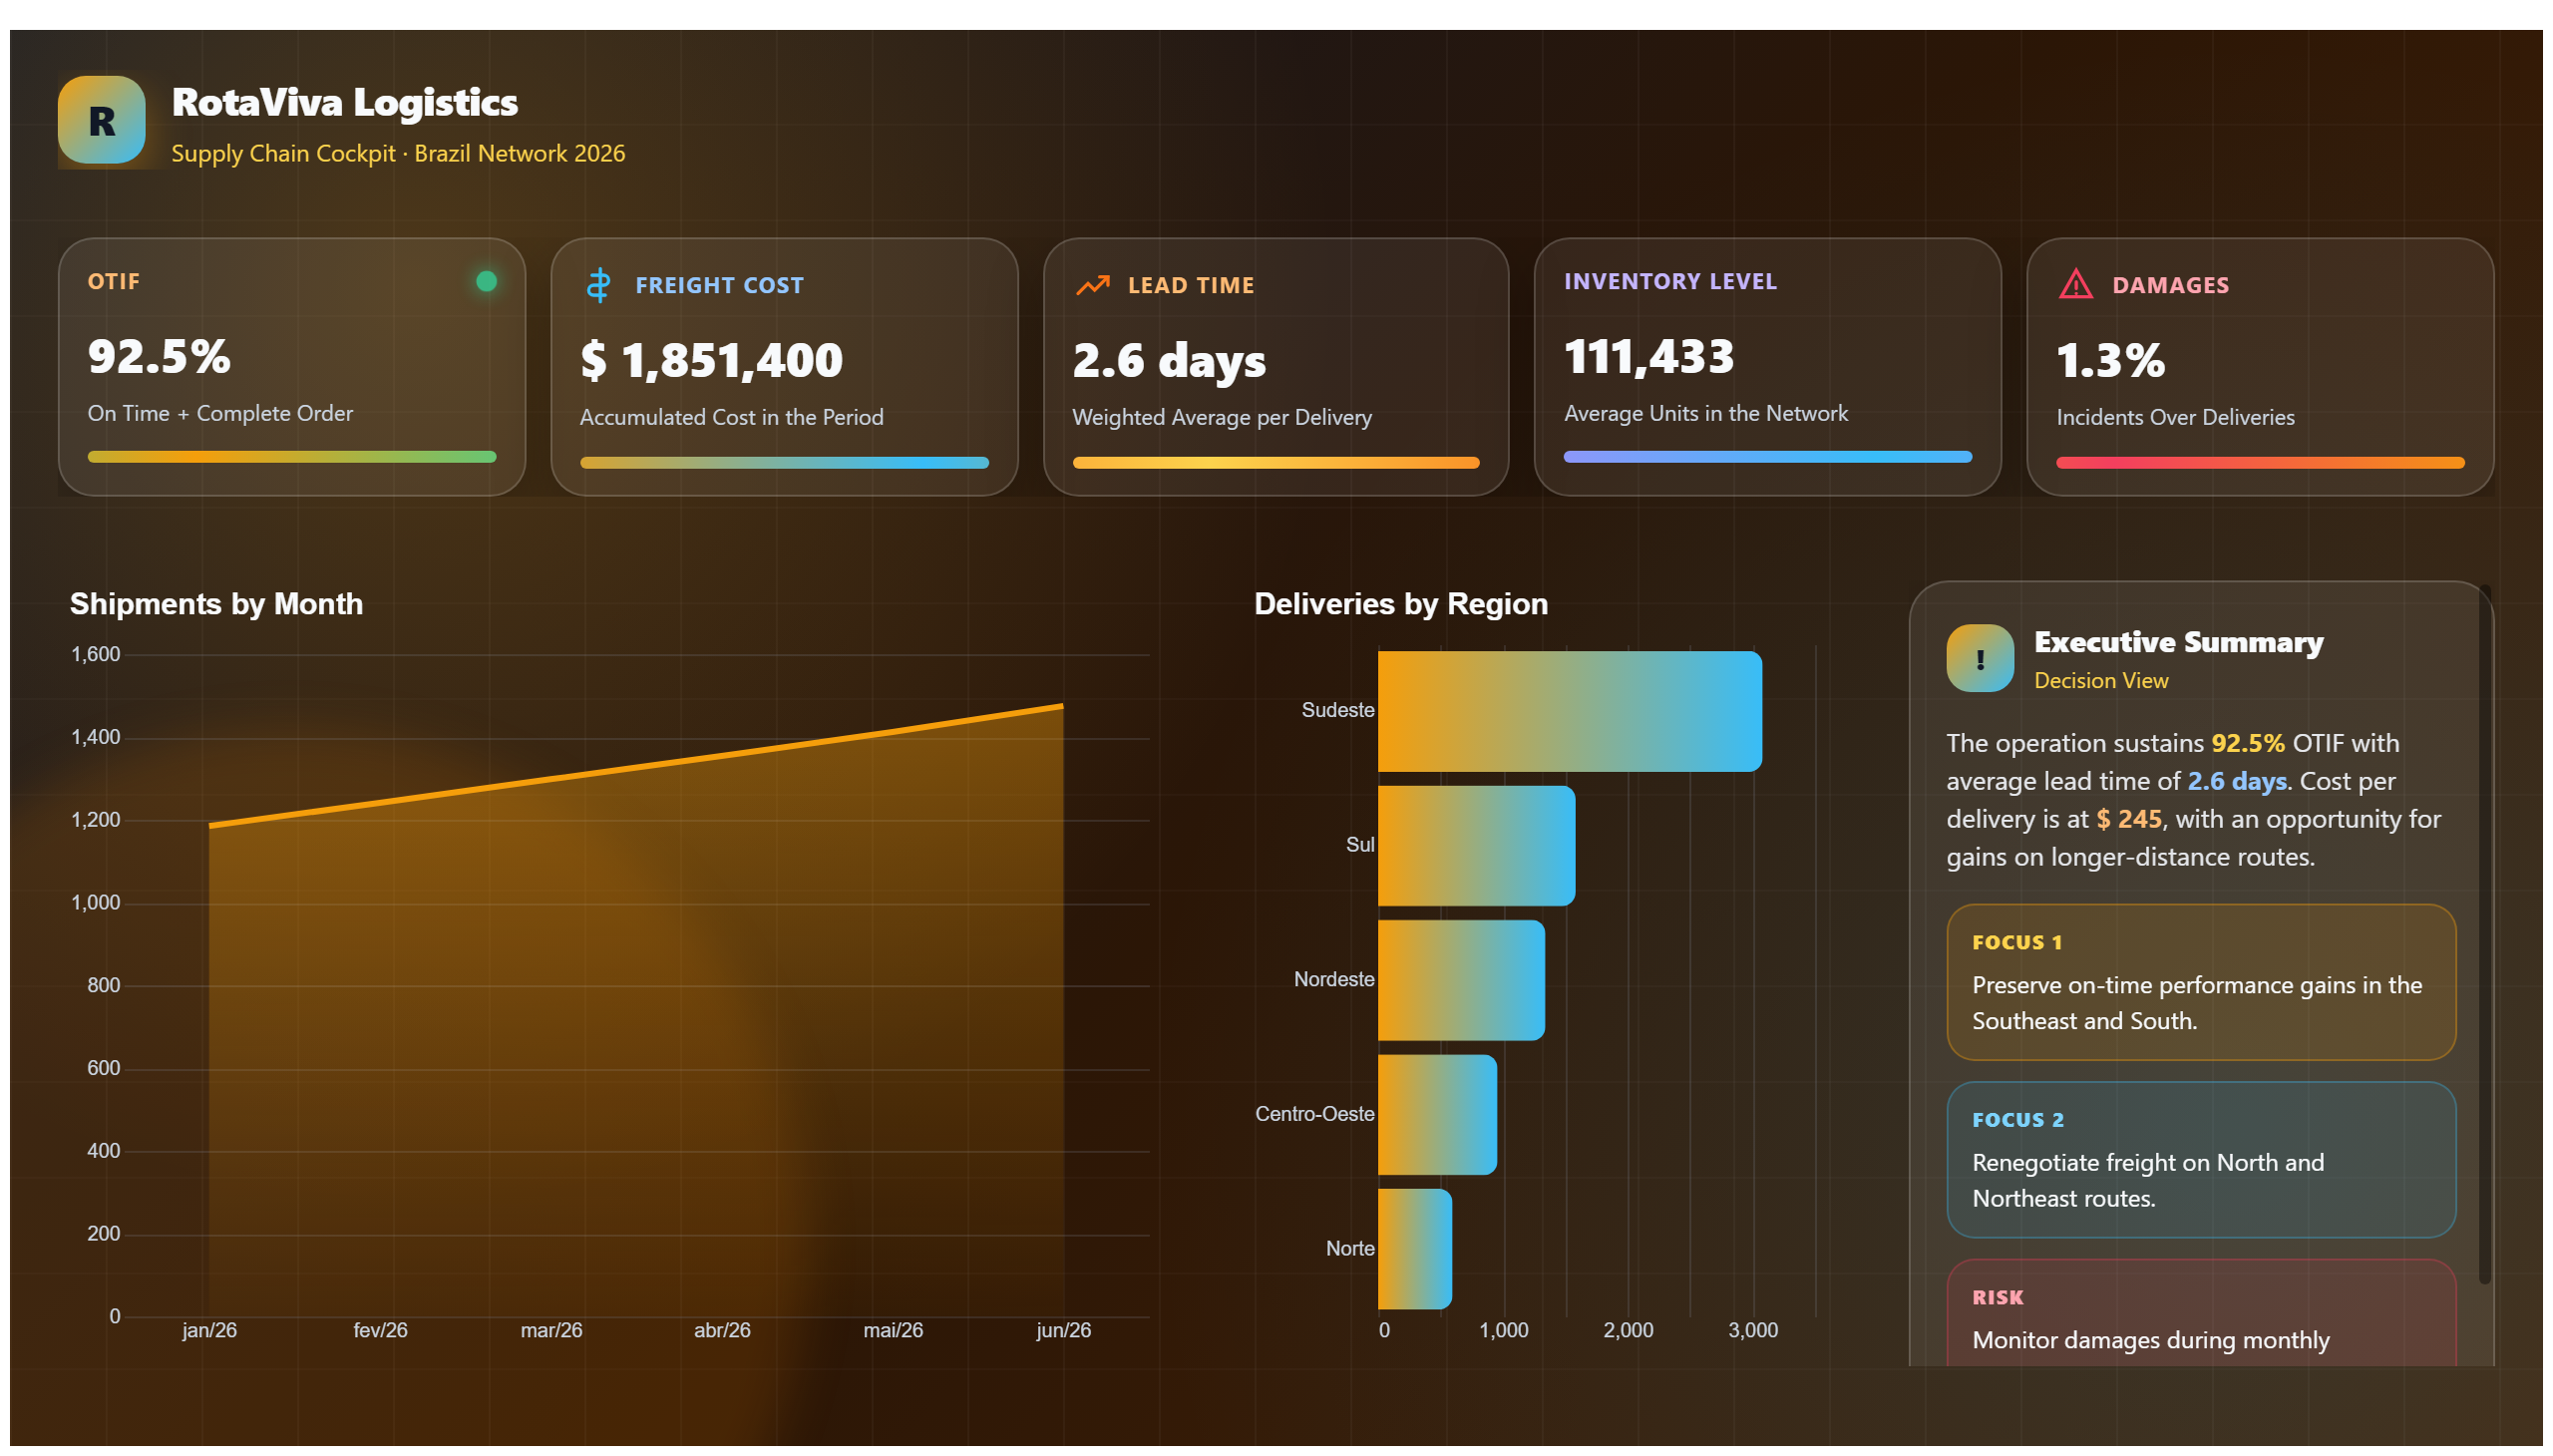
This dashboard provides a comprehensive view of sustainable supply chain performance through detailed visualizations created in Power BI. It focuses on key metrics that assess the environmental and operational aspects of the supply chain, enabling users to monitor sustainability efforts effectively. By organizing data into separate tables, the dashboard offers clarity and ease of analysis, allowing stakeholders to identify trends and areas for improvement.
The dashboard answers critical business questions such as: How is the supply chain performing in terms of sustainability? Which segments or processes contribute most to environmental impact? Where can efficiencies be gained to reduce waste and emissions? These insights support decision-making aimed at enhancing supply chain sustainability while maintaining operational performance.
Designed for supply chain managers, sustainability officers, and business analysts, this tool facilitates data-driven strategies to optimize supply chain operations with an emphasis on sustainability goals. It empowers users to track progress, benchmark performance, and communicate results effectively within their organizations.
Frequently asked questions about this dashboard
What specific sustainability metrics does the dashboard track?
The dashboard tracks key sustainability metrics related to supply chain performance, including environmental impact indicators and operational efficiency measures.
How does the dashboard organize data for analysis?
It uses separate tables to structure the data, improving clarity and enabling focused analysis of different aspects of the supply chain.
Who is the primary audience for this dashboard?
The primary users are supply chain managers, sustainability officers, and business analysts who need to monitor and improve sustainable supply chain practices.
Want a dashboard like this with your data?
We build a custom version for your business — US$ 50 per page, delivered within 7 calendar days.
Logistics Power BI templates
Complete projects built by the Excelverton factory: view them live with a free account and download the PBIP as a channel subscriber (1/month) or Pro subscriber (unlimited).
Create your free account
Save favorites, build collections and use the AI assistant — at no cost.