Beginning to like PowerPivot
Report on the use of PowerPivot.
Create a free account
Save your favorite dashboards, get new templates by area and ask the AI assistant — for free.
About the Beginning to like PowerPivot dashboard
This is a free Power BI dashboard called Beginning to like PowerPivot, in the Educação domain. Explore KPIs, interactive visualizations and get inspired for your own data and business intelligence projects.
Report on the use of PowerPivot.
Dashboard analysis
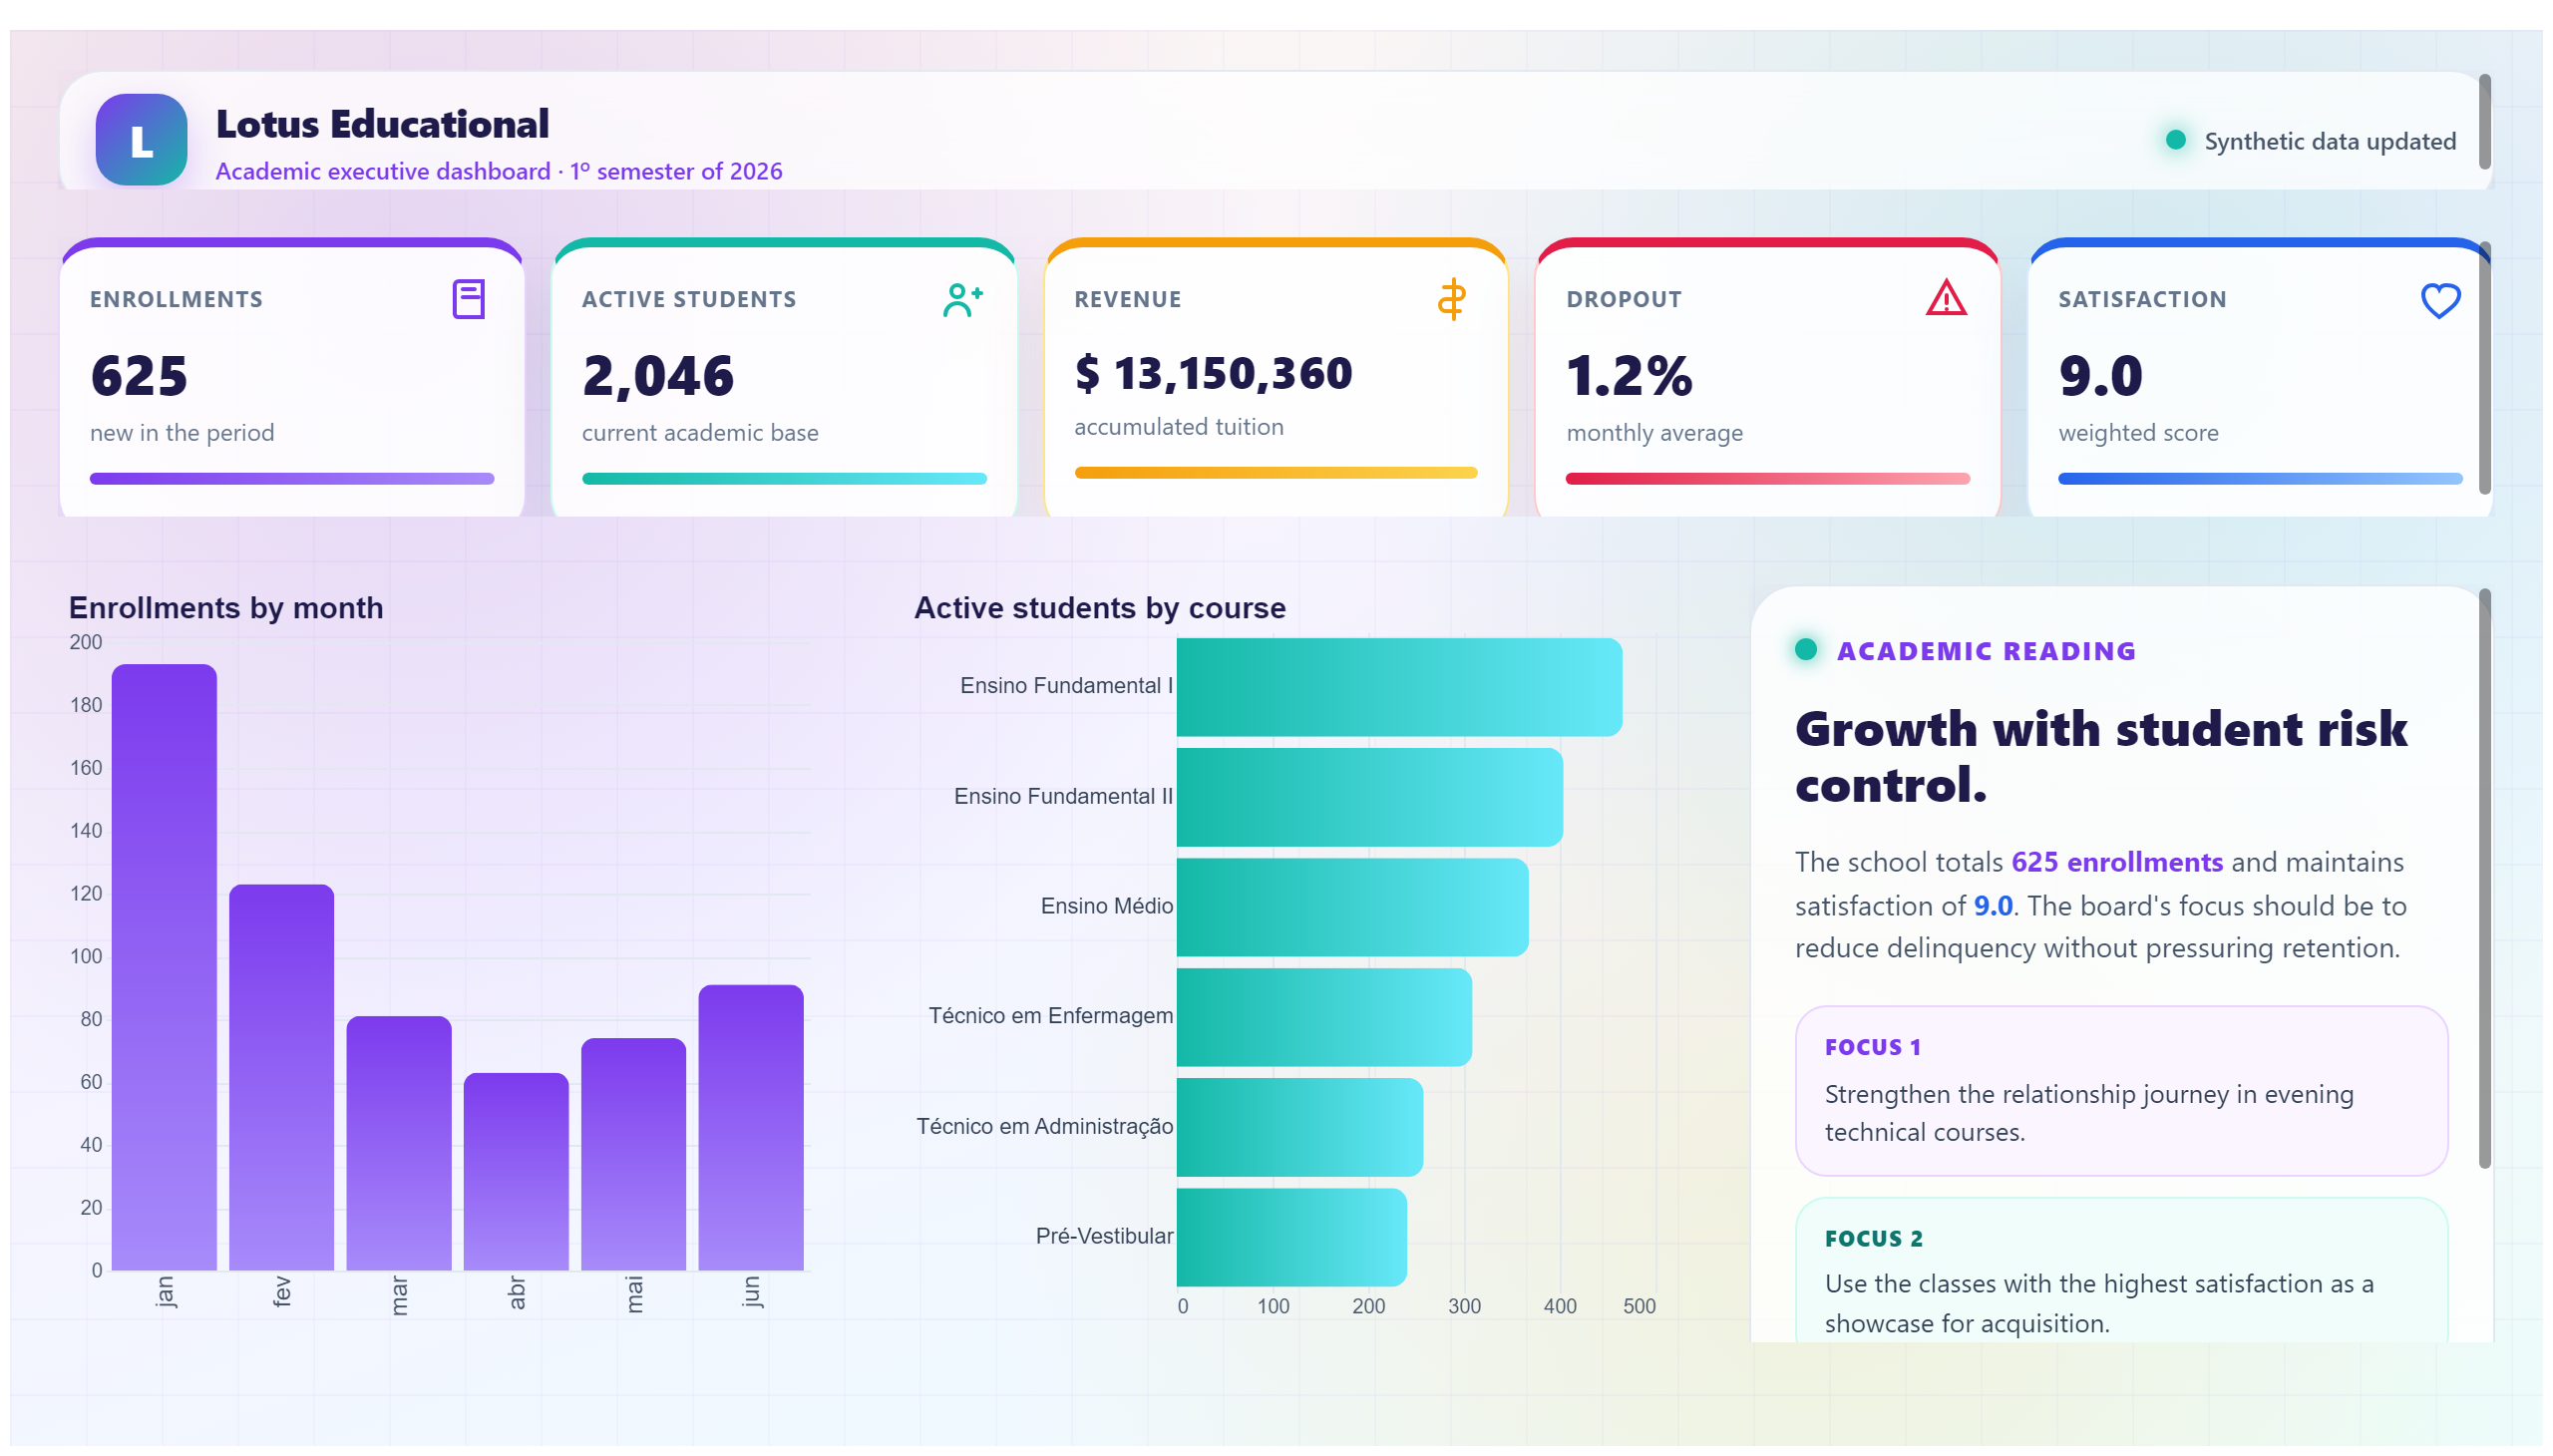
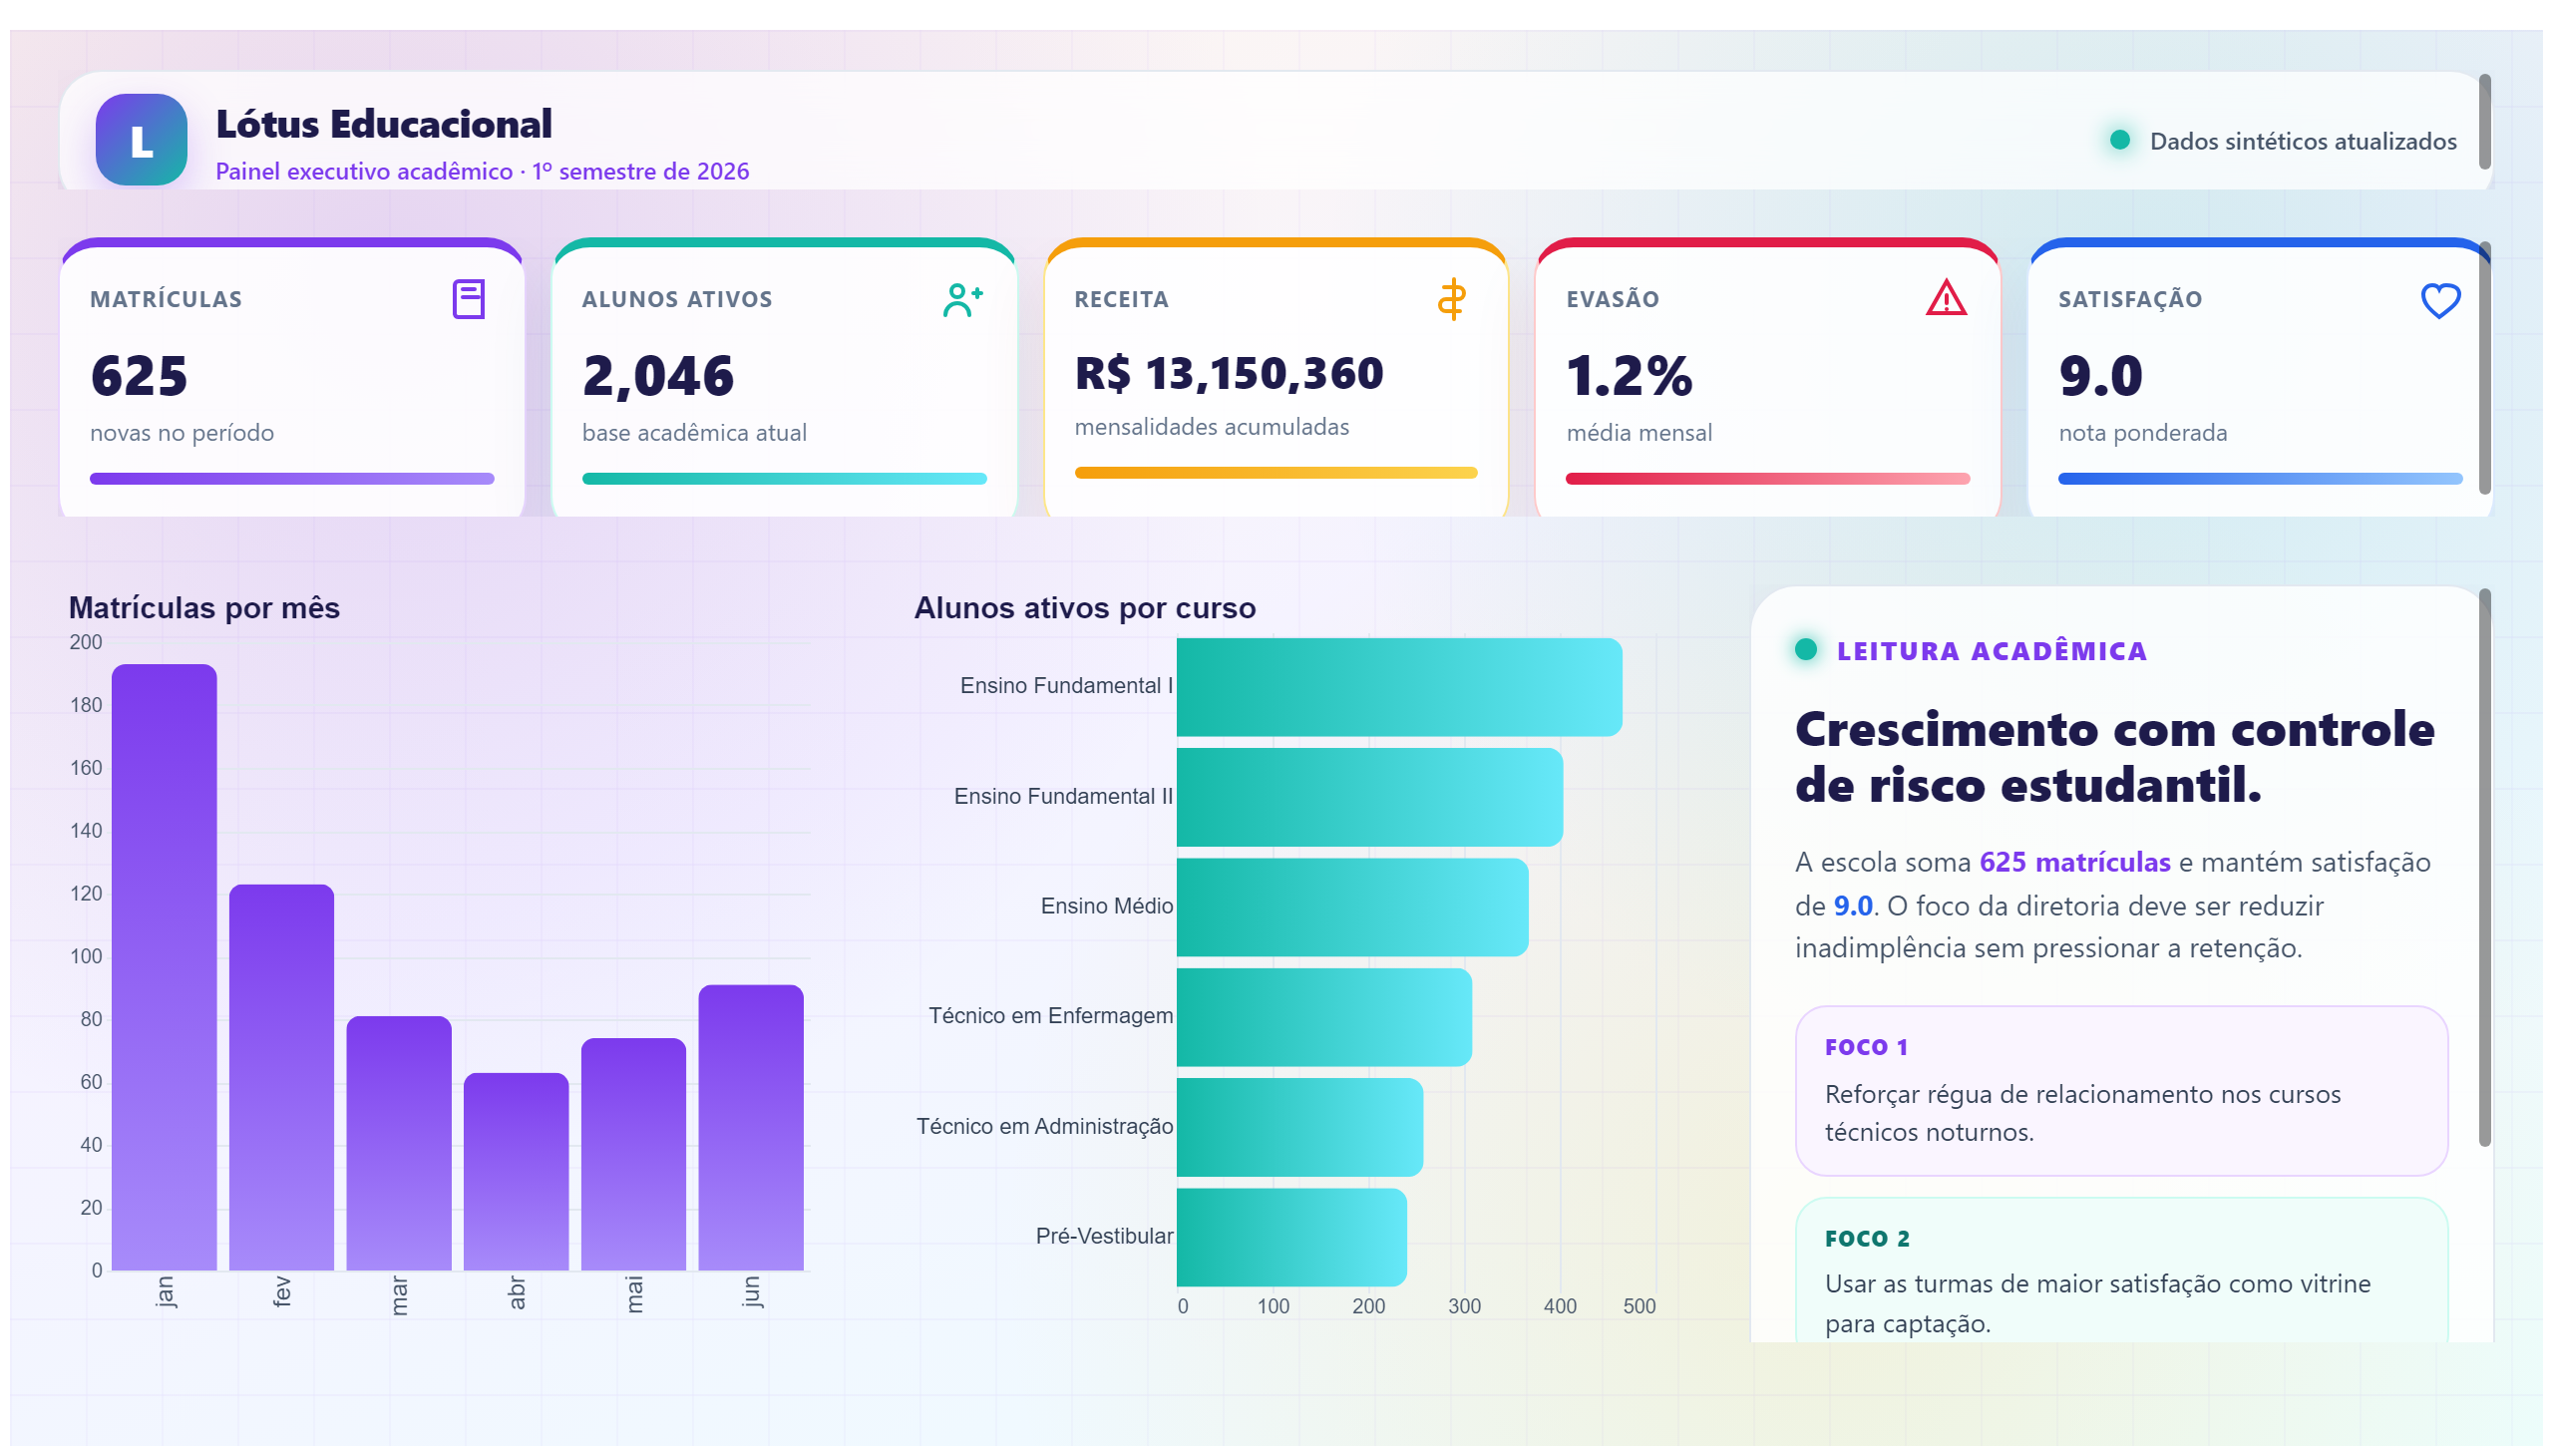
Beginning to like PowerPivot is a dashboard focused on the utilization of PowerPivot within an educational context. It provides insights into how PowerPivot is being adopted and used, highlighting trends and patterns that can help educators and administrators understand the effectiveness and reach of this tool. The report is designed to answer key questions about user engagement, usage frequency, and the impact of PowerPivot on data analysis tasks.
This dashboard serves as a valuable resource for education professionals who are interested in integrating PowerPivot into their data workflows. It helps identify which groups are actively using the tool, how often it is applied in educational settings, and potentially areas where additional training or support might be needed. By visualizing usage data, the report supports decision-making around resource allocation and professional development related to PowerPivot.
Frequently asked questions about this dashboard
What specific usage metrics does the dashboard provide about PowerPivot?
The dashboard shows data on how frequently PowerPivot is used and which user groups are engaging with it, helping to track adoption rates.
Who is the primary audience for this PowerPivot utilization report?
The report is intended for educators and administrators interested in monitoring and improving PowerPivot usage within their educational environment.
How can this dashboard help improve PowerPivot adoption?
By identifying usage patterns and areas with low engagement, the dashboard highlights where additional training or support may be needed to increase adoption.
Want a dashboard like this with your data?
We build a custom version for your business — US$ 50 per page, delivered within 7 calendar days.
Education Power BI templates
Complete projects built by the Excelverton factory: view them live with a free account and download the PBIP as a channel subscriber (1/month) or Pro subscriber (unlimited).
Create your free account
Save favorites, build collections and use the AI assistant — at no cost.