Historical stock prices
This report shows historical stock prices, useful for market analysis.
Create a free account
Save your favorite dashboards, get new templates by area and ask the AI assistant — for free.
About the Historical stock prices dashboard
This is a free Power BI dashboard called Historical stock prices, in the Financeiro domain. Explore KPIs, interactive visualizations and get inspired for your own data and business intelligence projects.
This report shows historical stock prices, useful for market analysis.
Dashboard analysis
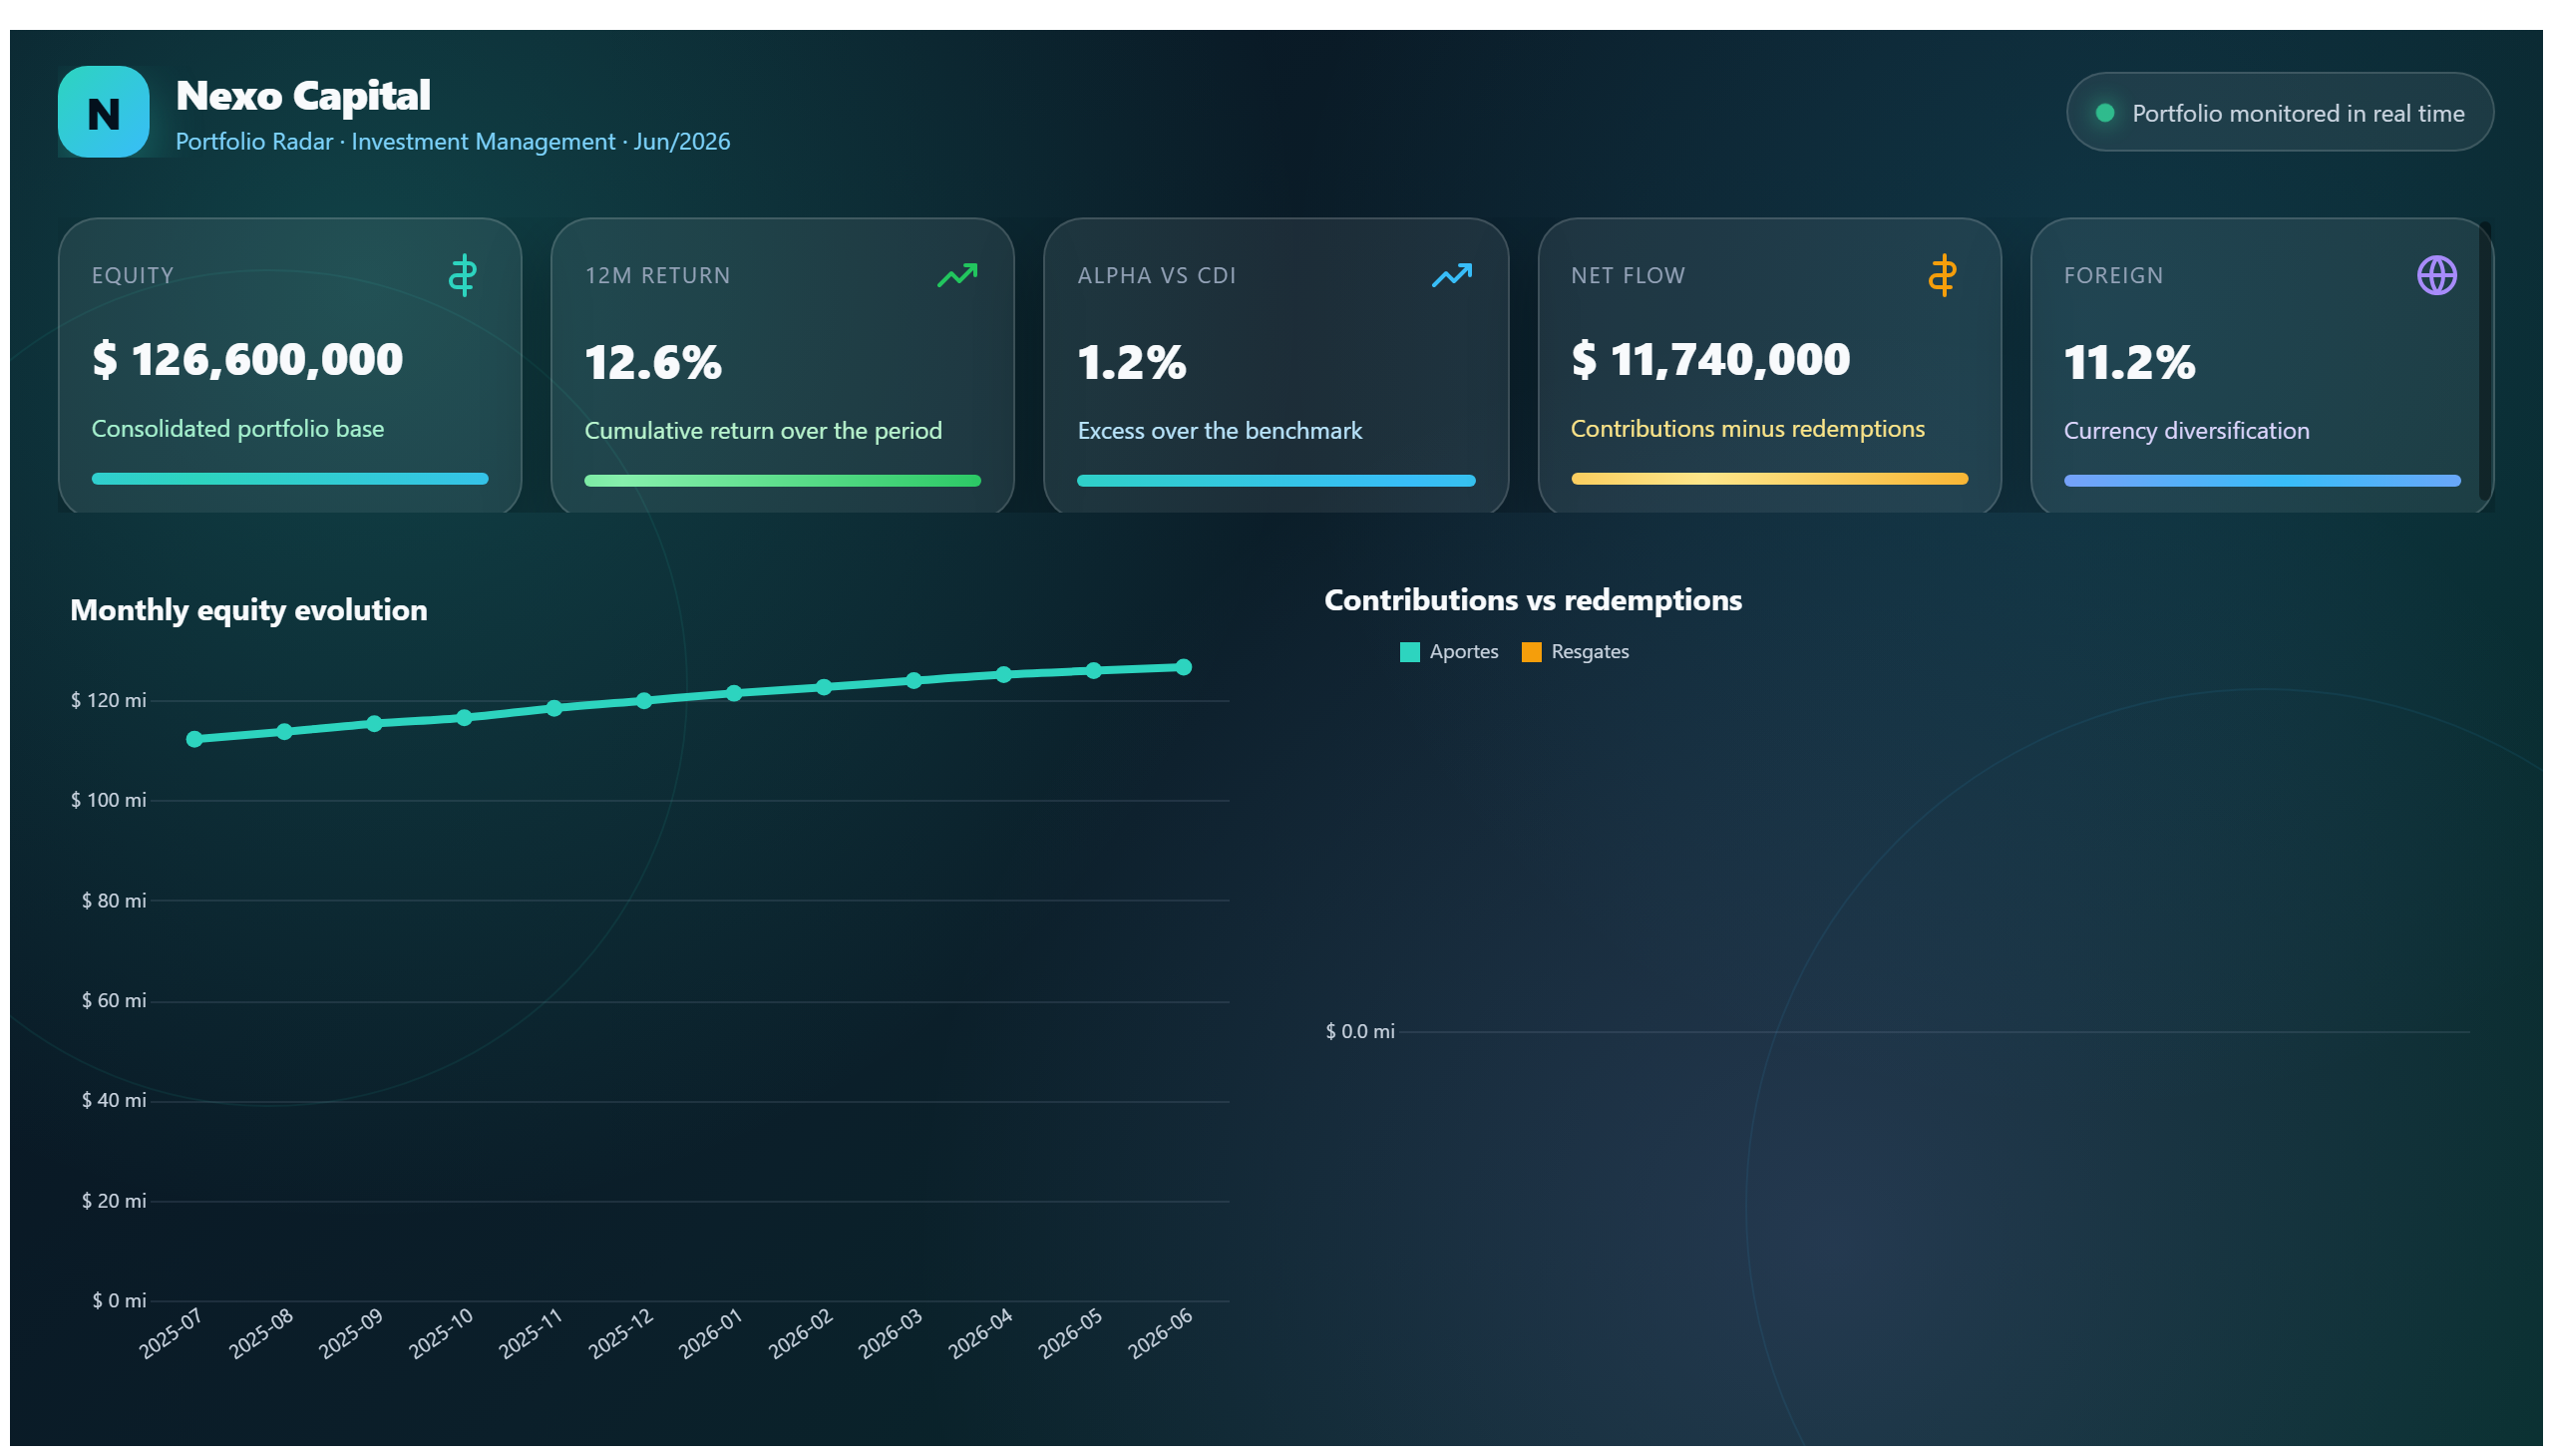
Historical Stock Prices dashboard provides a comprehensive view of stock price movements over time, enabling users to analyze market trends and fluctuations. By visualizing historical data, this report helps investors and financial analysts understand how specific stocks have performed across different periods, identifying patterns that may inform future investment decisions.
This dashboard answers key business questions such as: How have stock prices evolved over months or years? Are there identifiable trends or seasonal effects impacting stock performance? What periods experienced significant volatility or growth? These insights are crucial for portfolio management, risk assessment, and strategic planning in financial markets.
Designed primarily for finance professionals, market analysts, and data enthusiasts, this dashboard supports data-driven decision-making by presenting clear and interactive visualizations of historical stock data. It serves as a valuable tool for those seeking to deepen their understanding of market behavior and optimize investment strategies.
Frequently asked questions about this dashboard
What time periods can I analyze in this dashboard?
The dashboard displays historical stock prices over various time frames, allowing users to explore data from short-term to long-term periods.
Can I identify trends or patterns in stock prices using this report?
Yes, the dashboard highlights trends and fluctuations in stock prices, helping users detect patterns that may influence investment decisions.
Who is the intended audience for this dashboard?
This dashboard is designed for finance professionals, market analysts, and anyone interested in analyzing historical stock market data.
Want a dashboard like this with your data?
We build a custom version for your business — US$ 50 per page, delivered within 7 calendar days.
Finance Power BI templates
Complete projects built by the Excelverton factory: view them live with a free account and download the PBIP as a channel subscriber (1/month) or Pro subscriber (unlimited).
Create your free account
Save favorites, build collections and use the AI assistant — at no cost.