DataCo-Supply-Chain-Analysis
This report analyzes data related to a company's supply chain.
Create a free account
Save your favorite dashboards, get new templates by area and ask the AI assistant — for free.
About the DataCo-Supply-Chain-Analysis dashboard
This is a free Power BI dashboard called DataCo-Supply-Chain-Analysis, in the Logística domain. Explore KPIs, interactive visualizations and get inspired for your own data and business intelligence projects.
This report analyzes data related to a company's supply chain.
Dashboard analysis
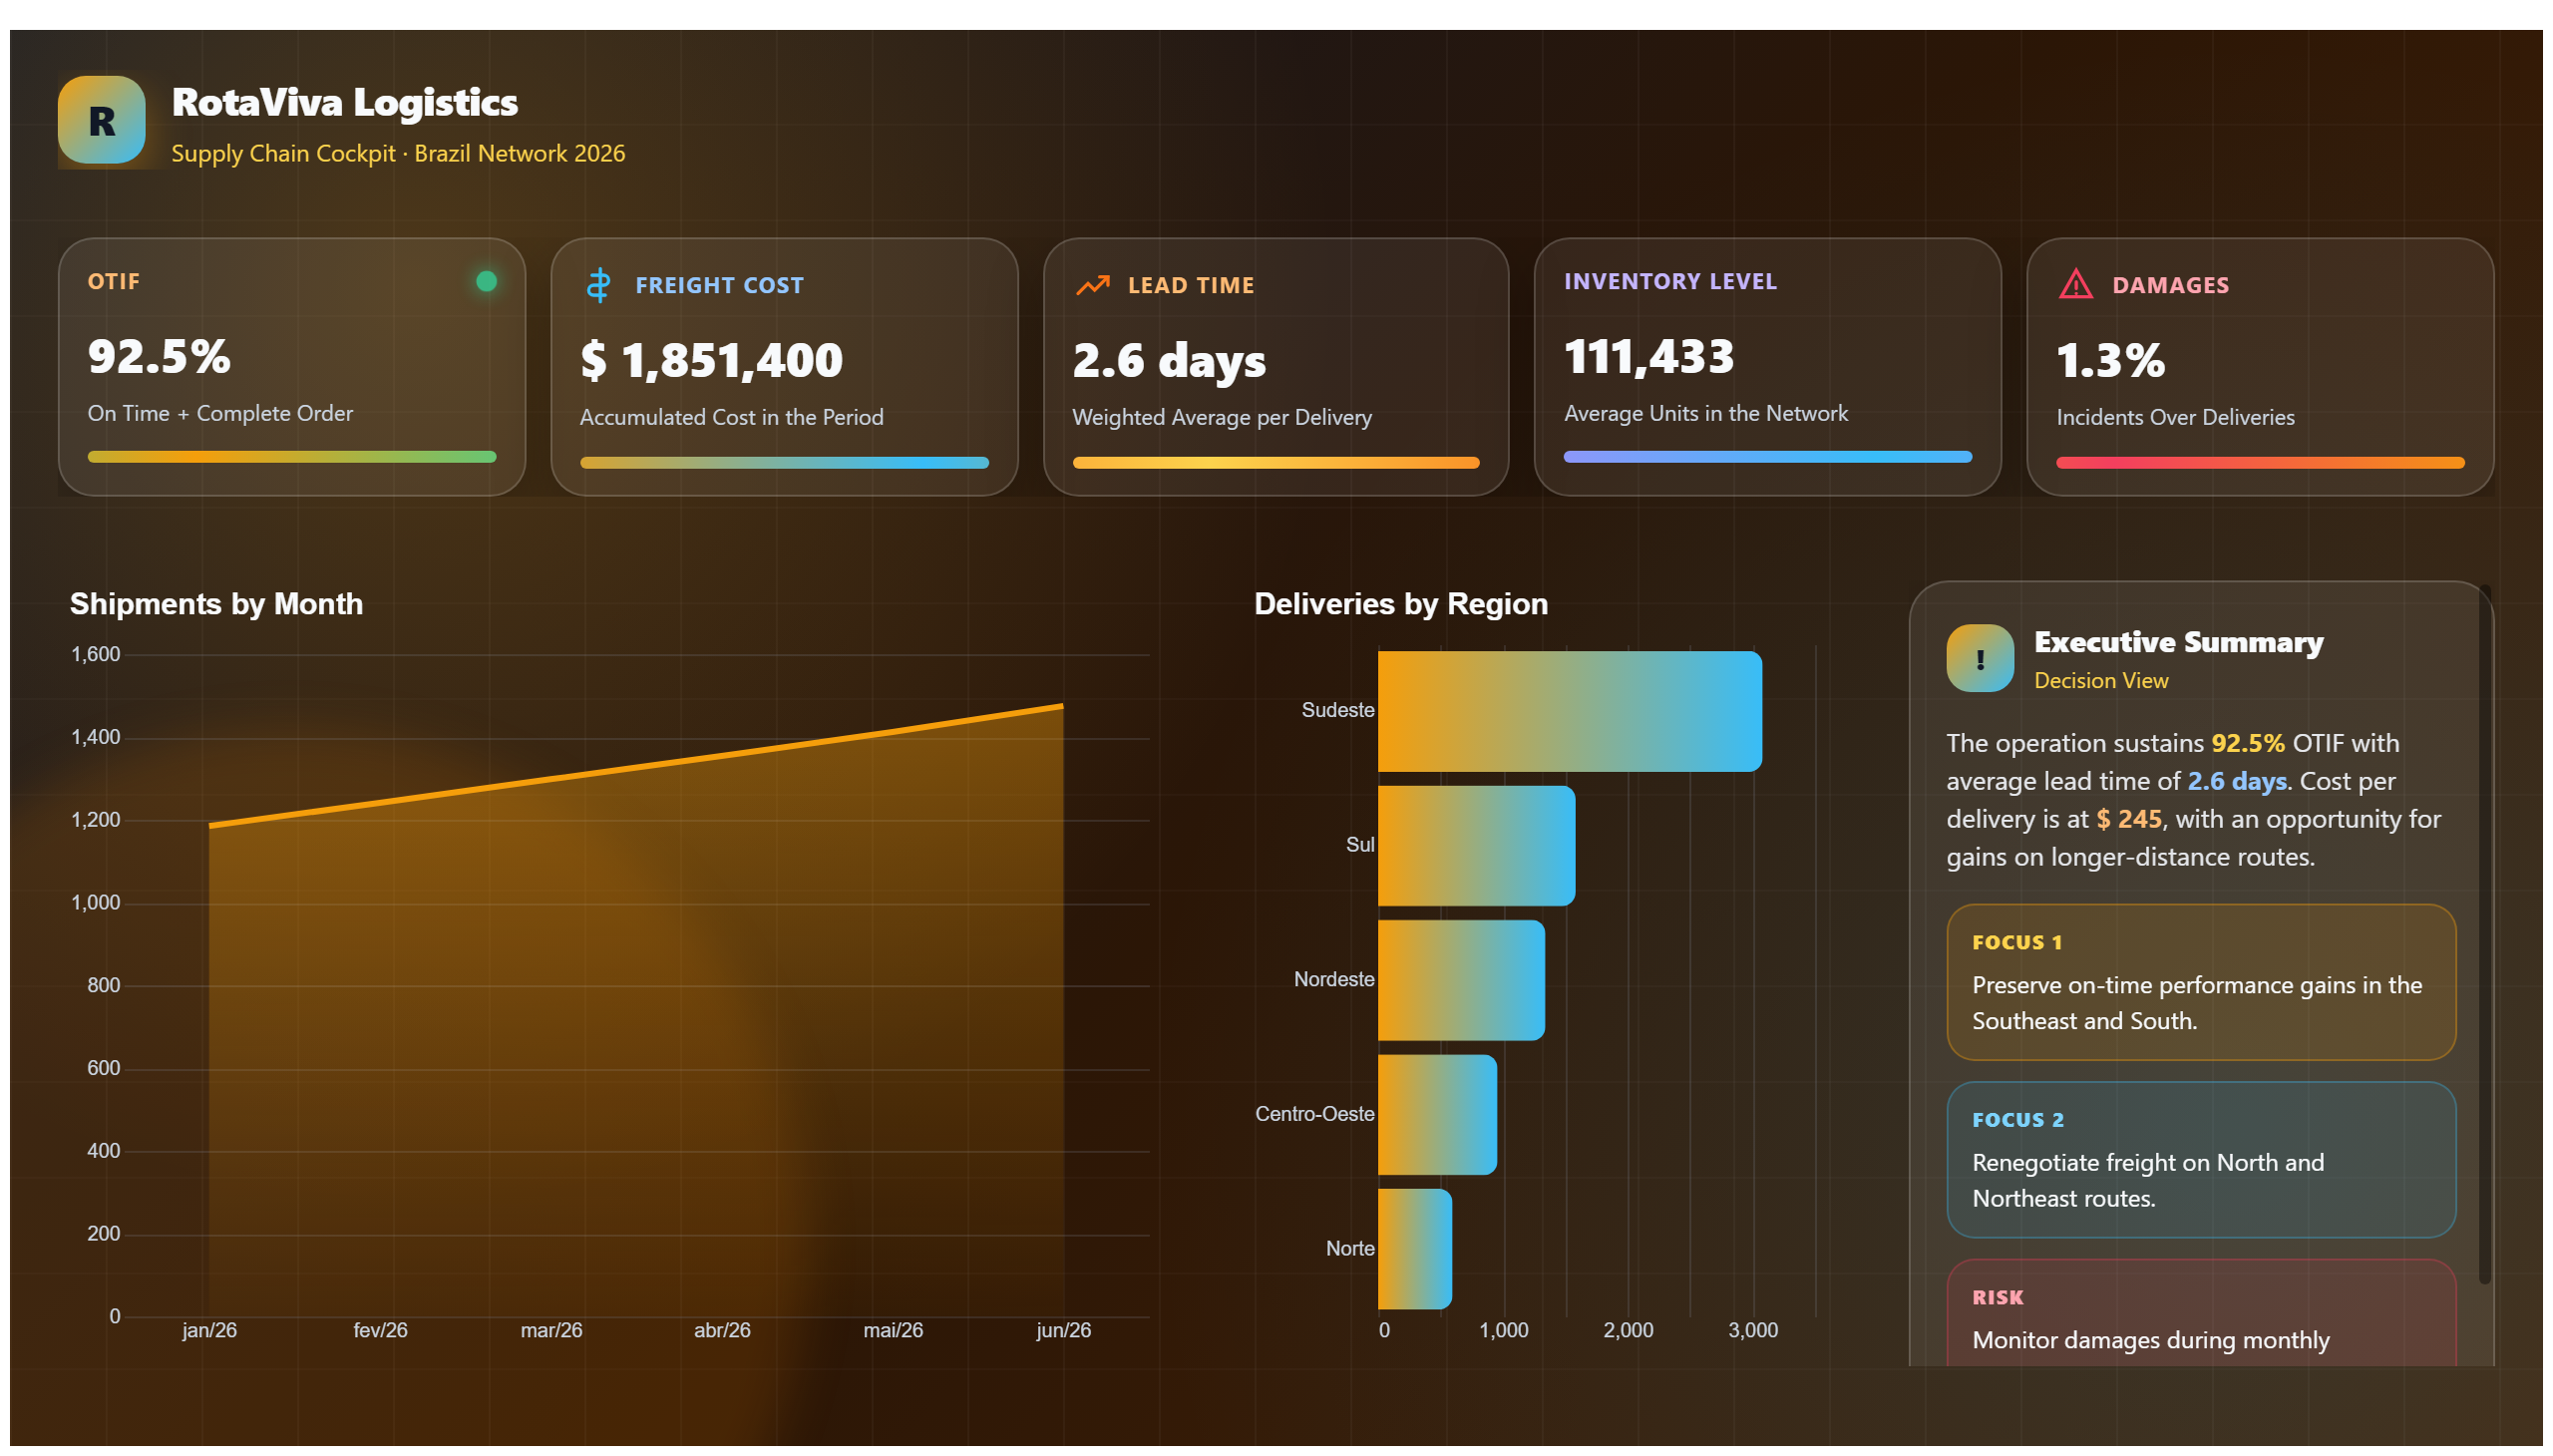
This dashboard provides a comprehensive analysis of a company's supply chain data, offering valuable insights into various stages of the supply process. It visualizes key metrics such as inventory levels, supplier performance, and delivery timelines, helping users understand the overall efficiency and bottlenecks within the supply chain.
The report addresses critical business questions like: How well are suppliers performing against agreed timelines? Where are the delays occurring in the supply chain? What is the current status of inventory across different locations? By answering these questions, the dashboard supports decision-making aimed at optimizing supply chain operations and reducing costs.
Designed for supply chain managers, operations analysts, and executives, this dashboard serves as a strategic tool to monitor supply chain health, identify risks, and drive continuous improvement initiatives. Its clear visualizations enable quick interpretation of complex data, facilitating proactive management and enhanced collaboration across departments.
Frequently asked questions about this dashboard
What key supply chain metrics are tracked in this dashboard?
The dashboard tracks metrics such as inventory levels, supplier delivery performance, and lead times across the supply chain.
Who is the primary audience for this supply chain analysis report?
The primary users are supply chain managers, operations analysts, and company executives responsible for supply chain performance.
How can this dashboard help improve supply chain efficiency?
By identifying delays, monitoring supplier performance, and highlighting inventory issues, the dashboard enables targeted actions to optimize processes and reduce costs.
Want a dashboard like this with your data?
We build a custom version for your business — US$ 50 per page, delivered within 7 calendar days.
Logistics Power BI templates
Complete projects built by the Excelverton factory: view them live with a free account and download the PBIP as a channel subscriber (1/month) or Pro subscriber (unlimited).
Create your free account
Save favorites, build collections and use the AI assistant — at no cost.