TechTip24 Ecom Web Analysis
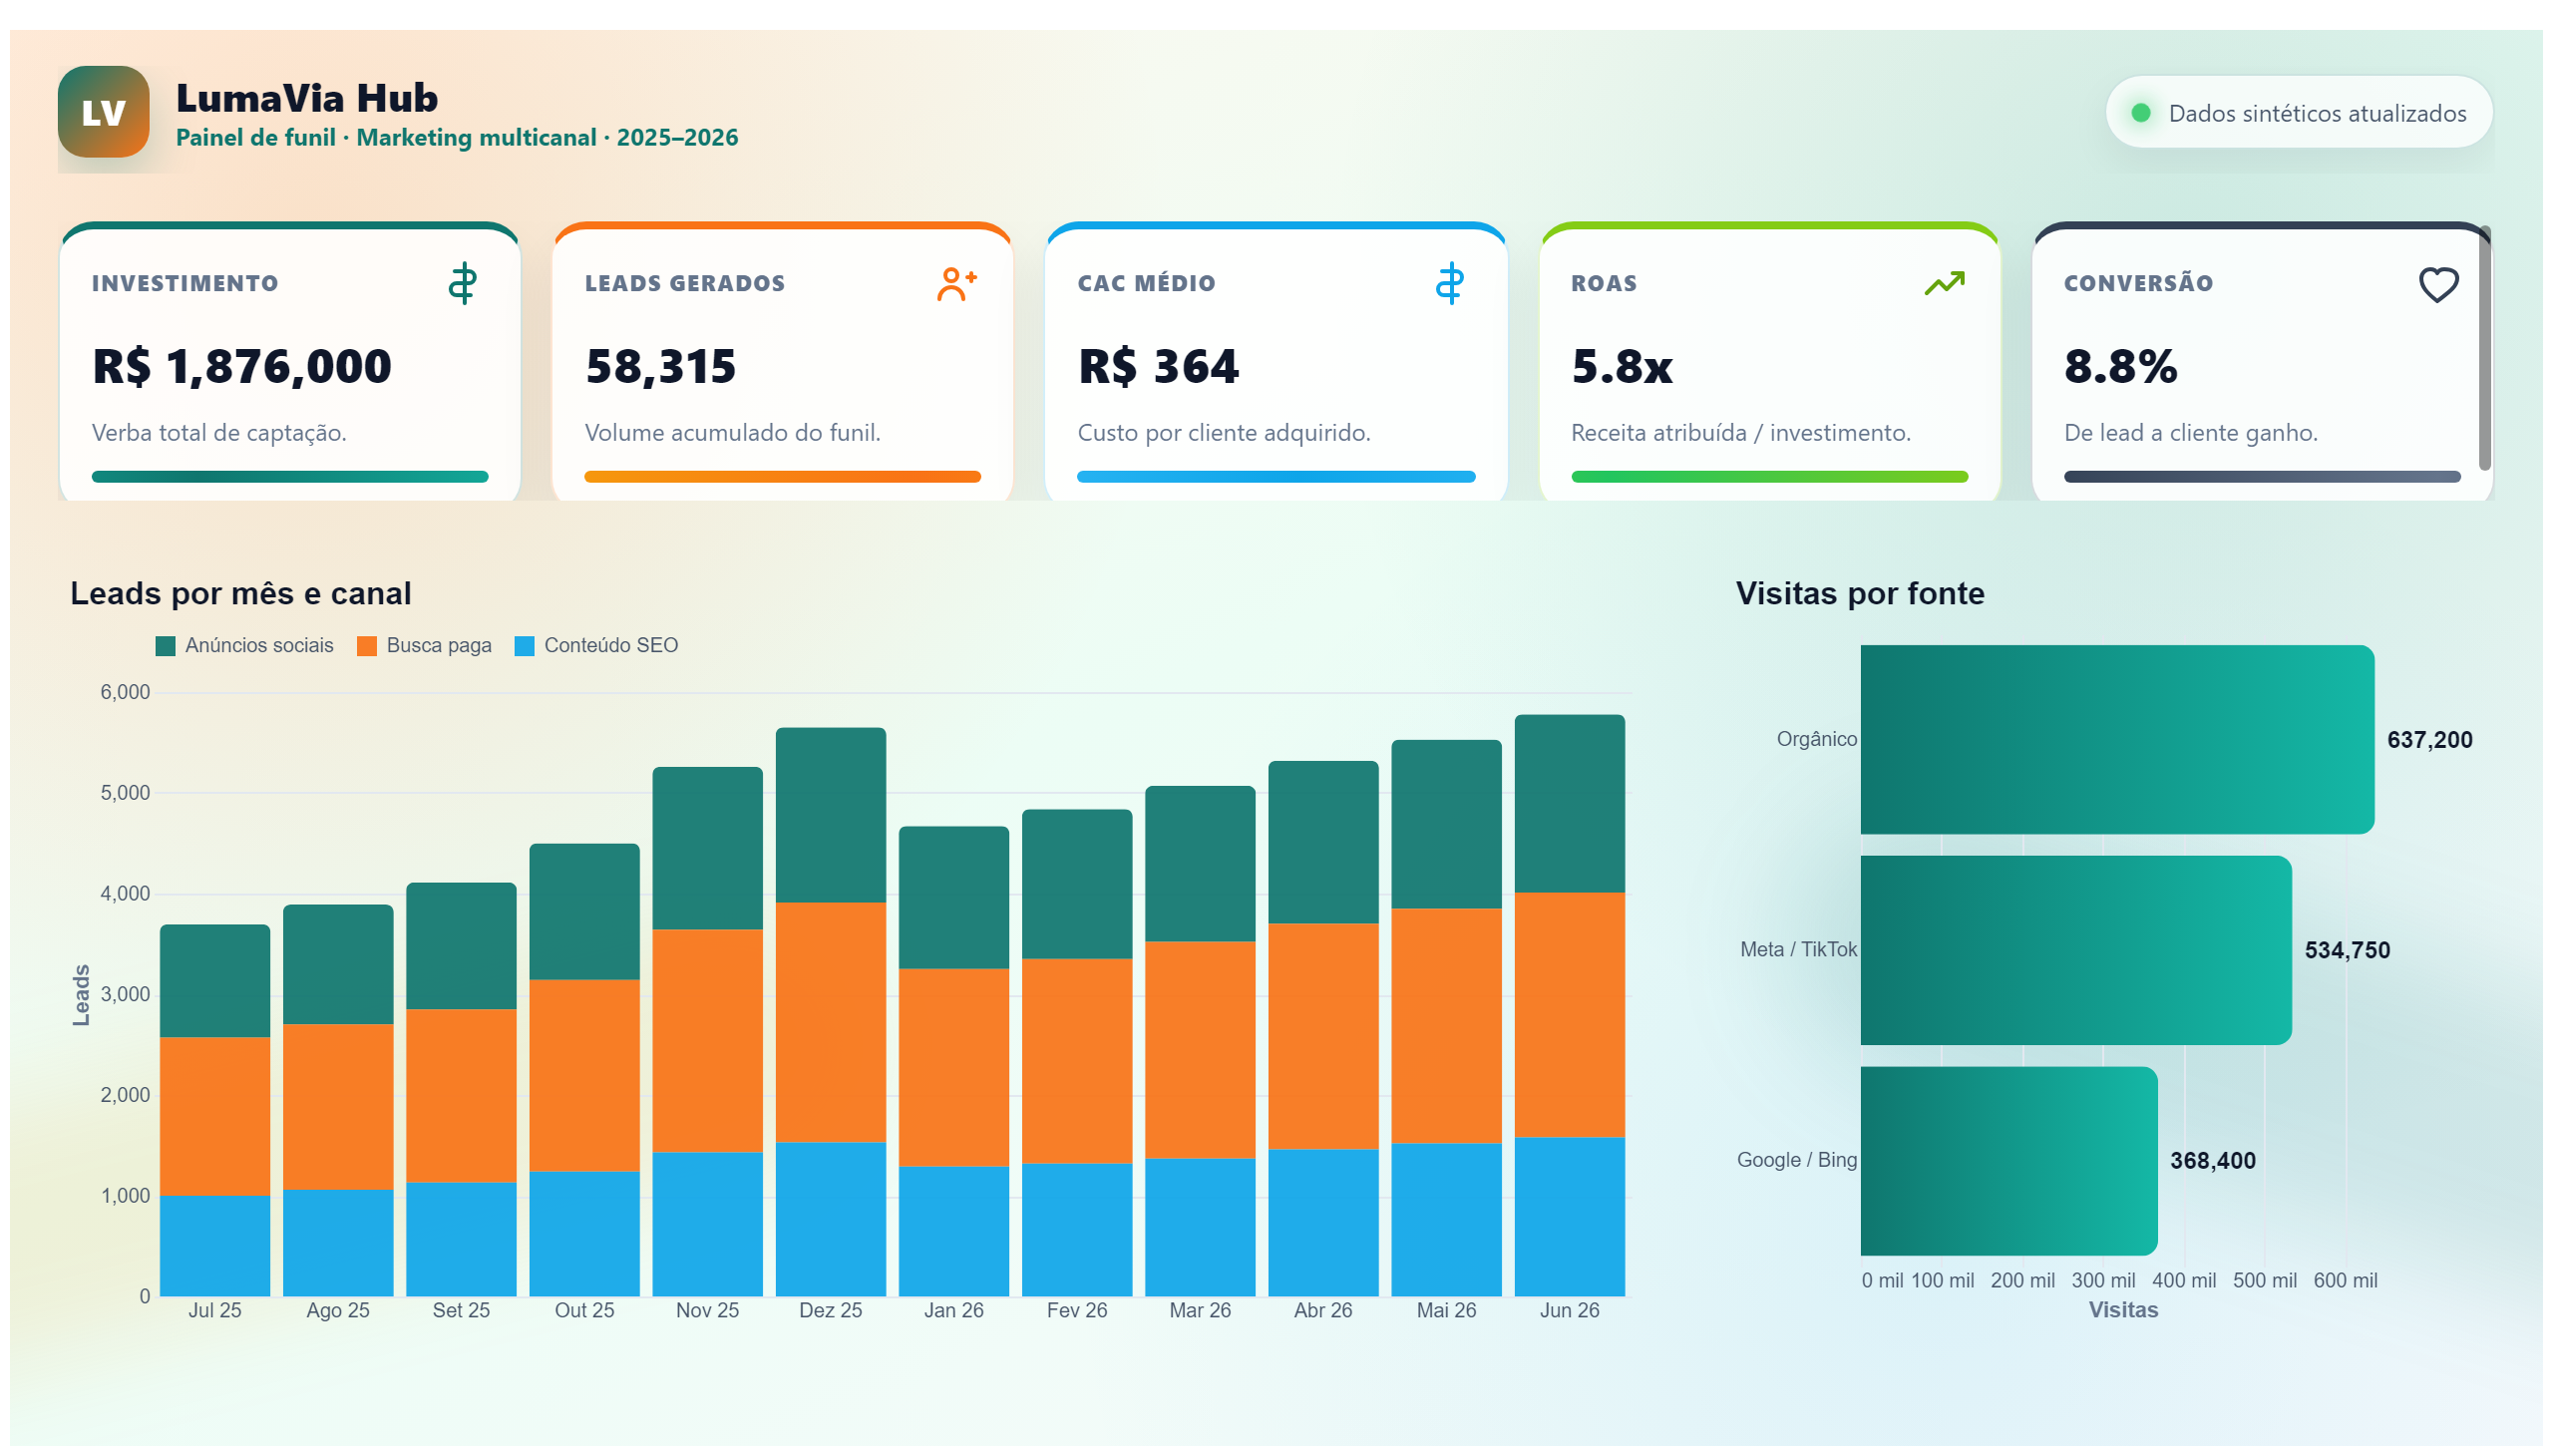
This report analyzes e-commerce performance, including sales metrics and customer behavior.
Create a free account
Save your favorite dashboards, get new templates by area and ask the AI assistant — for free.
About the TechTip24 Ecom Web Analysis dashboard
This is a free Power BI dashboard called TechTip24 Ecom Web Analysis, in the Marketing domain. Explore KPIs, interactive visualizations and get inspired for your own data and business intelligence projects.
This report analyzes e-commerce performance, including sales metrics and customer behavior.
Dashboard analysis
The TechTip24 Ecom Web Analysis dashboard provides a comprehensive overview of e-commerce performance by focusing on key sales metrics and customer behavior patterns. It enables users to track revenue trends, conversion rates, and customer engagement, offering valuable insights into how effectively the online store is operating. By visualizing sales data alongside customer interactions, this report helps identify which products are performing well and where potential drop-offs occur in the purchase funnel.
This dashboard answers critical business questions such as: How are sales evolving over time? Which customer segments are driving the most revenue? What behaviors lead to higher conversion rates? These insights support marketing and sales teams in optimizing campaigns, improving user experience, and ultimately increasing online sales. The report is ideal for e-commerce managers, digital marketers, and data analysts seeking to make data-driven decisions to enhance the store's performance.
Frequently asked questions about this dashboard
What sales metrics are included in the TechTip24 Ecom Web Analysis dashboard?
The dashboard includes key sales metrics such as total revenue, conversion rates, and sales trends over time.
How does this dashboard help understand customer behavior?
It analyzes customer interactions and behaviors that influence purchasing decisions, helping identify which segments are most valuable.
Who is the primary audience for this dashboard?
The primary users are e-commerce managers, digital marketing teams, and data analysts focused on improving online sales performance.
Want a dashboard like this with your data?
We build a custom version for your business — US$ 50 per page, delivered within 7 calendar days.
Marketing Power BI templates
Complete projects built by the Excelverton factory: view them live with a free account and download the PBIP as a channel subscriber (1/month) or Pro subscriber (unlimited).

Create your free account
Save favorites, build collections and use the AI assistant — at no cost.