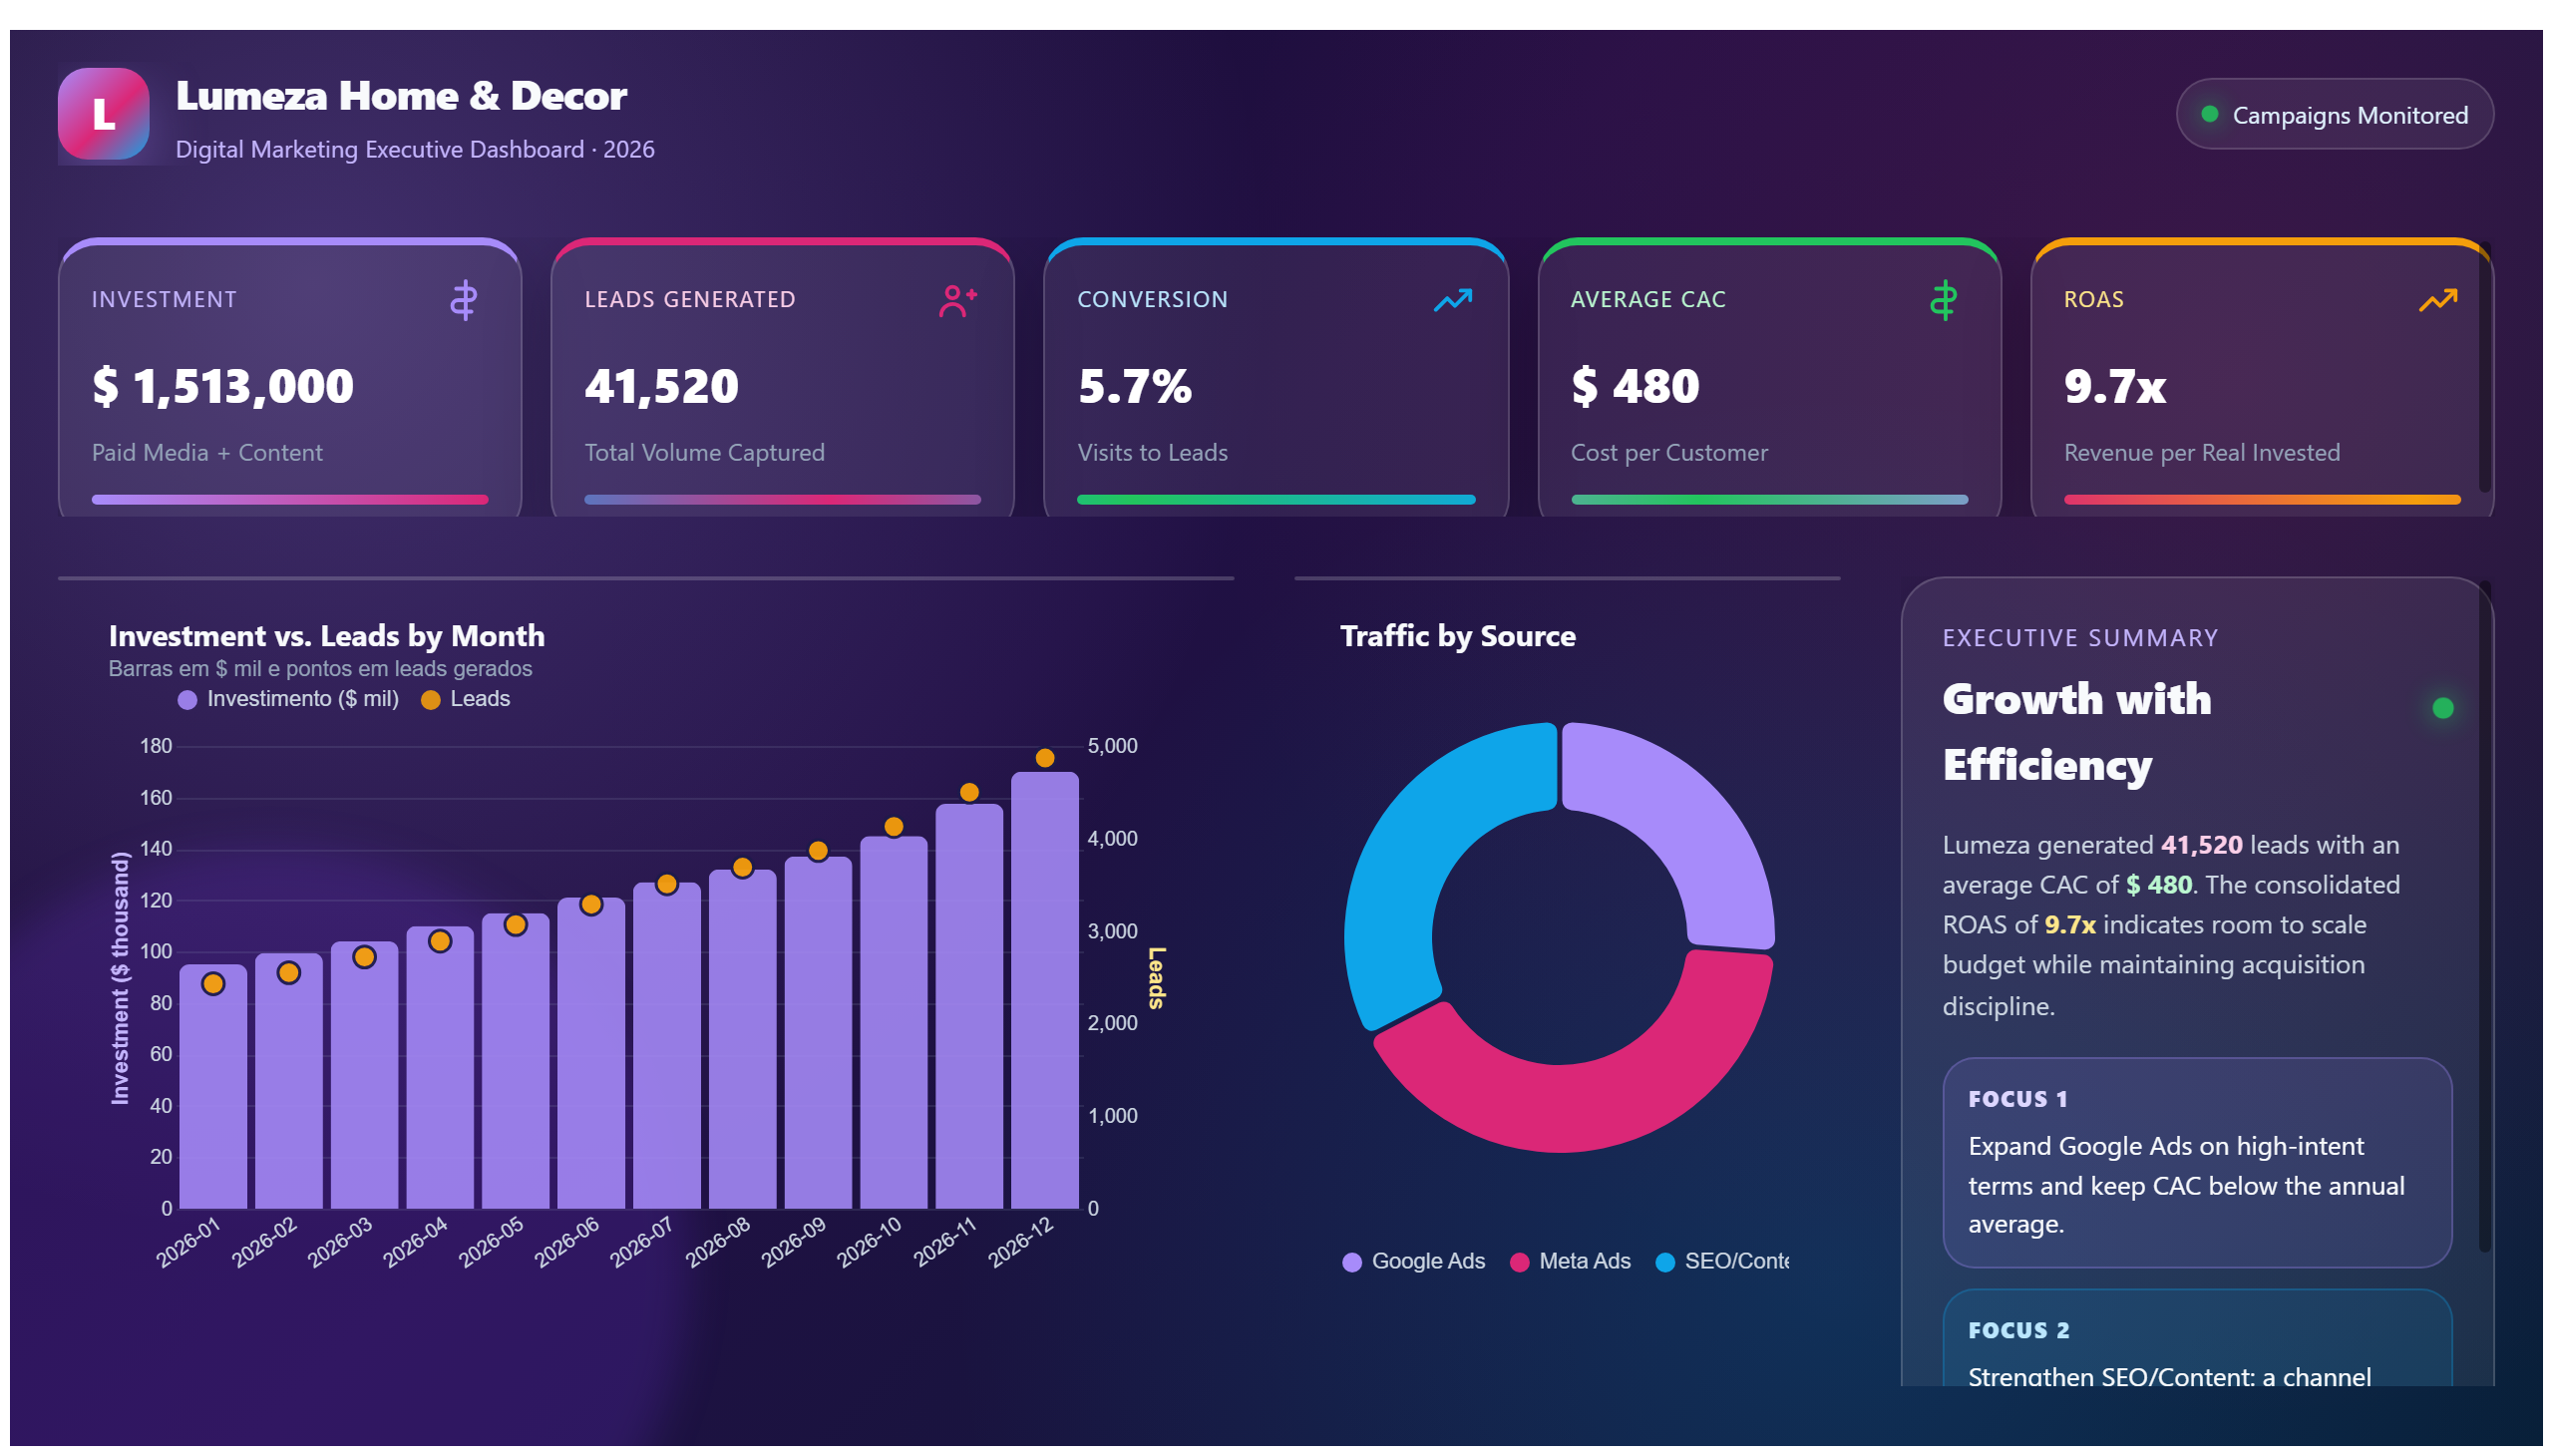
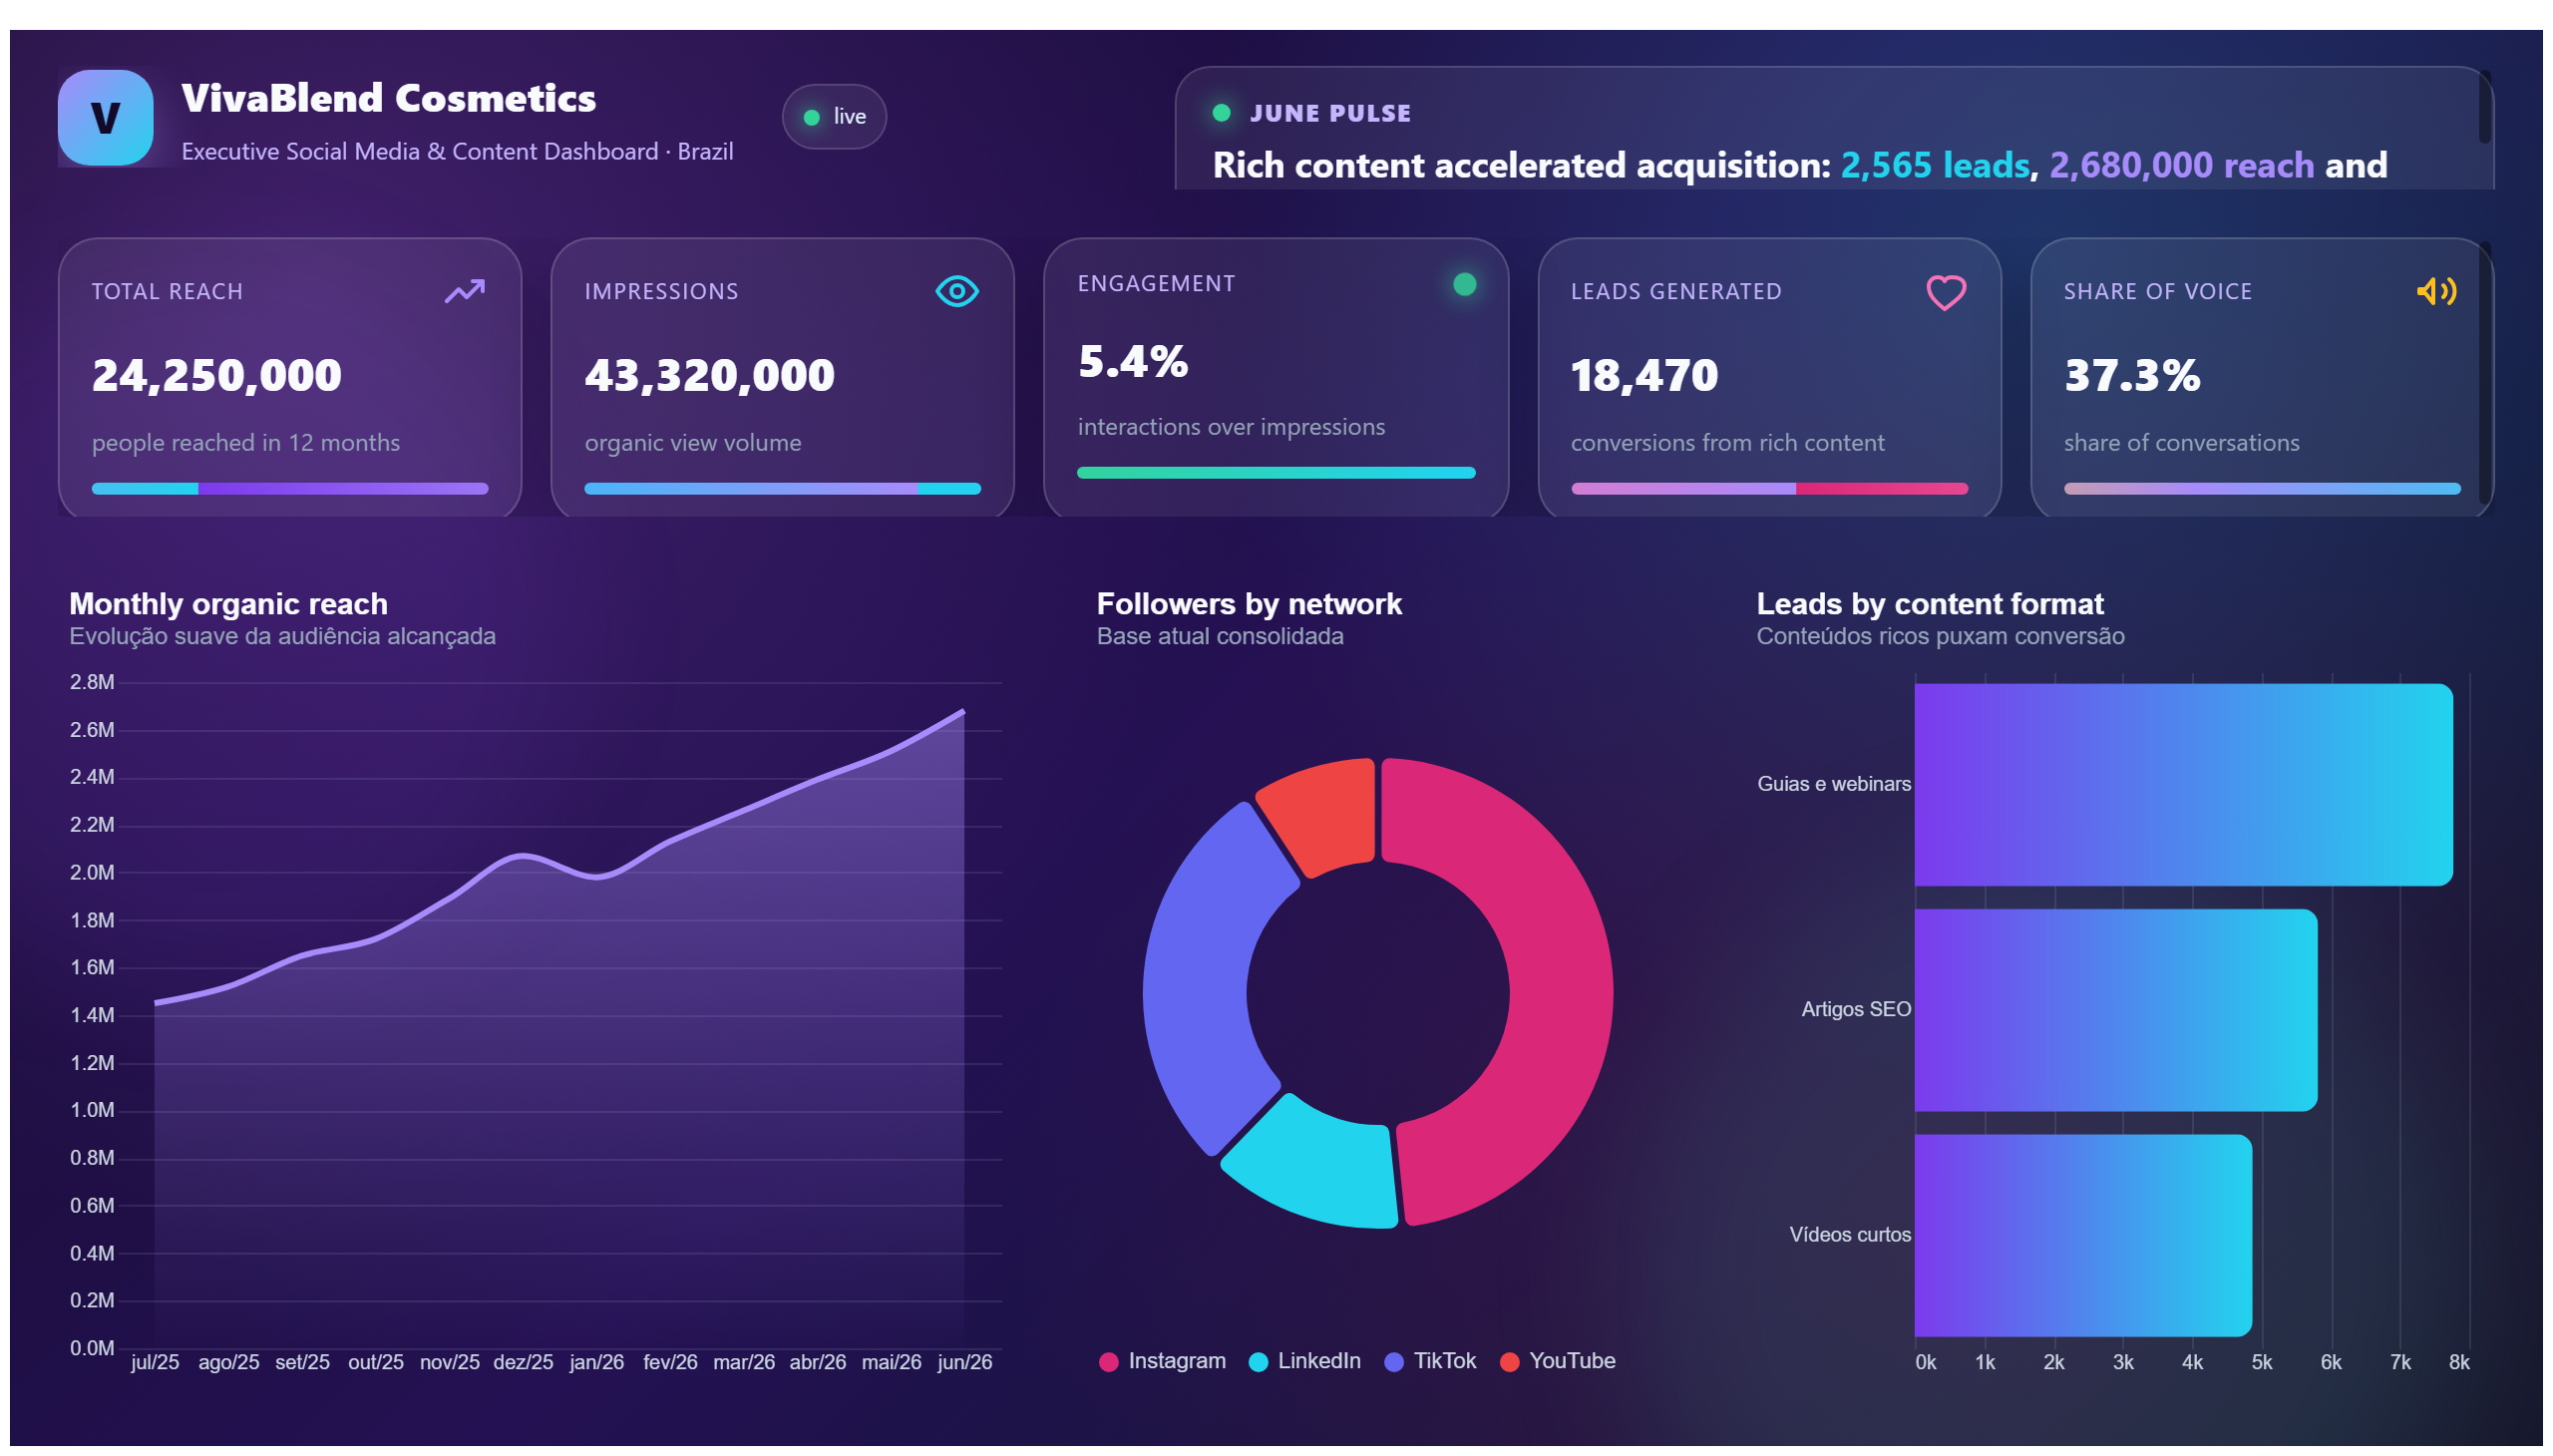
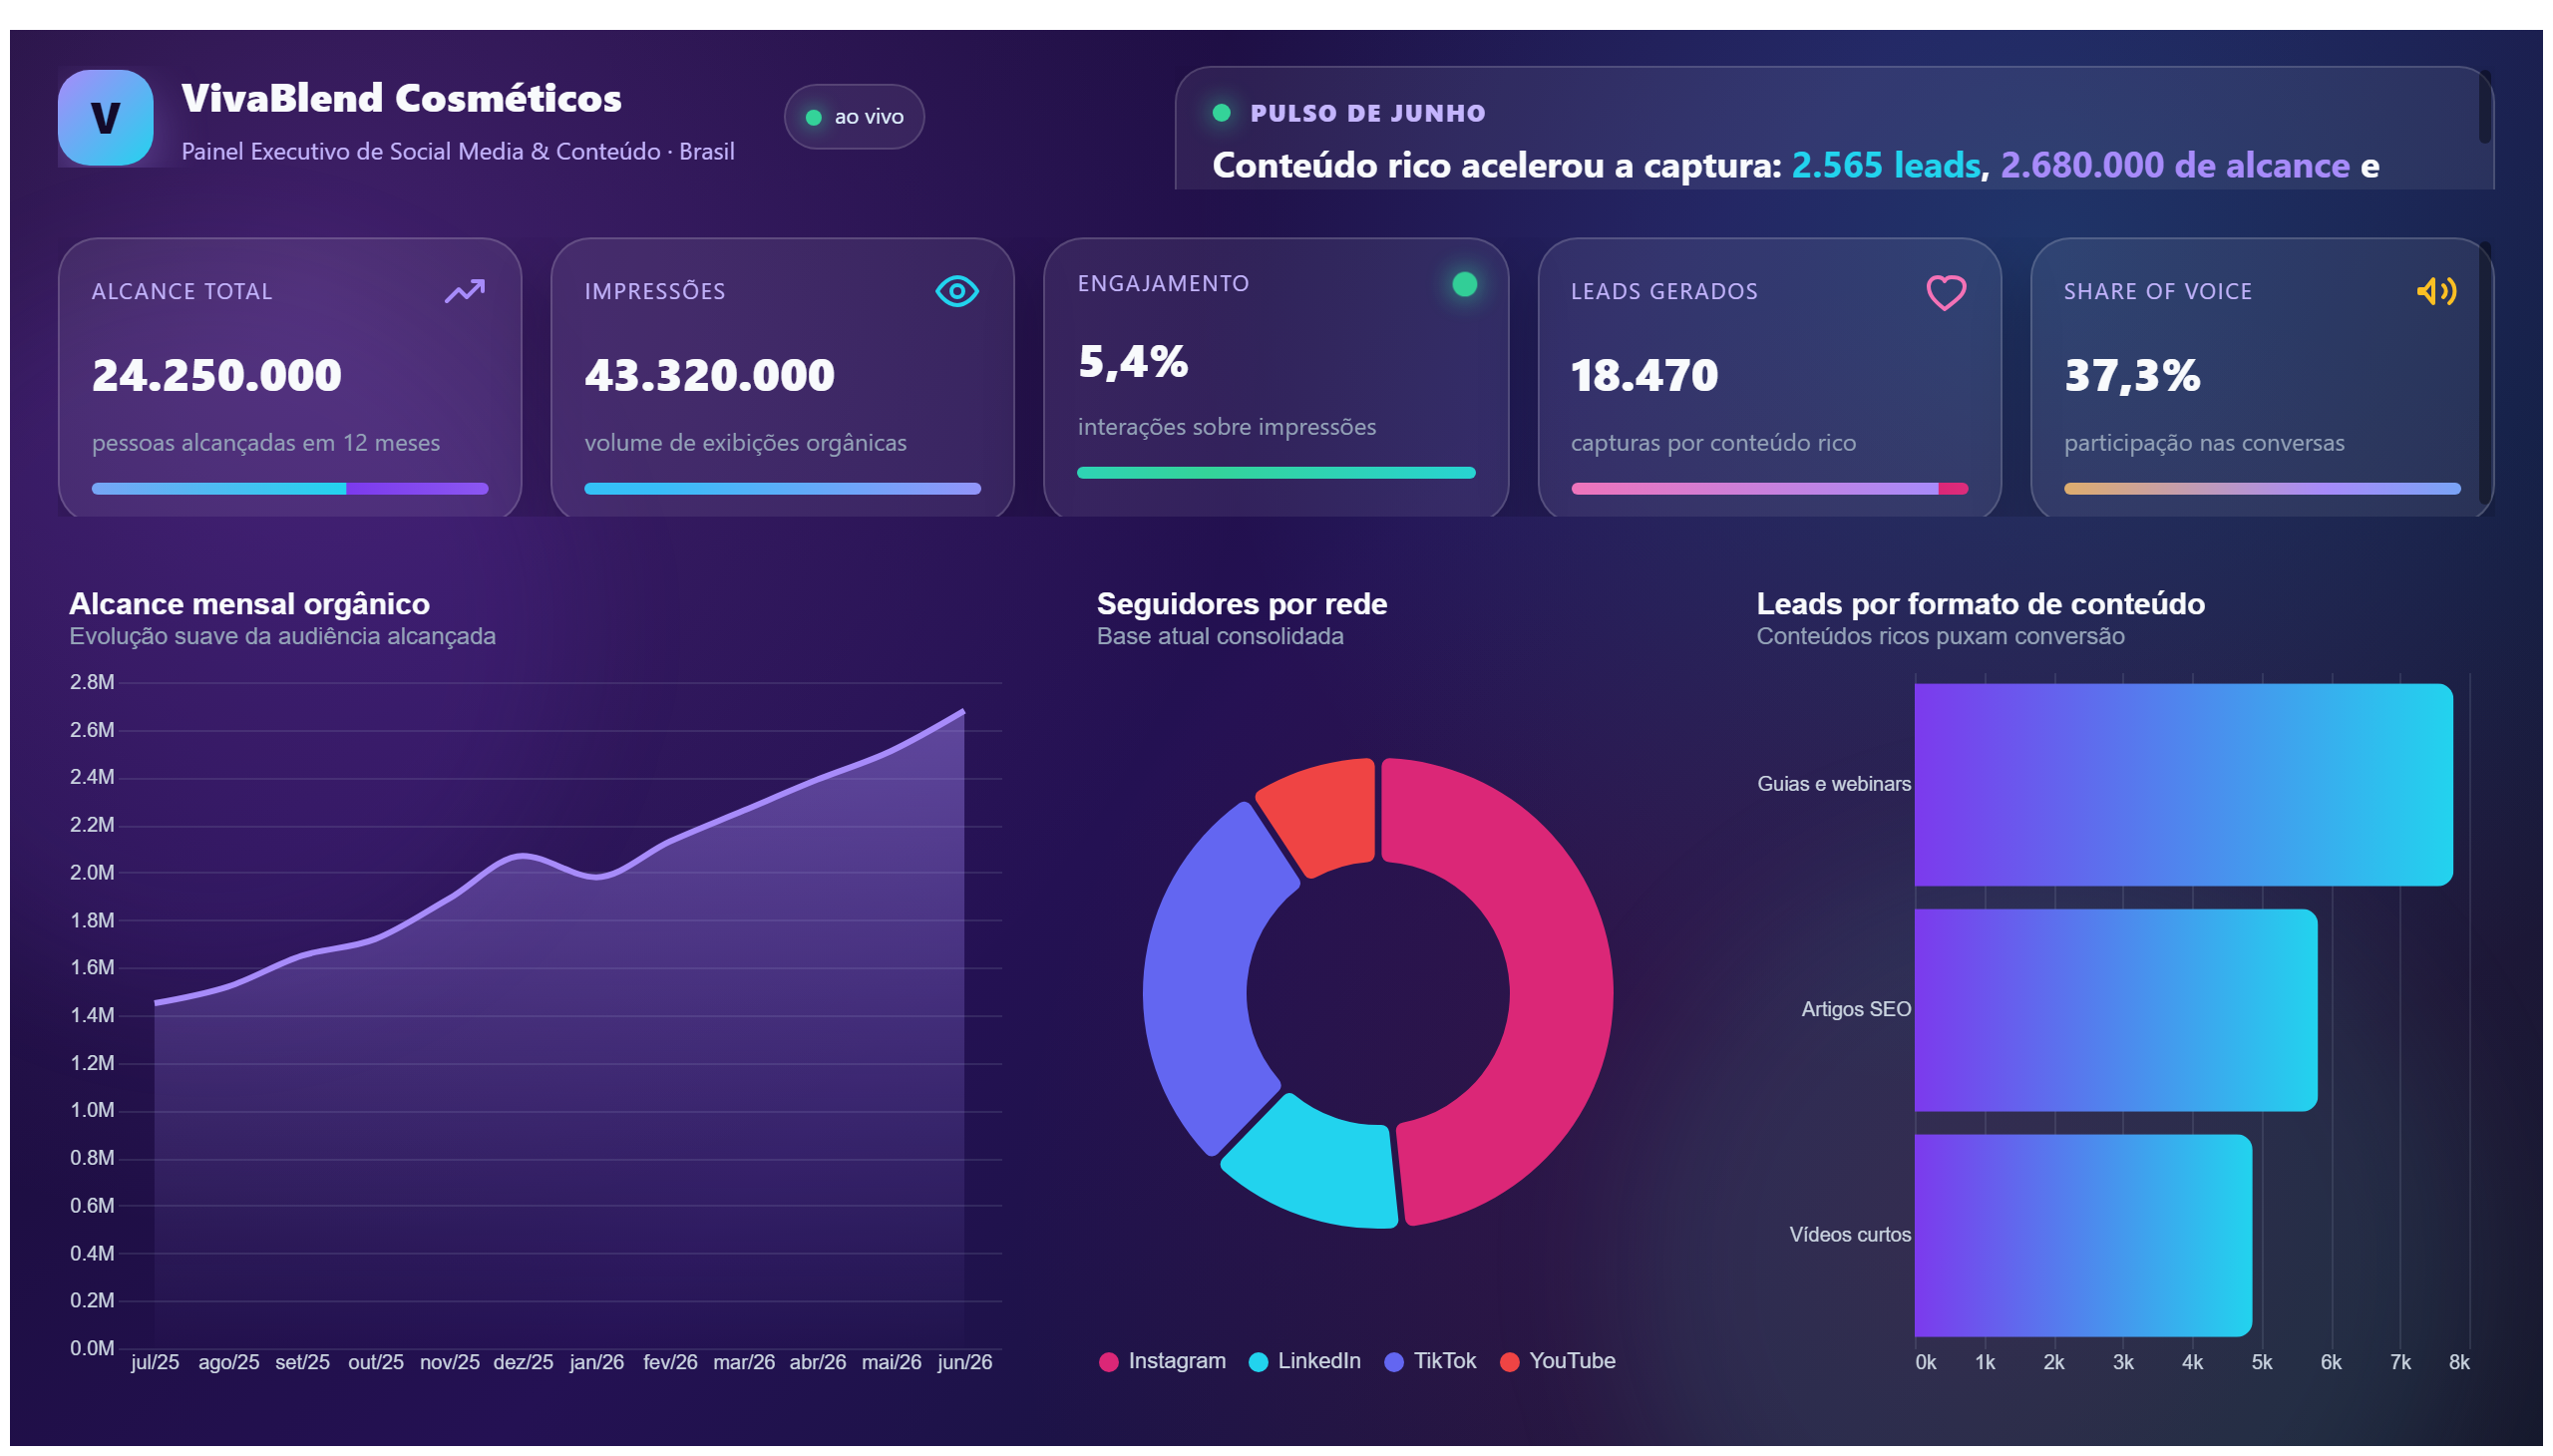
Gallery Deneb Grafico De barras
This report may show bar charts for analyzing marketing campaign performance.
This report analyzes Airbnb data, including booking trends and property performance.
Save your favorite dashboards, get new templates by area and ask the AI assistant — for free.
This is a free Power BI dashboard called AirBnb Analysis, in the Marketing domain. Explore KPIs, interactive visualizations and get inspired for your own data and business intelligence projects.
This report analyzes Airbnb data, including booking trends and property performance.
The AirBnb Analysis dashboard provides a comprehensive overview of Airbnb data, focusing on booking trends and property performance. It enables users to track how reservations fluctuate over time, identify peak booking periods, and assess the occupancy rates of various listings. This insight is crucial for hosts aiming to optimize pricing strategies and maximize revenue.
By analyzing key metrics such as booking volume, average stay duration, and property ratings, the dashboard helps answer important business questions like: Which locations have the highest demand? How do seasonal trends impact bookings? Which properties perform best in terms of guest satisfaction and occupancy? Marketing professionals and tourism stakeholders can leverage this data to tailor promotional campaigns and improve service offerings.
This report is ideal for Airbnb hosts, property managers, and marketing teams within the tourism sector who need actionable insights to enhance operational efficiency and customer engagement. It supports data-driven decision-making by presenting clear visualizations of complex datasets in an accessible format.
You can observe seasonal fluctuations, peak booking periods, and overall reservation volumes to understand when demand is highest.
It highlights occupancy rates and guest ratings, allowing hosts to identify top-performing listings and areas needing improvement.
The dashboard is designed for Airbnb hosts, property managers, and marketing professionals in the tourism industry seeking to optimize bookings and marketing strategies.
We build a custom version for your business — US$ 50 per page, delivered within 7 calendar days.
Explore more Power BI dashboards from the same domain to compare KPIs, layouts and analytics models.
This report may show bar charts for analyzing marketing campaign performance.
This report may present metrics of Facebook ads, helping to evaluate advertising campaigns.
Report on pay-per-click ads, analyzing campaign effectiveness.
This report provides a summary of the Hollywood theatrical market between 1995 and 2021.
Complete projects built by the Excelverton factory: view them live and download the PBIP — 1 free downloads every 30 days with a free account, unlimited on Pro.
Save favorites, build collections and use the AI assistant — at no cost.