Clase01
This report may be an initial presentation of a project or class exercise.
Create a free account
Save your favorite dashboards, get new templates by area and ask the AI assistant — for free.
About the Clase01 dashboard
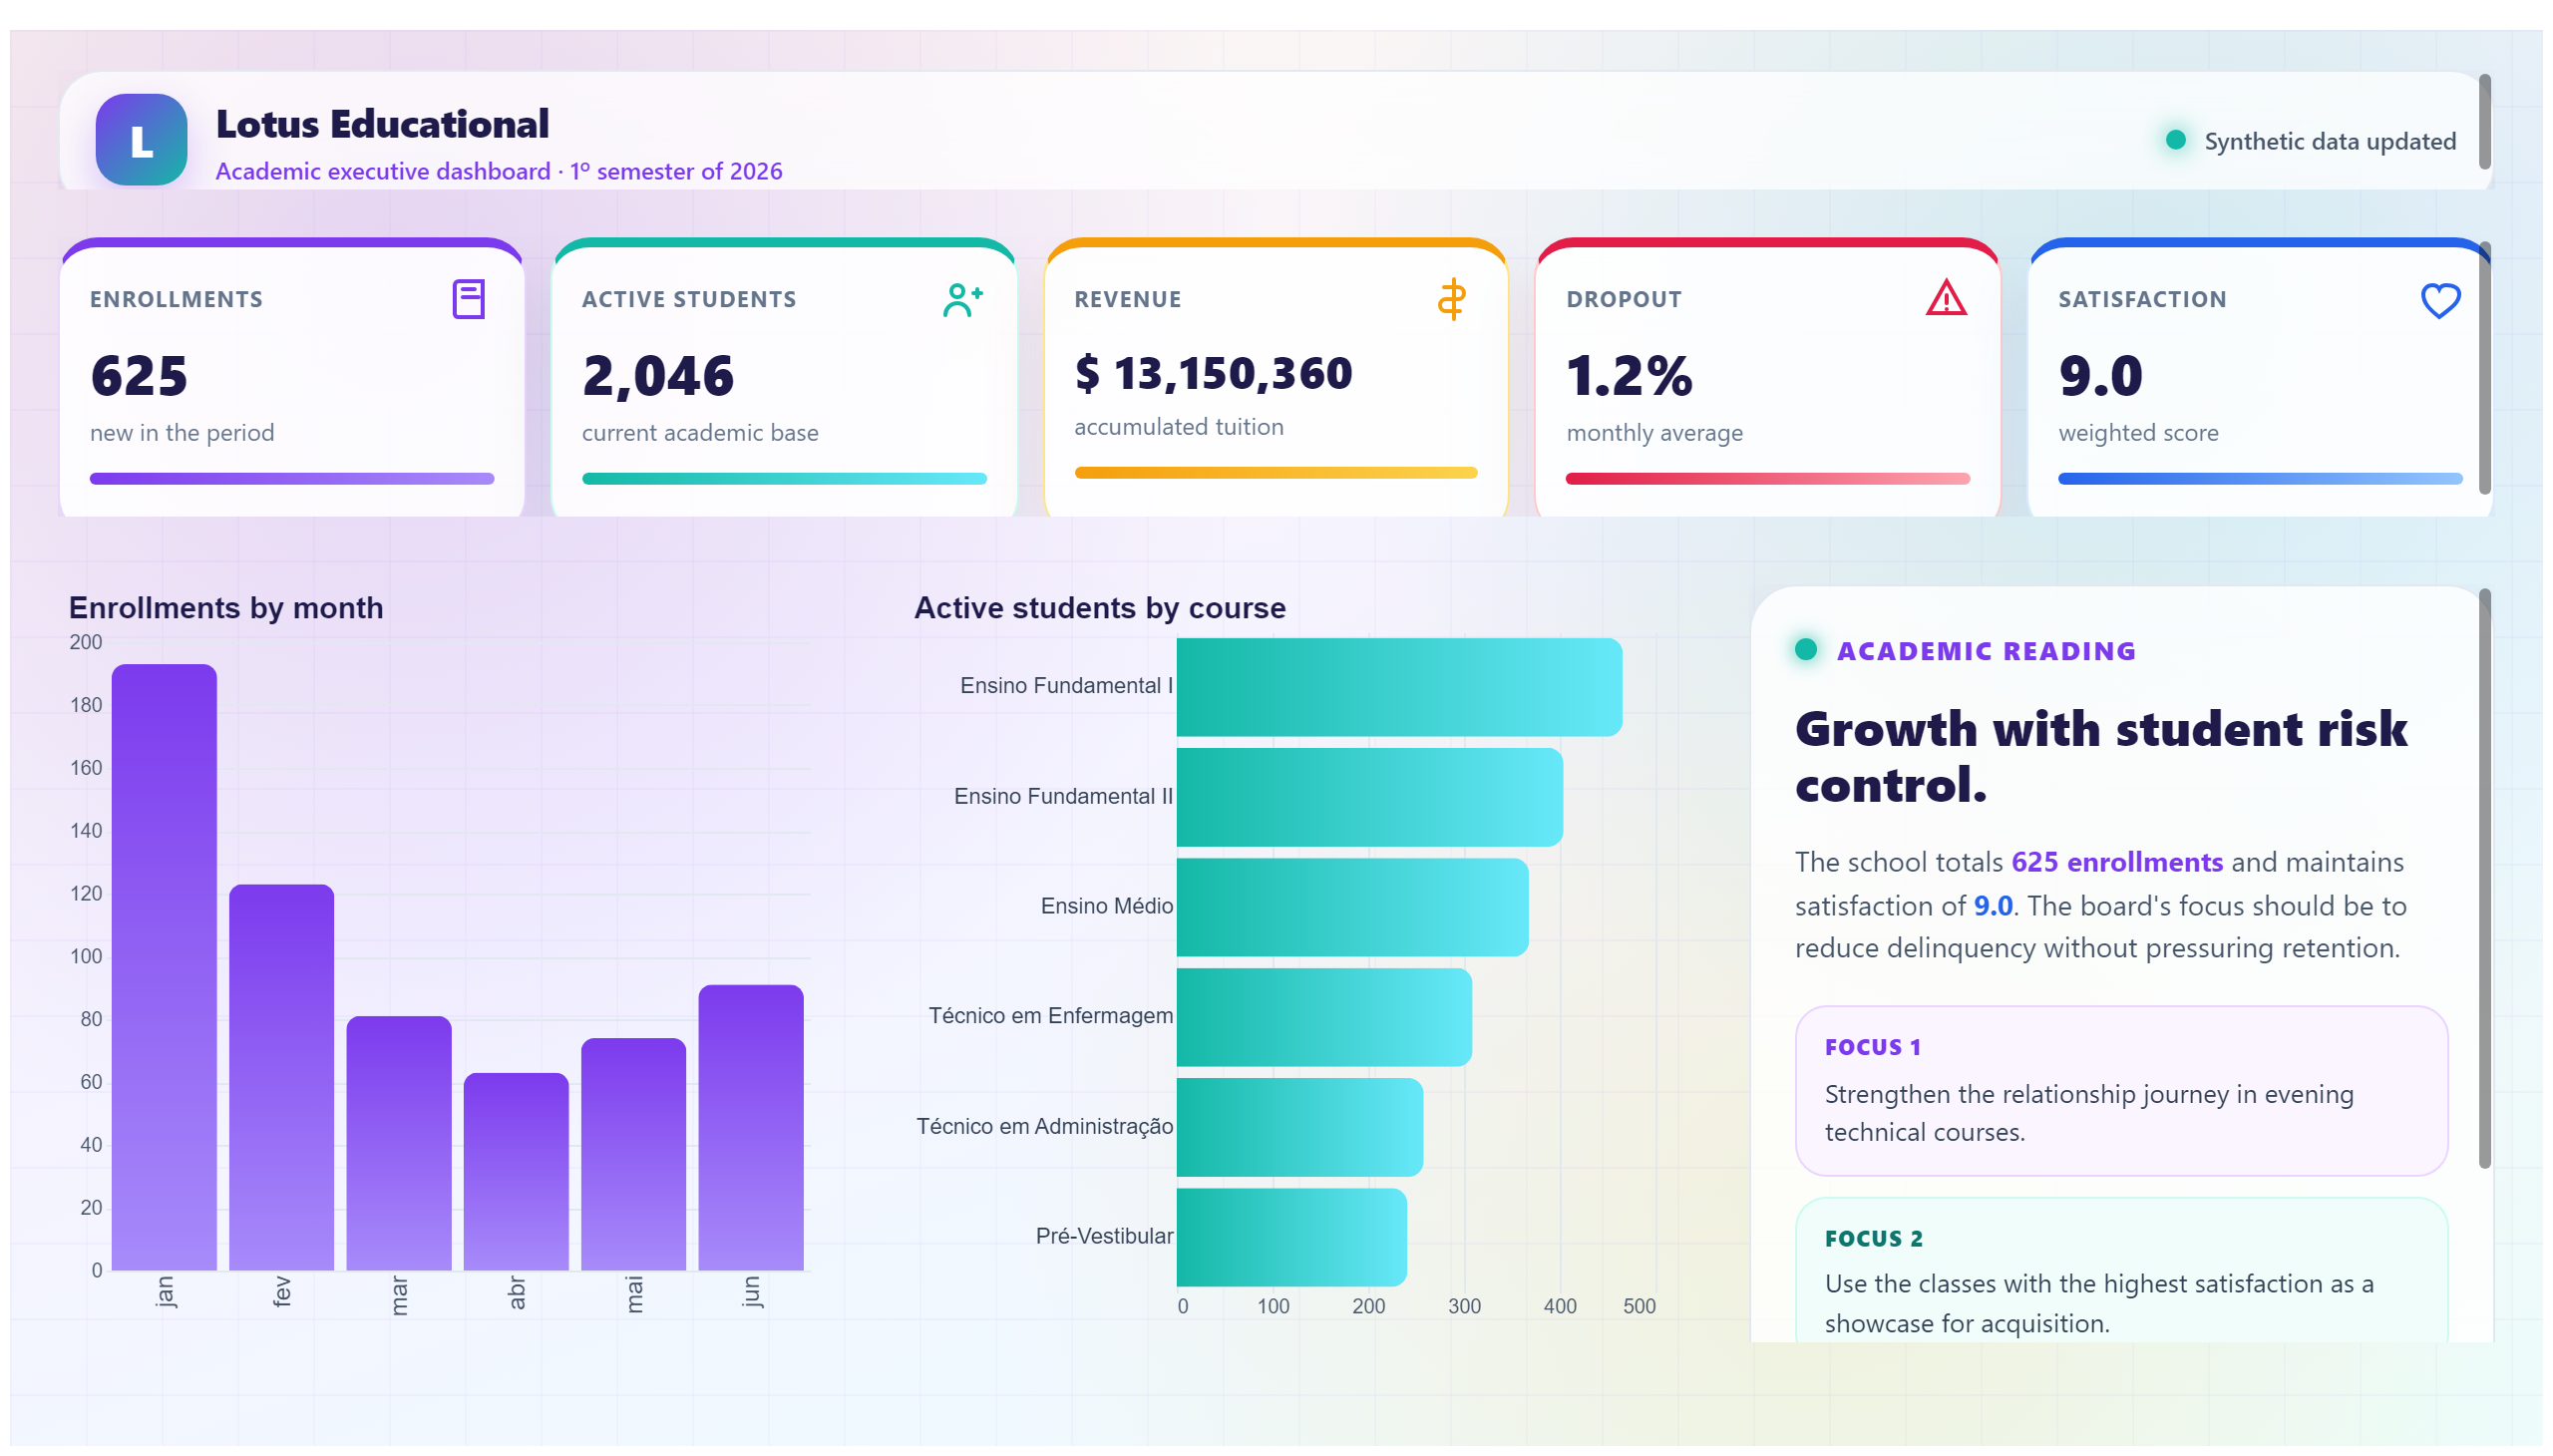
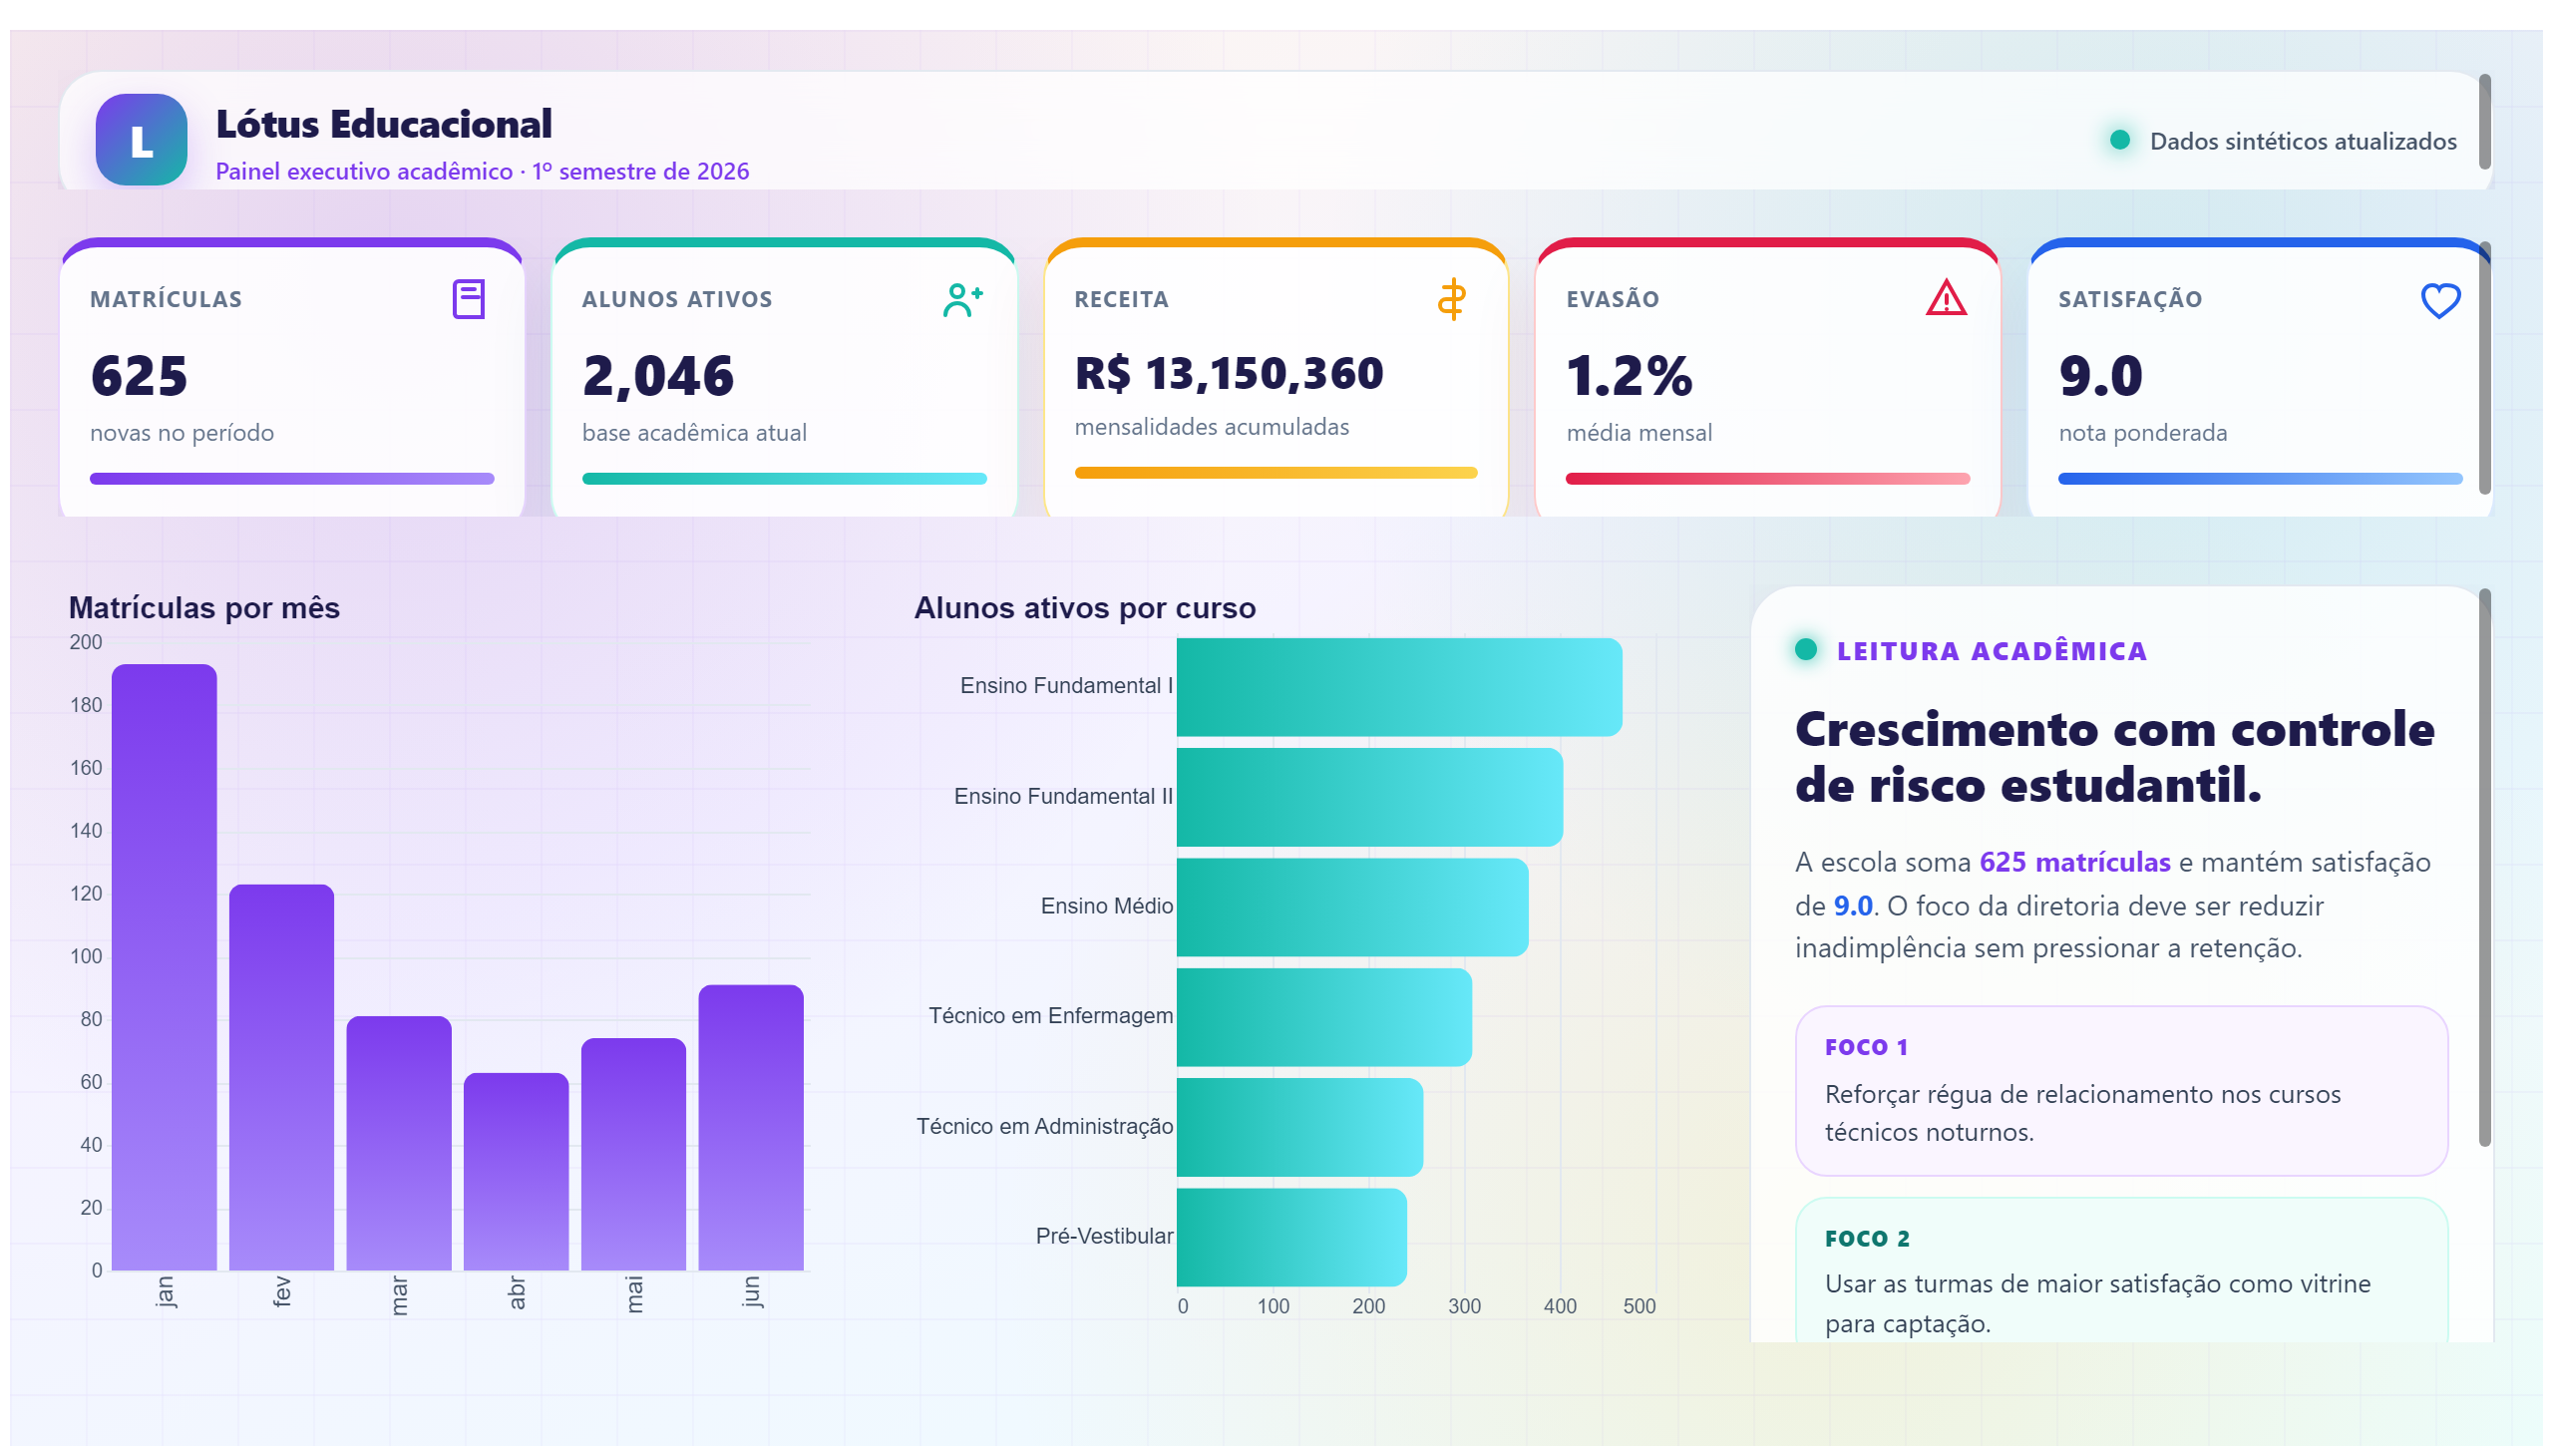
This is a free Power BI dashboard called Clase01, in the Educação domain. Explore KPIs, interactive visualizations and get inspired for your own data and business intelligence projects.
This report may be an initial presentation of a project or class exercise.
Dashboard analysis
Clase01 is designed as an introductory report, ideal for presenting the initial stages of a project or a classroom exercise. It serves as a foundational tool to visualize and communicate key data insights in the education domain. The dashboard provides a clear overview that helps educators, students, and project stakeholders understand the basic metrics and progress related to their educational activities or data analysis exercises.
This report answers essential questions such as: What are the main data points or trends observed in the initial phase? How can the information be used to guide further project development or classroom discussions? It is particularly useful for those who are beginning to explore data analysis in education, offering a straightforward and accessible way to engage with data-driven decision-making.
Overall, Clase01 supports users in gaining a quick yet meaningful understanding of their educational data, making it a valuable resource for teaching, learning, and early-stage project presentations within the education sector.
Frequently asked questions about this dashboard
What is the primary purpose of the Clase01 dashboard?
Its primary purpose is to serve as an initial presentation tool for projects or classroom exercises, providing a foundational overview of educational data.
Who is the intended audience for this dashboard?
The dashboard is intended for educators, students, and project stakeholders involved in education and data analysis exercises.
What kind of questions does this dashboard help to answer?
It helps answer questions related to key data points and trends in the early stages of a project or class exercise, guiding further development and discussion.
Want a dashboard like this with your data?
We build a custom version for your business — US$ 50 per page, delivered within 7 calendar days.
Education Power BI templates
Complete projects built by the Excelverton factory: view them live with a free account and download the PBIP as a channel subscriber (1/month) or Pro subscriber (unlimited).
Create your free account
Save favorites, build collections and use the AI assistant — at no cost.