AIRPORT ANALYSIS POWERBI PROJECT
This report analyzes airport data, including passenger traffic and flight operations.
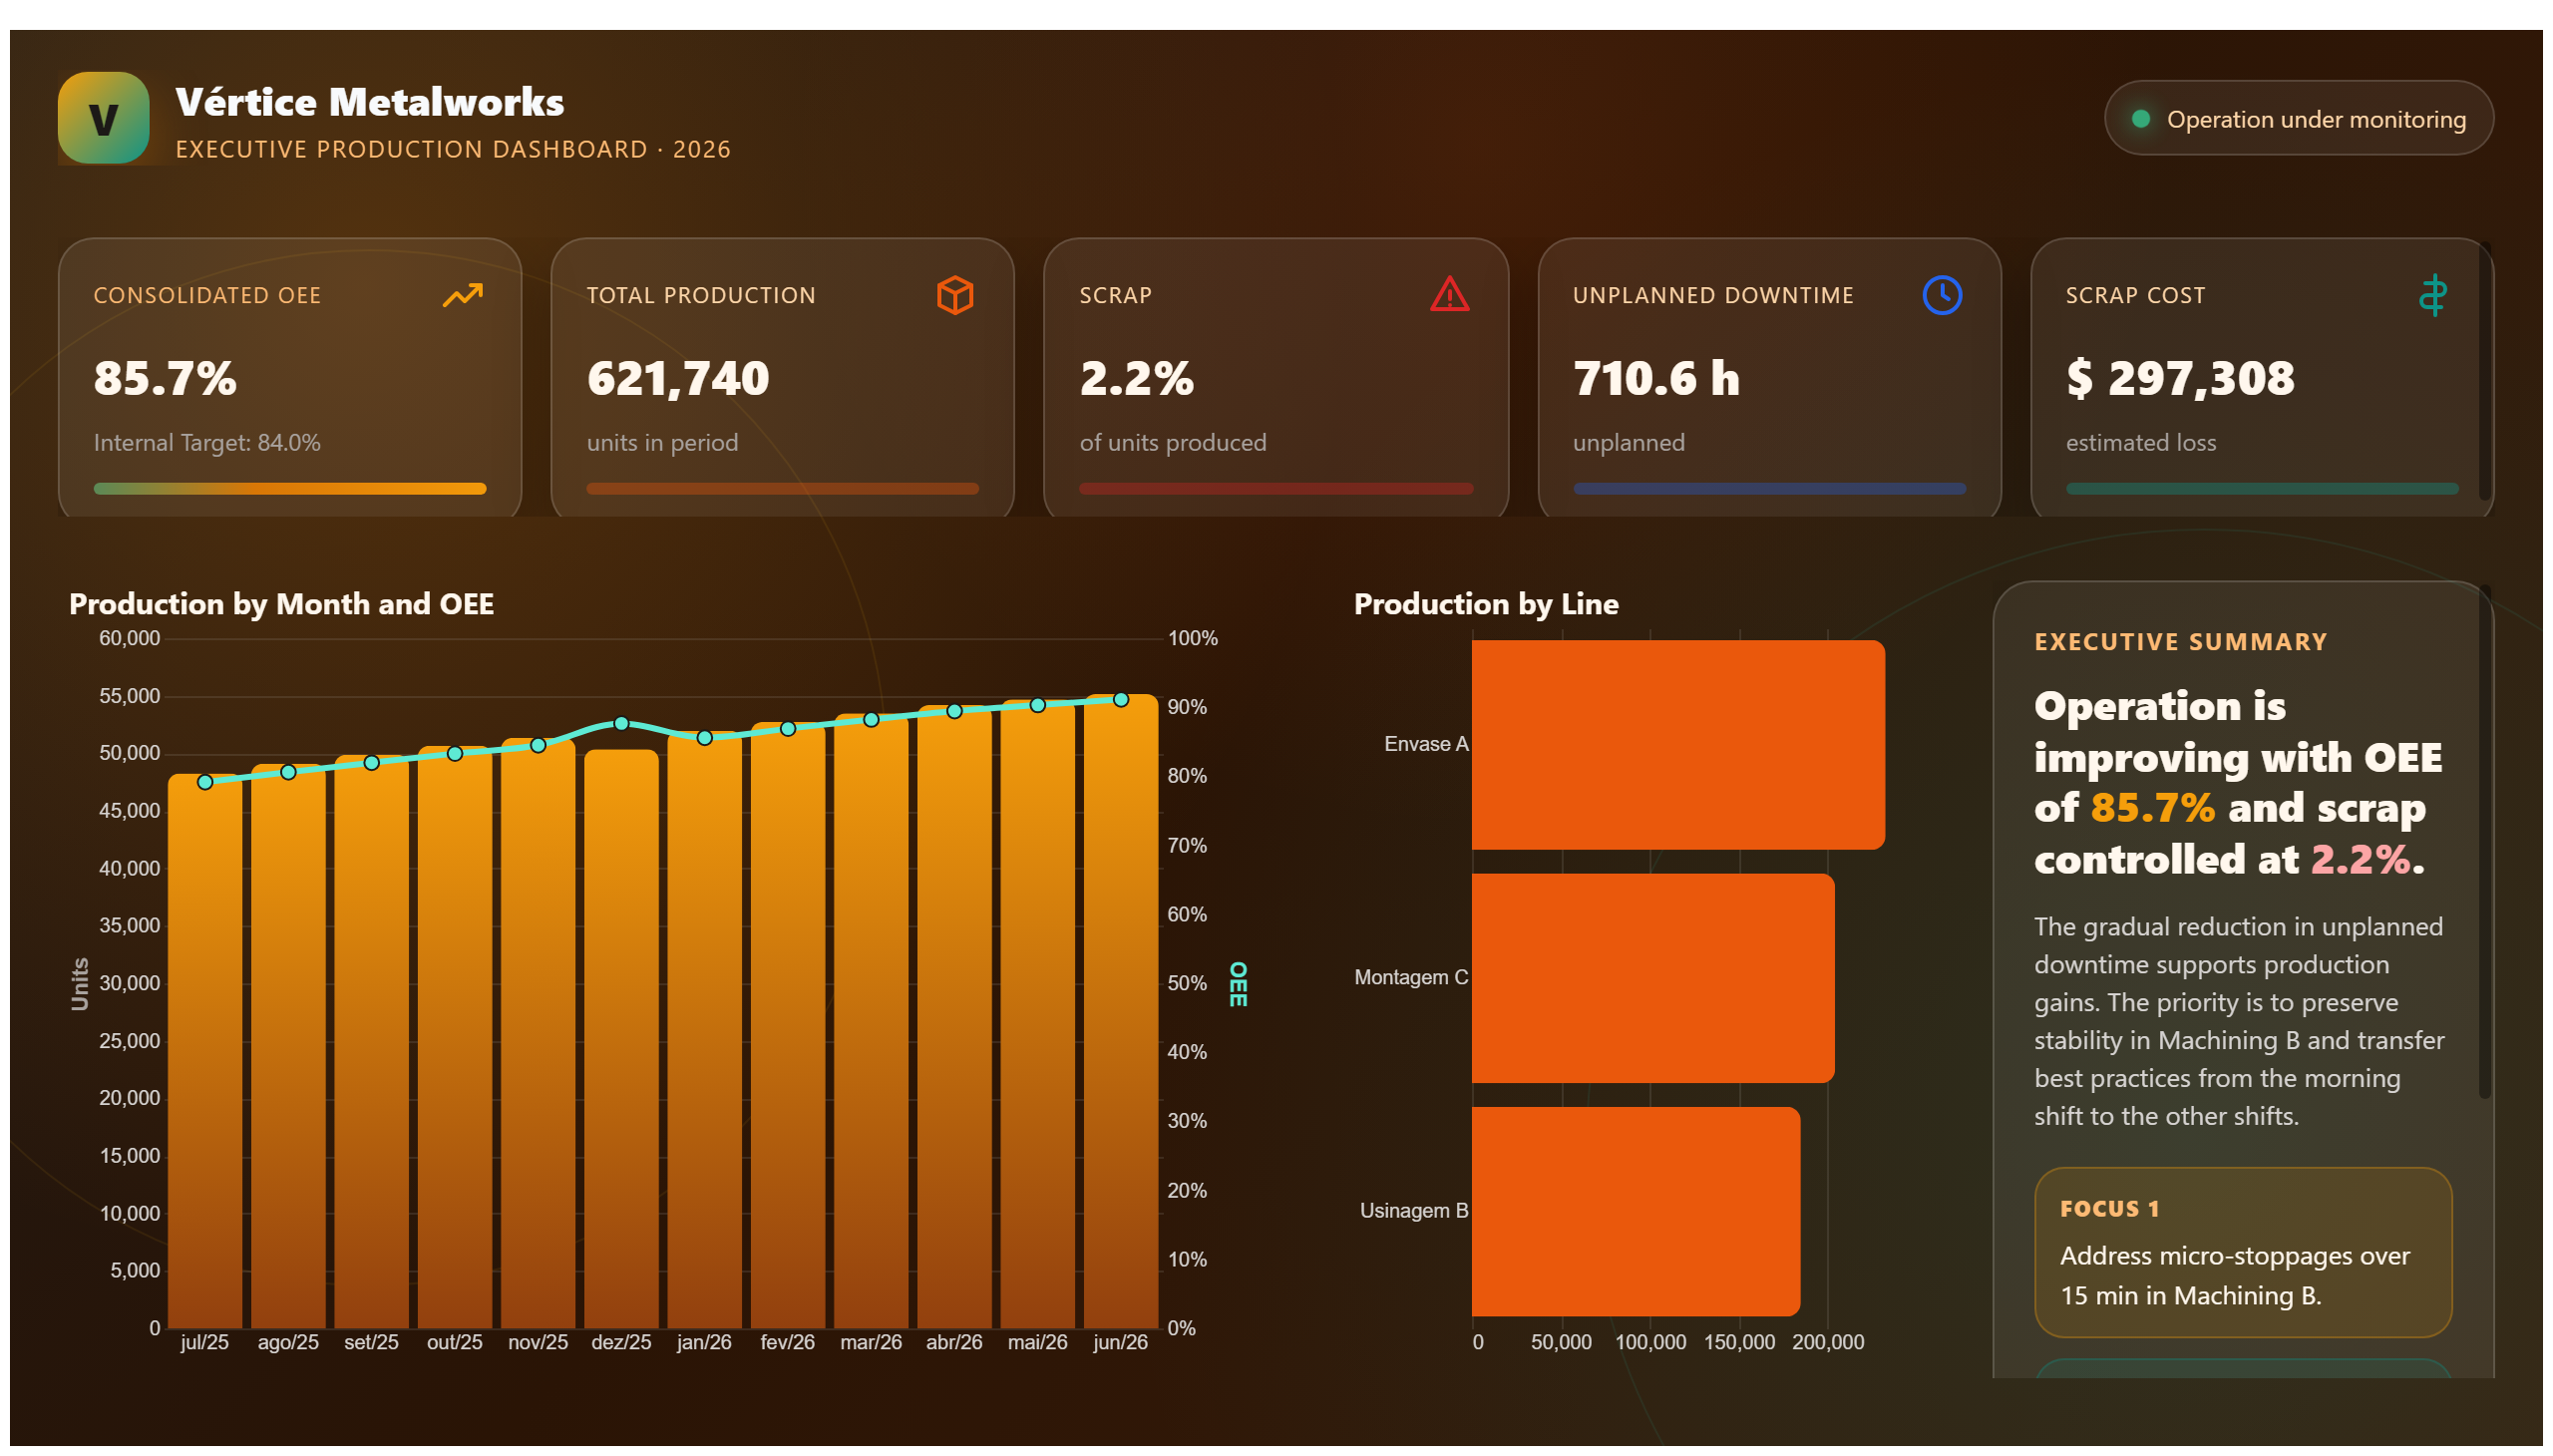
This report provides information about production, possibly in a factory or industry.
Save your favorite dashboards, get new templates by area and ask the AI assistant — for free.
This is a free Power BI dashboard called Manufacturing Dashboard, in the Operações domain. Explore KPIs, interactive visualizations and get inspired for your own data and business intelligence projects.
This report provides information about production, possibly in a factory or industry.
The Dashboard of Manufacturing offers a comprehensive overview of production metrics within a factory or industrial setting. It consolidates key data points related to manufacturing processes, enabling users to monitor production volumes, efficiency, and potential bottlenecks in real time. This dashboard is designed to provide actionable insights that help optimize operational performance and resource allocation.
By visualizing trends and comparing production outputs over time, the dashboard answers critical business questions such as: Are production targets being met? Where are inefficiencies occurring in the manufacturing line? How do different shifts or machines perform relative to each other? These insights support decision-makers in identifying areas for improvement and making data-driven adjustments to enhance productivity.
This report is particularly valuable for production managers, operations analysts, and industrial engineers who require a clear and concise view of manufacturing performance. It facilitates strategic planning and daily operational oversight, ensuring that manufacturing goals align with overall business objectives.
The dashboard displays key production metrics such as output volume, efficiency rates, and performance comparisons across different shifts or machinery.
The dashboard is primarily intended for production managers, operations analysts, and industrial engineers involved in monitoring and optimizing manufacturing processes.
By highlighting production trends and identifying bottlenecks or underperforming areas, the dashboard enables users to make informed decisions to streamline operations and increase overall efficiency.
We build a custom version for your business — US$ 50 per page, delivered within 7 calendar days.
Explore more Power BI dashboards from the same domain to compare KPIs, layouts and analytics models.
This report analyzes airport data, including passenger traffic and flight operations.
This report analyzes HelpDesk performance, including resolution metrics and customer satisfaction.
This report provides detailed football analytics, including game statistics and player performance.
This project addresses general aspects of management in the hospitality domain.
Complete projects built by the Excelverton factory: view them live and download the PBIP — 1 free downloads every 30 days with a free account, unlimited on Pro.
Save favorites, build collections and use the AI assistant — at no cost.