Global_Education_updated
Updated report on global education, focusing on spending and educational outcomes in various regions.
Create a free account
Save your favorite dashboards, get new templates by area and ask the AI assistant — for free.
About the Global_Education_updated dashboard
This is a free Power BI dashboard called Global_Education_updated, in the Educação domain. Explore KPIs, interactive visualizations and get inspired for your own data and business intelligence projects.
Updated report on global education, focusing on spending and educational outcomes in various regions.
Dashboard analysis
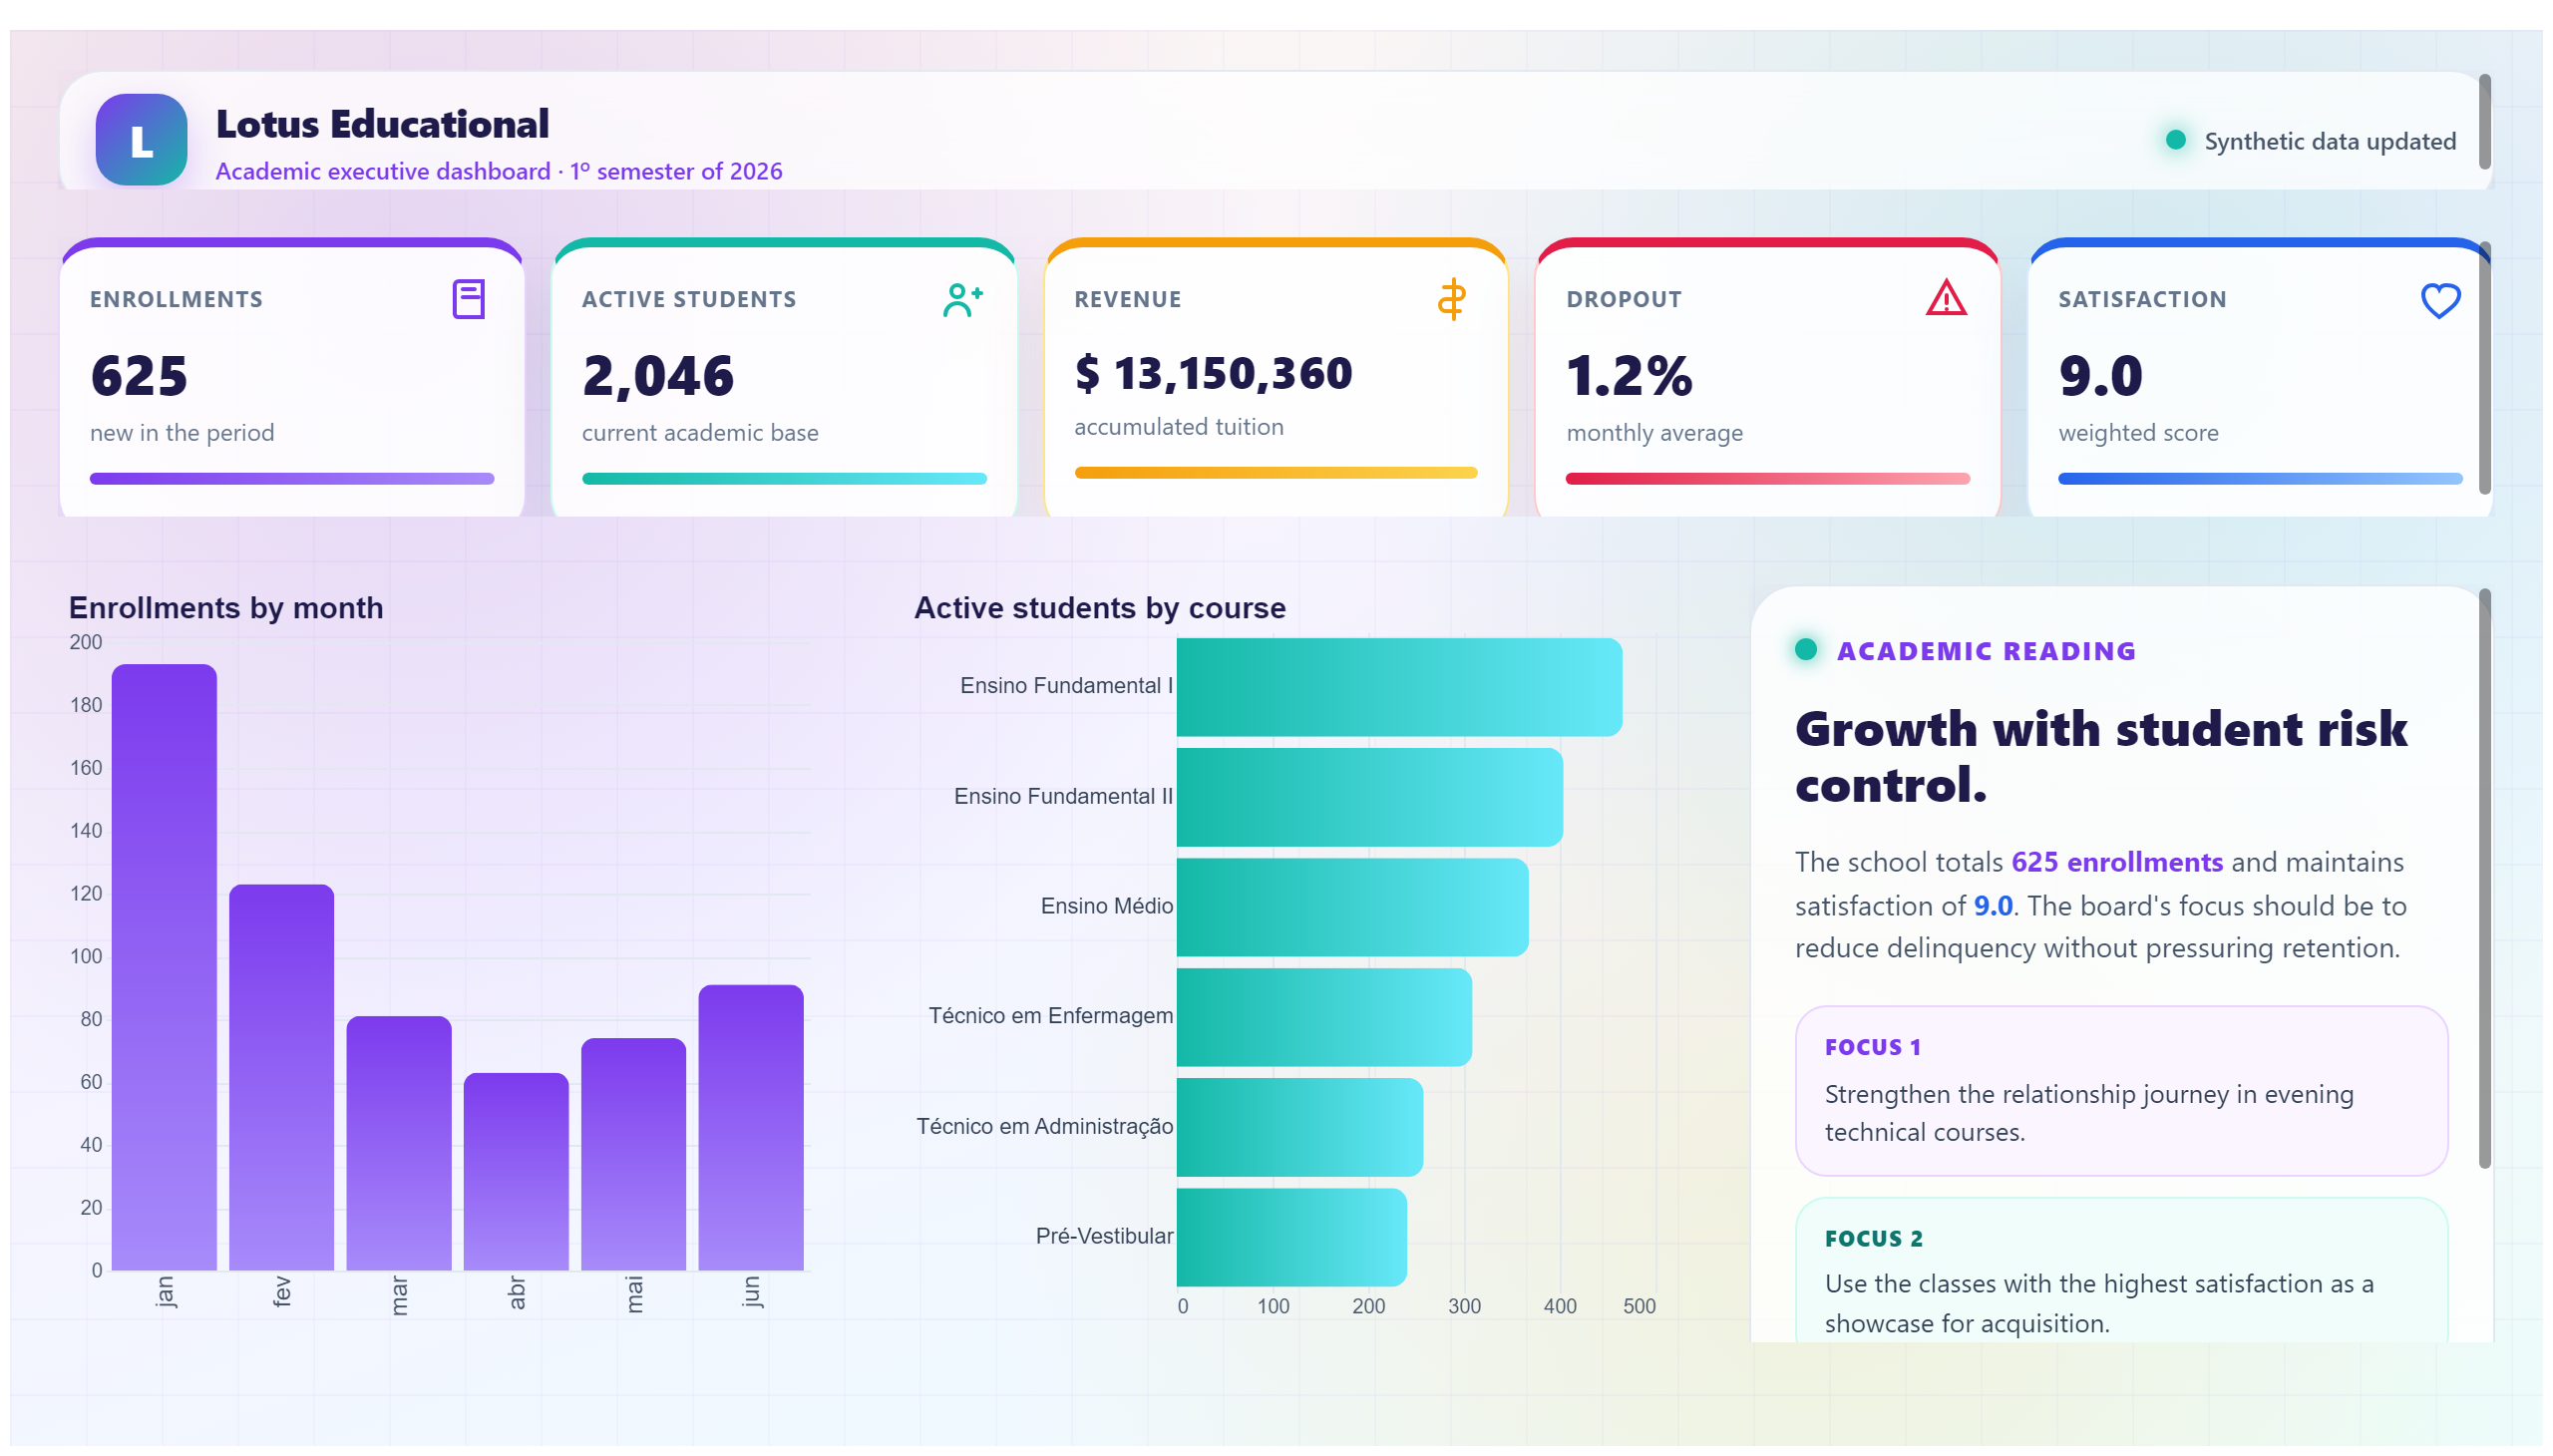
This updated Global Education dashboard provides a comprehensive overview of educational spending and outcomes across various regions worldwide. It visualizes key metrics such as investment levels in education and their correlation with performance indicators, enabling users to understand how resources are allocated and the impact they have on educational results.
The dashboard answers critical business questions like: Which regions invest the most in education? How do spending patterns relate to student performance? Are there disparities in educational outcomes despite similar funding levels? By addressing these queries, the report supports policymakers, educational administrators, and analysts aiming to optimize resource allocation and improve education systems globally.
Designed for stakeholders in the education sector, this dashboard facilitates data-driven decision-making by highlighting trends and regional comparisons. It serves as a valuable tool for those seeking to benchmark educational investments and outcomes, identify areas needing attention, and ultimately enhance the quality and equity of education worldwide.
Frequently asked questions about this dashboard
What regions are covered in the Global Education dashboard?
The dashboard covers multiple global regions, providing comparative data on educational spending and outcomes across these areas.
Does the dashboard show the relationship between education spending and student performance?
Yes, it highlights correlations between investment levels and educational results to help understand the effectiveness of spending.
Who is the primary audience for this dashboard?
The dashboard is intended for policymakers, educational administrators, and analysts focused on improving education through data-driven insights.
Want a dashboard like this with your data?
We build a custom version for your business — US$ 50 per page, delivered within 7 calendar days.
Education Power BI templates
Complete projects built by the Excelverton factory: view them live with a free account and download the PBIP as a channel subscriber (1/month) or Pro subscriber (unlimited).
Create your free account
Save favorites, build collections and use the AI assistant — at no cost.