Anemia_Dataset_BI_Report
Report on anemia, possibly analyzing public health data.
Create a free account
Save your favorite dashboards, get new templates by area and ask the AI assistant — for free.
About the Anemia_Dataset_BI_Report dashboard
This is a free Power BI dashboard called Anemia_Dataset_BI_Report, in the Saúde domain. Explore KPIs, interactive visualizations and get inspired for your own data and business intelligence projects.
Report on anemia, possibly analyzing public health data.
Dashboard analysis
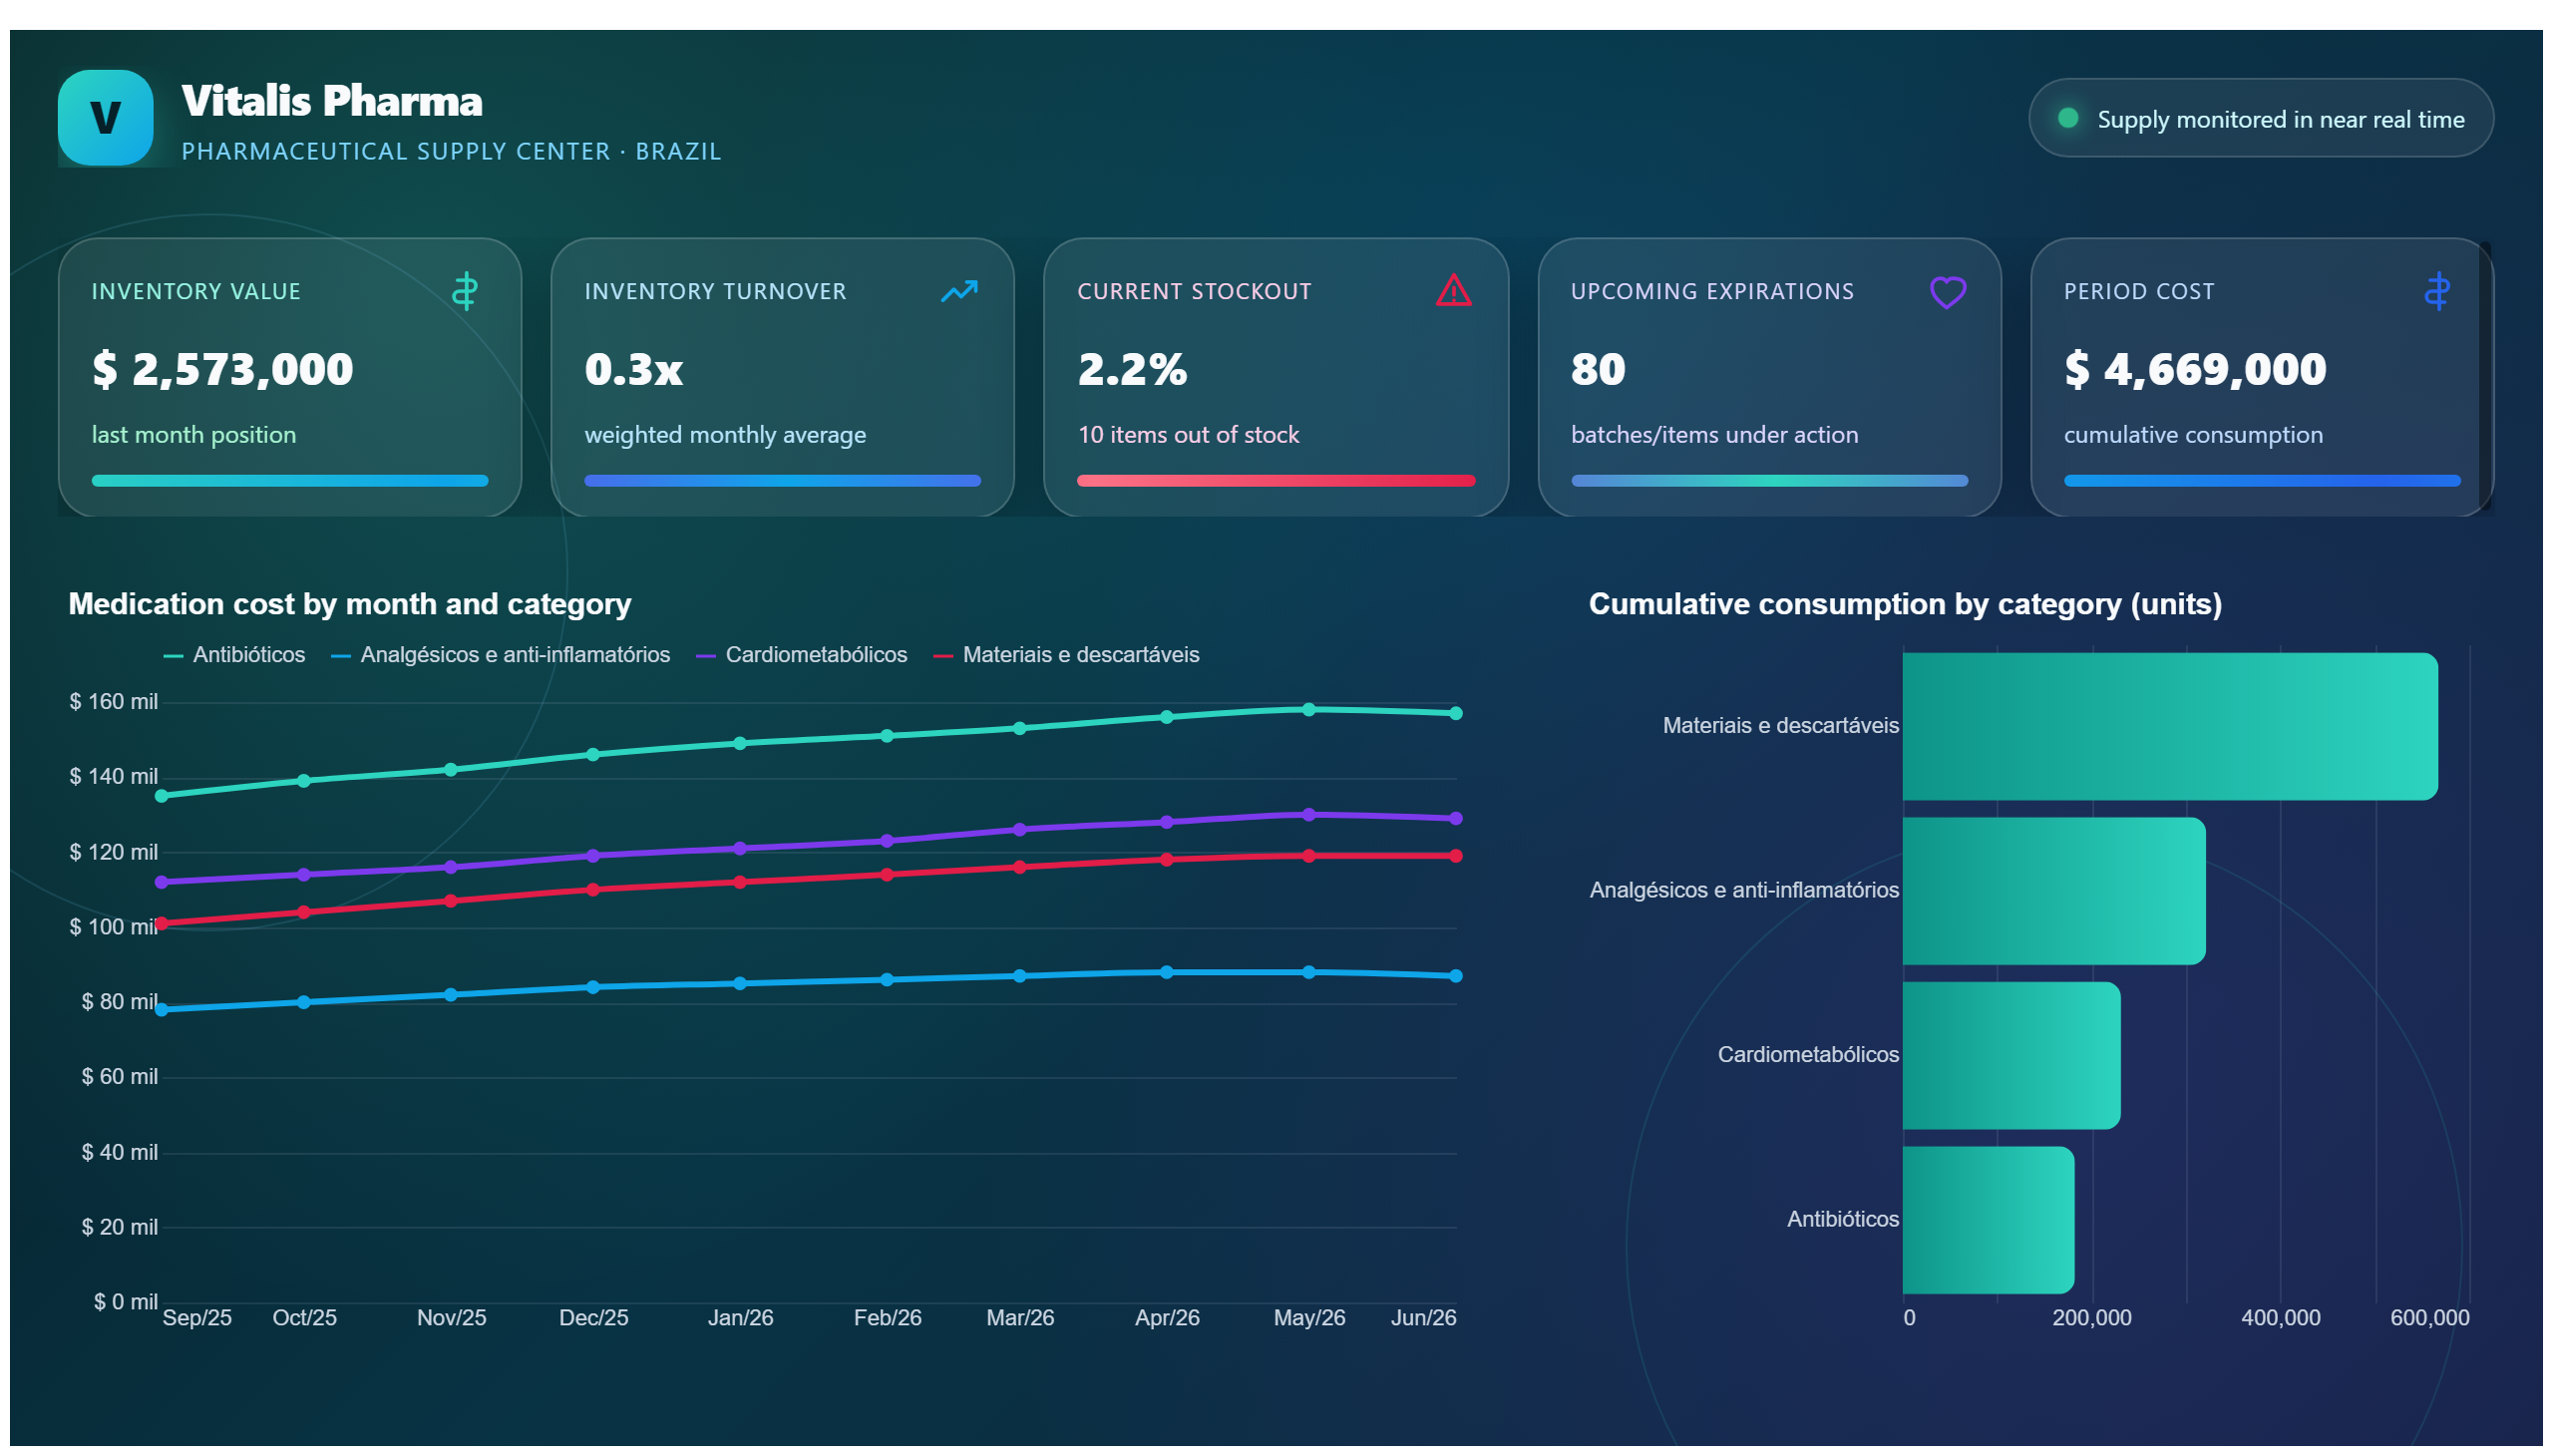
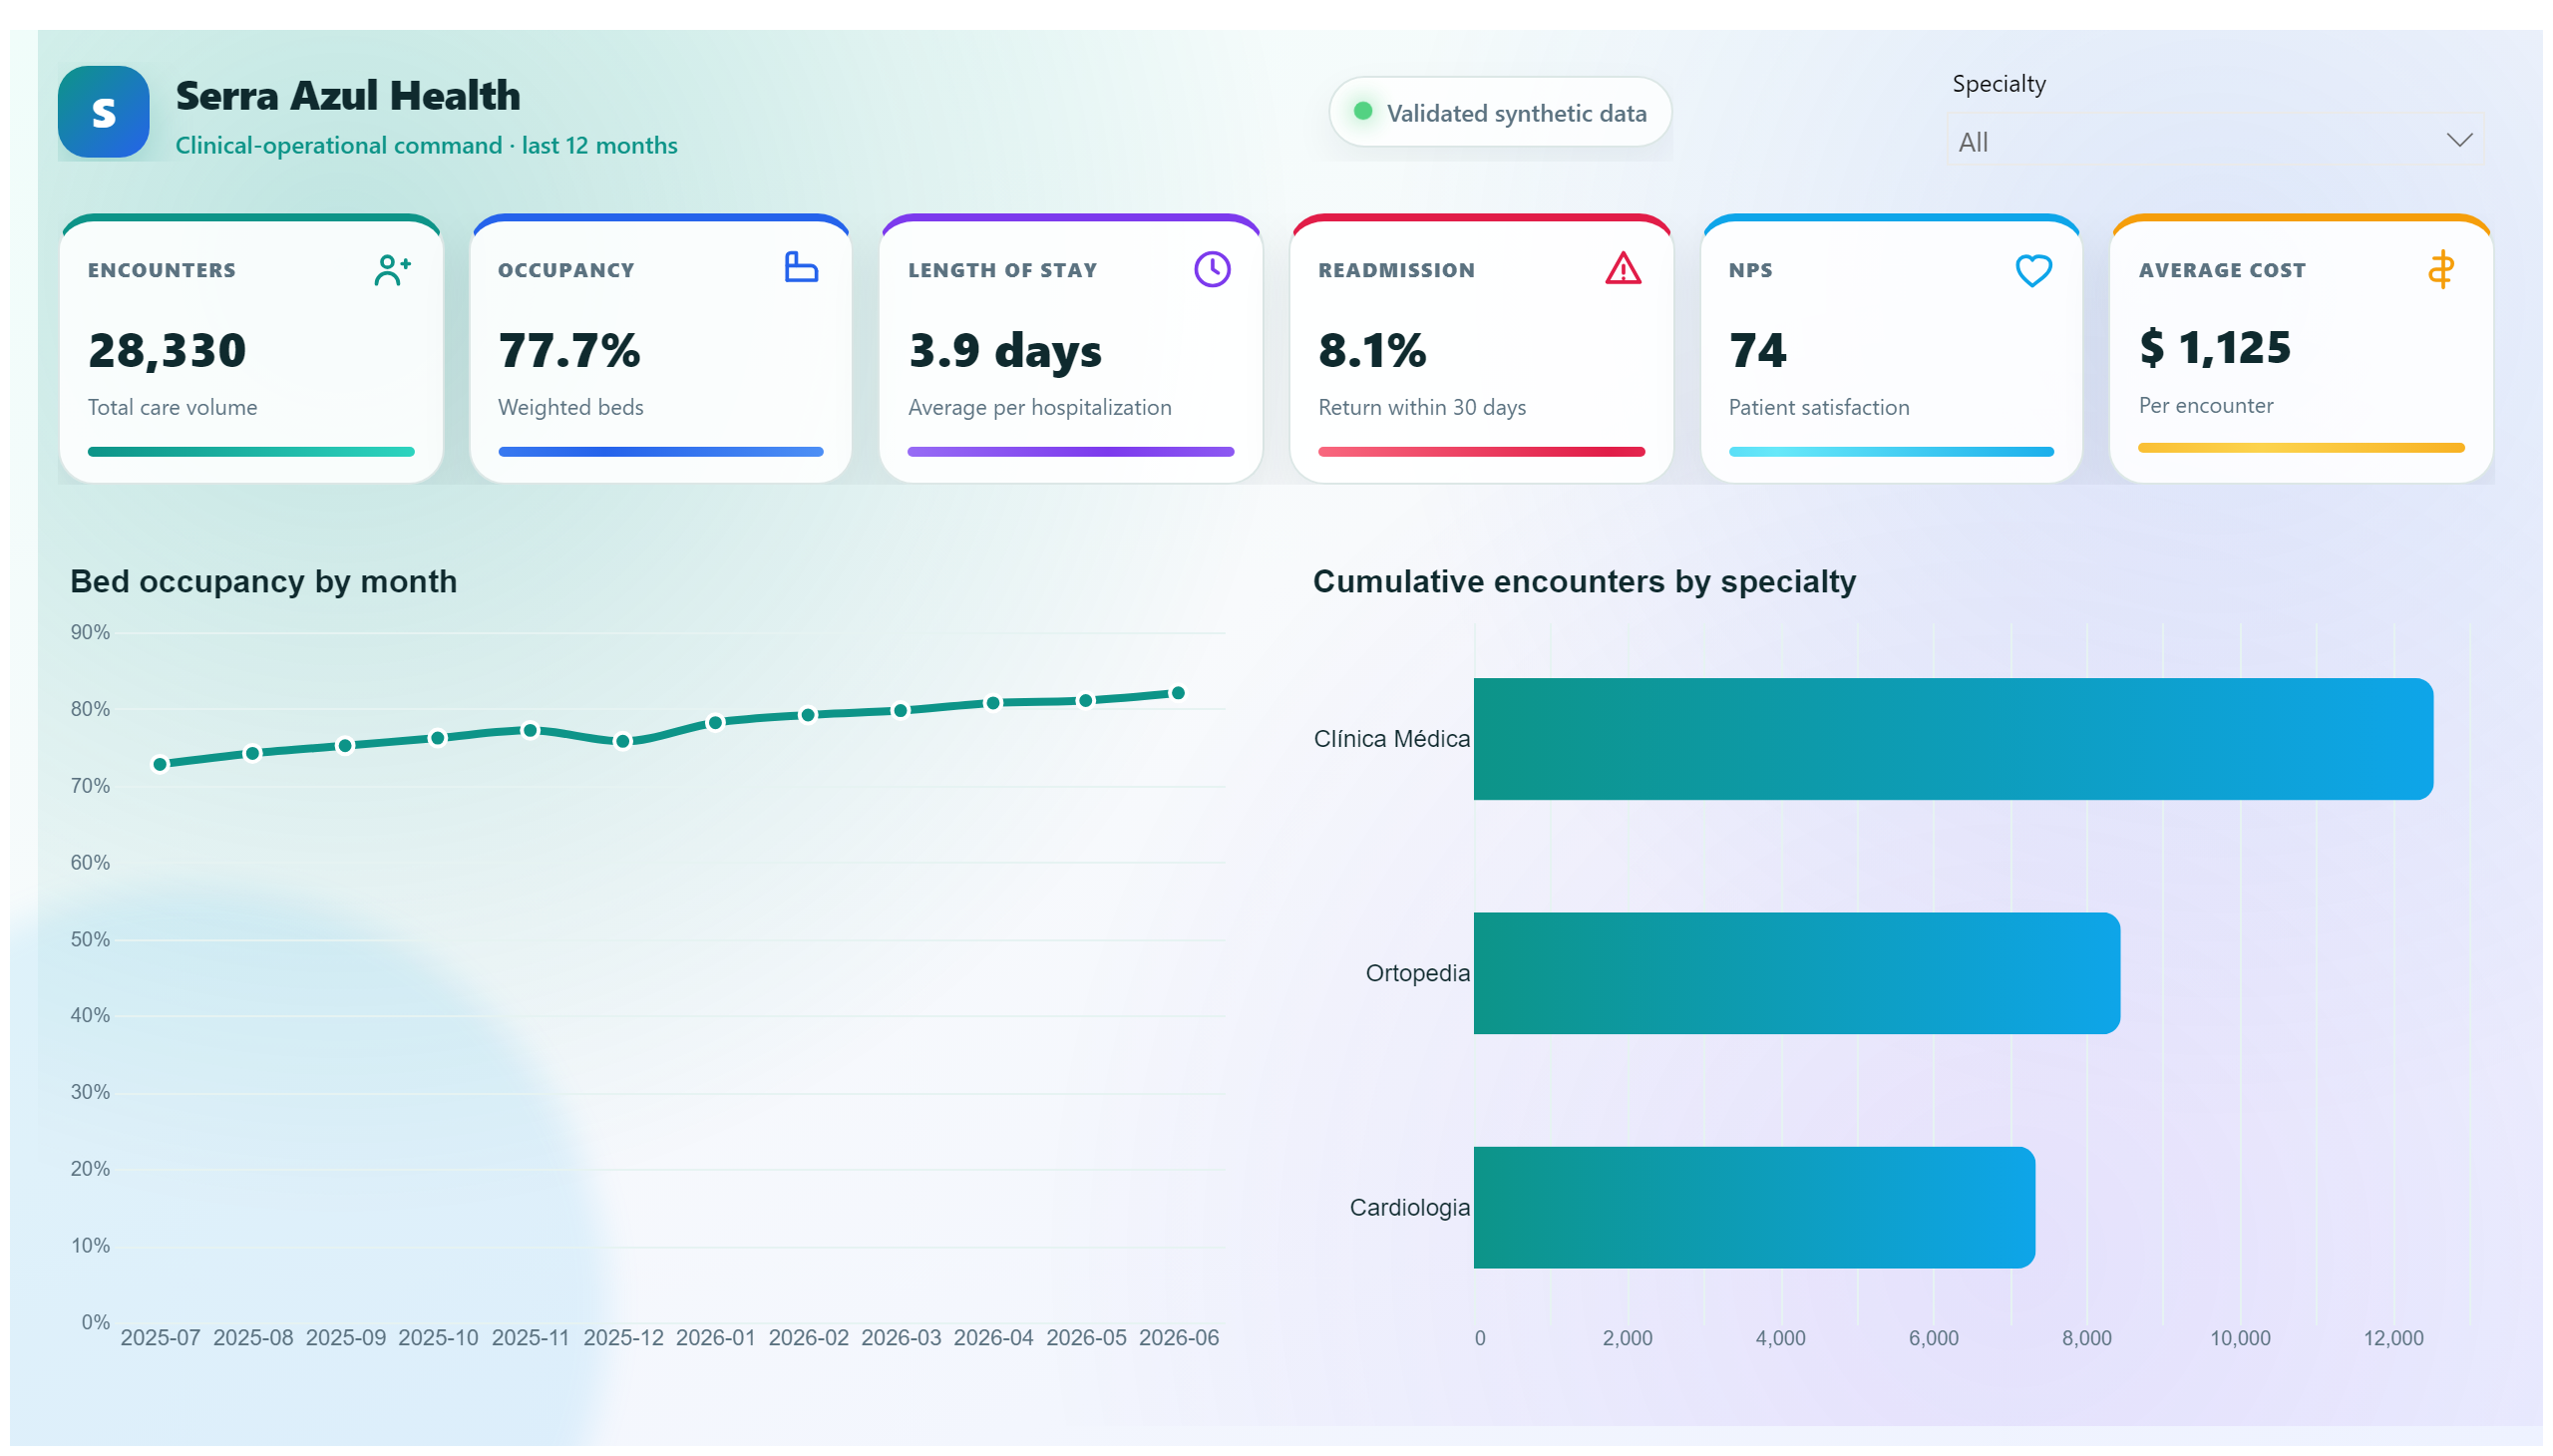
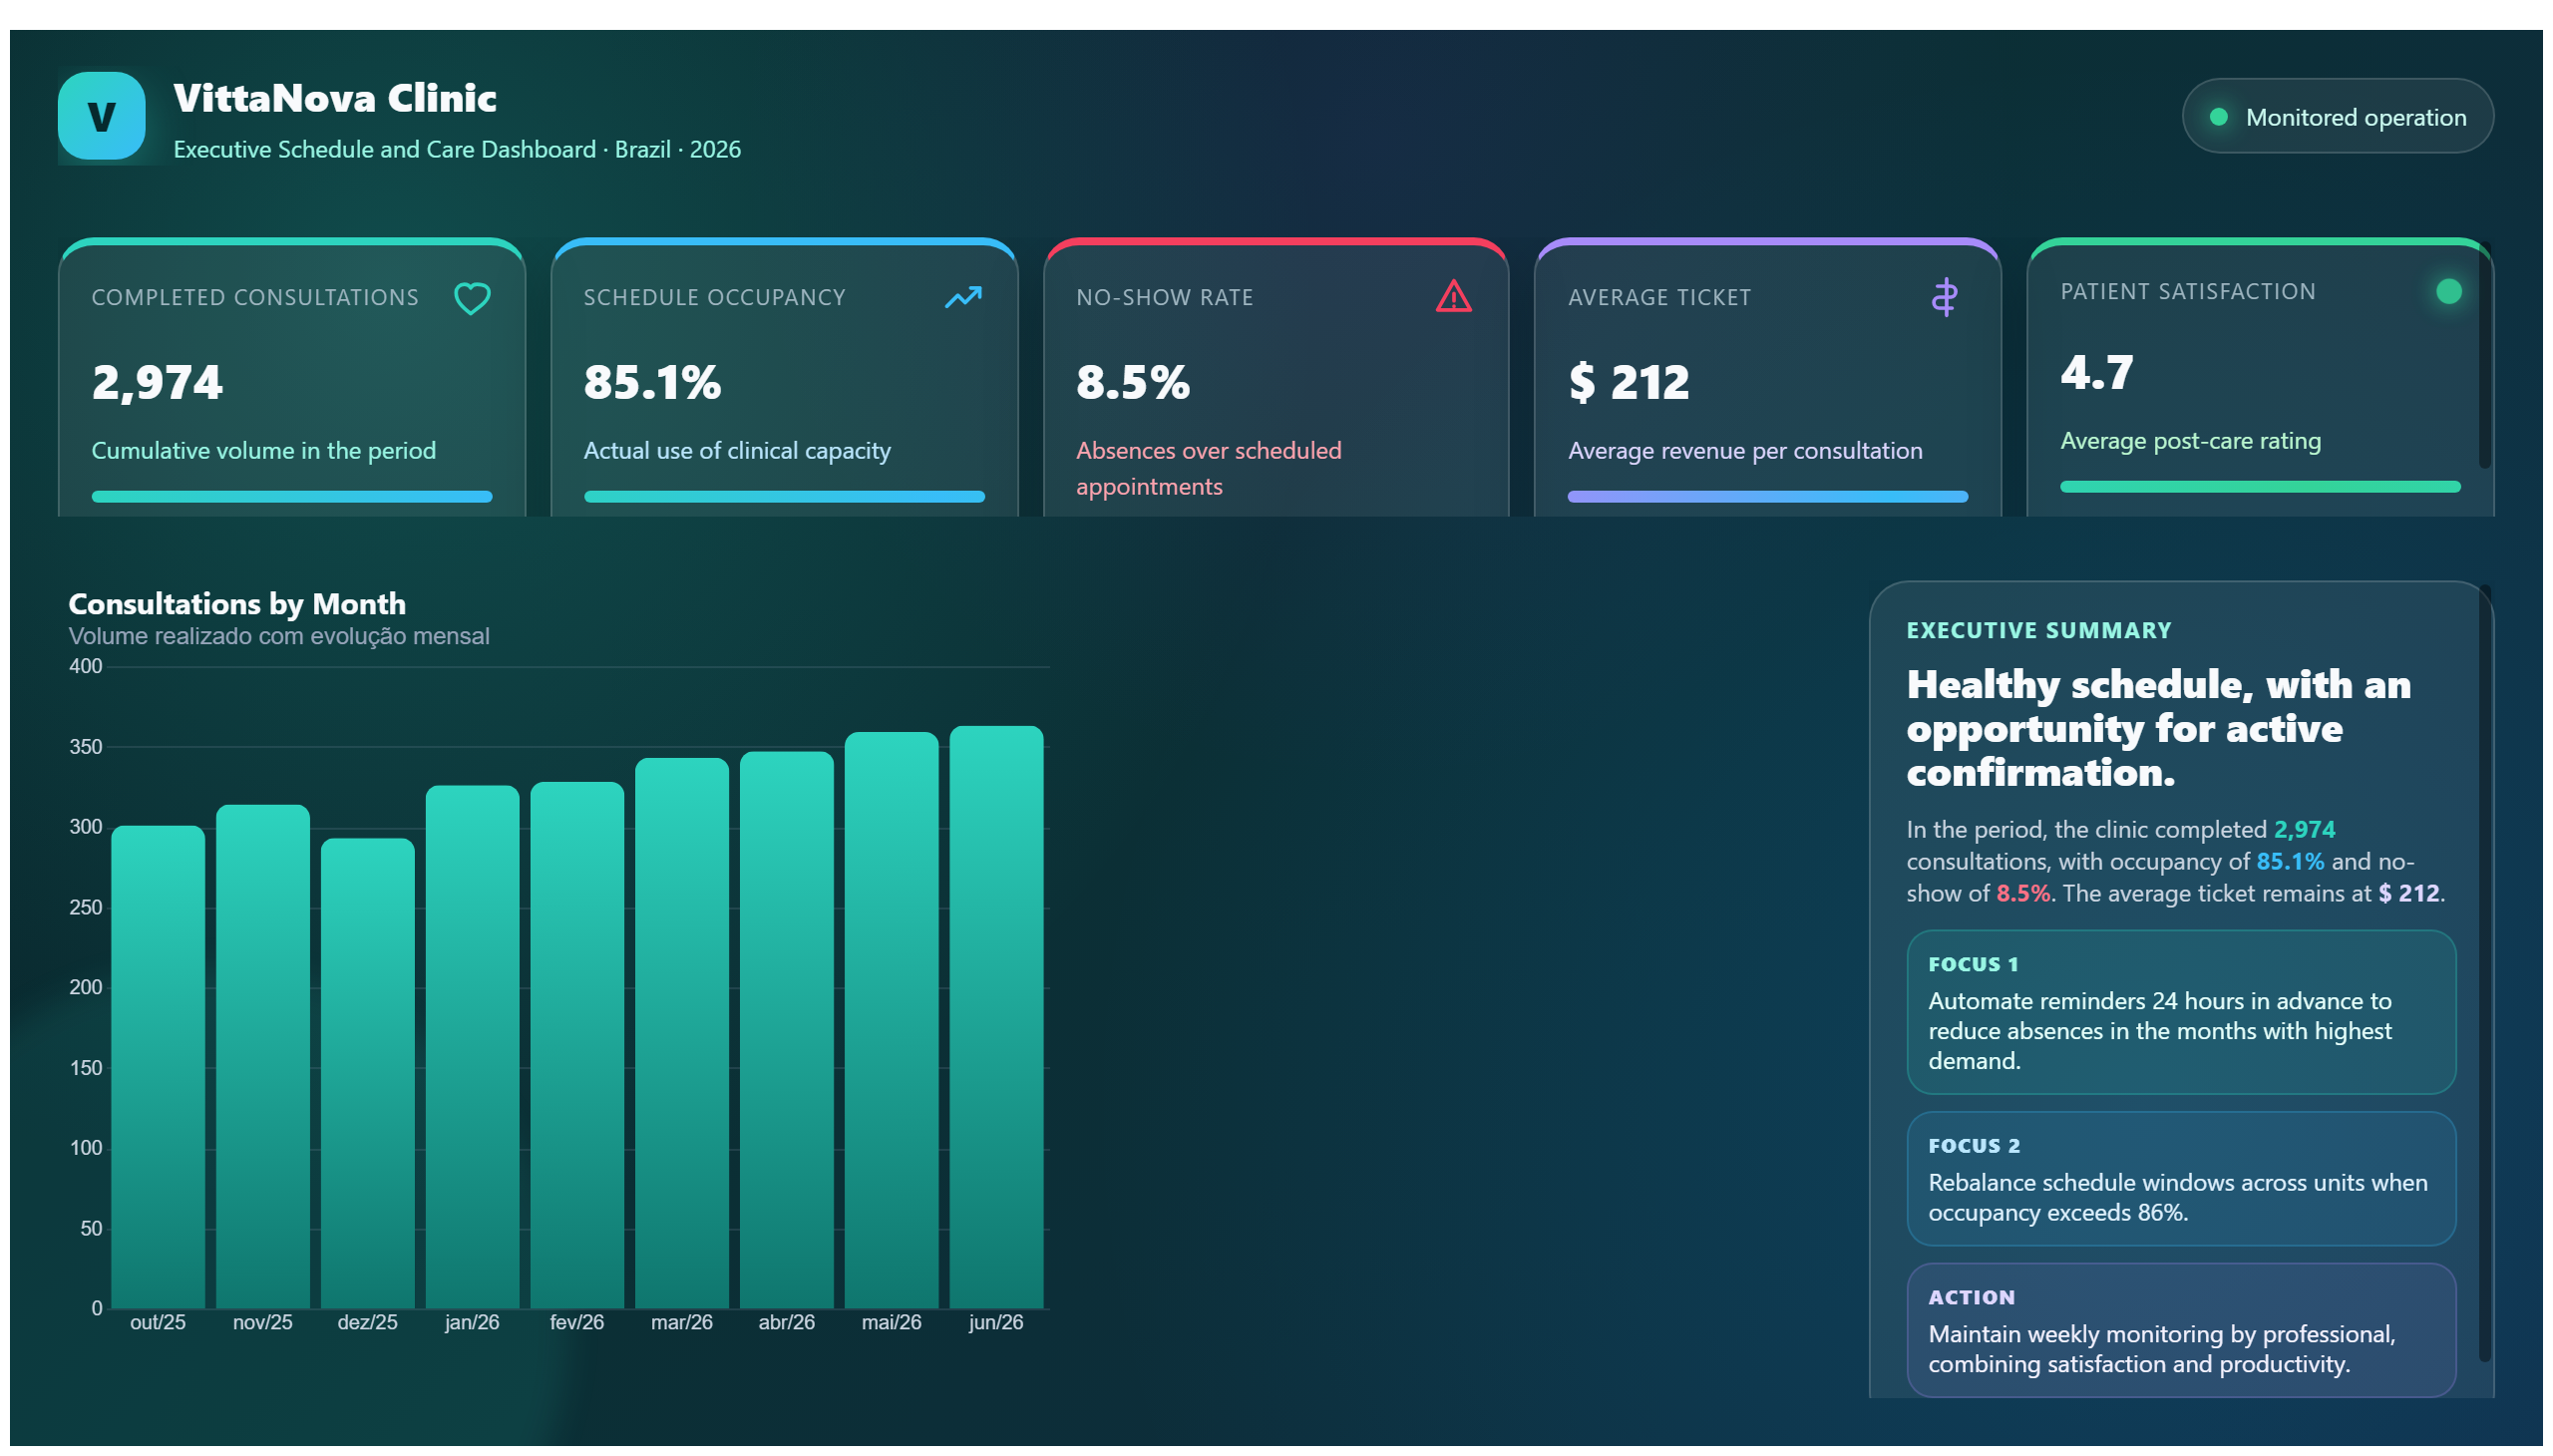
This dashboard, titled Anemia_Dataset_BI_Report, provides a comprehensive analysis of anemia-related data, likely sourced from public health records. It offers insights into the prevalence and distribution of anemia across different demographics, enabling health professionals to identify high-risk groups and monitor trends over time. The visualizations help in understanding the severity and impact of anemia within populations, facilitating targeted interventions.
The report addresses key business questions such as: Which regions or age groups exhibit the highest rates of anemia? How do anemia rates vary by gender or socioeconomic status? What temporal trends can be observed in anemia incidence? By answering these questions, the dashboard serves public health officials, policymakers, and healthcare providers aiming to improve anemia diagnosis, prevention, and treatment strategies.
Overall, this dashboard is a valuable tool for stakeholders in the health domain who require data-driven insights to allocate resources effectively and design impactful health programs to combat anemia.
Frequently asked questions about this dashboard
What demographic factors does the dashboard analyze in relation to anemia?
The dashboard examines anemia prevalence across various demographics such as age groups, gender, and potentially socioeconomic status.
Can this dashboard track anemia trends over time?
Yes, it includes temporal analyses that allow users to observe changes in anemia rates across different periods.
Who is the primary audience for this anemia report?
The primary users are public health officials, policymakers, and healthcare providers focused on anemia prevention and treatment.
Want a dashboard like this with your data?
We build a custom version for your business — US$ 50 per page, delivered within 7 calendar days.
Healthcare Power BI templates
Complete projects built by the Excelverton factory: view them live with a free account and download the PBIP as a channel subscriber (1/month) or Pro subscriber (unlimited).
Create your free account
Save favorites, build collections and use the AI assistant — at no cost.