3-3-power-bi-course-complete
This report is a complete version of a course on Power BI, covering practical topics.
Create a free account
Save your favorite dashboards, get new templates by area and ask the AI assistant — for free.
About the 3-3-power-bi-course-complete dashboard
This is a free Power BI dashboard called 3-3-power-bi-course-complete, in the Educação domain. Explore KPIs, interactive visualizations and get inspired for your own data and business intelligence projects.
This report is a complete version of a course on Power BI, covering practical topics.
Dashboard analysis
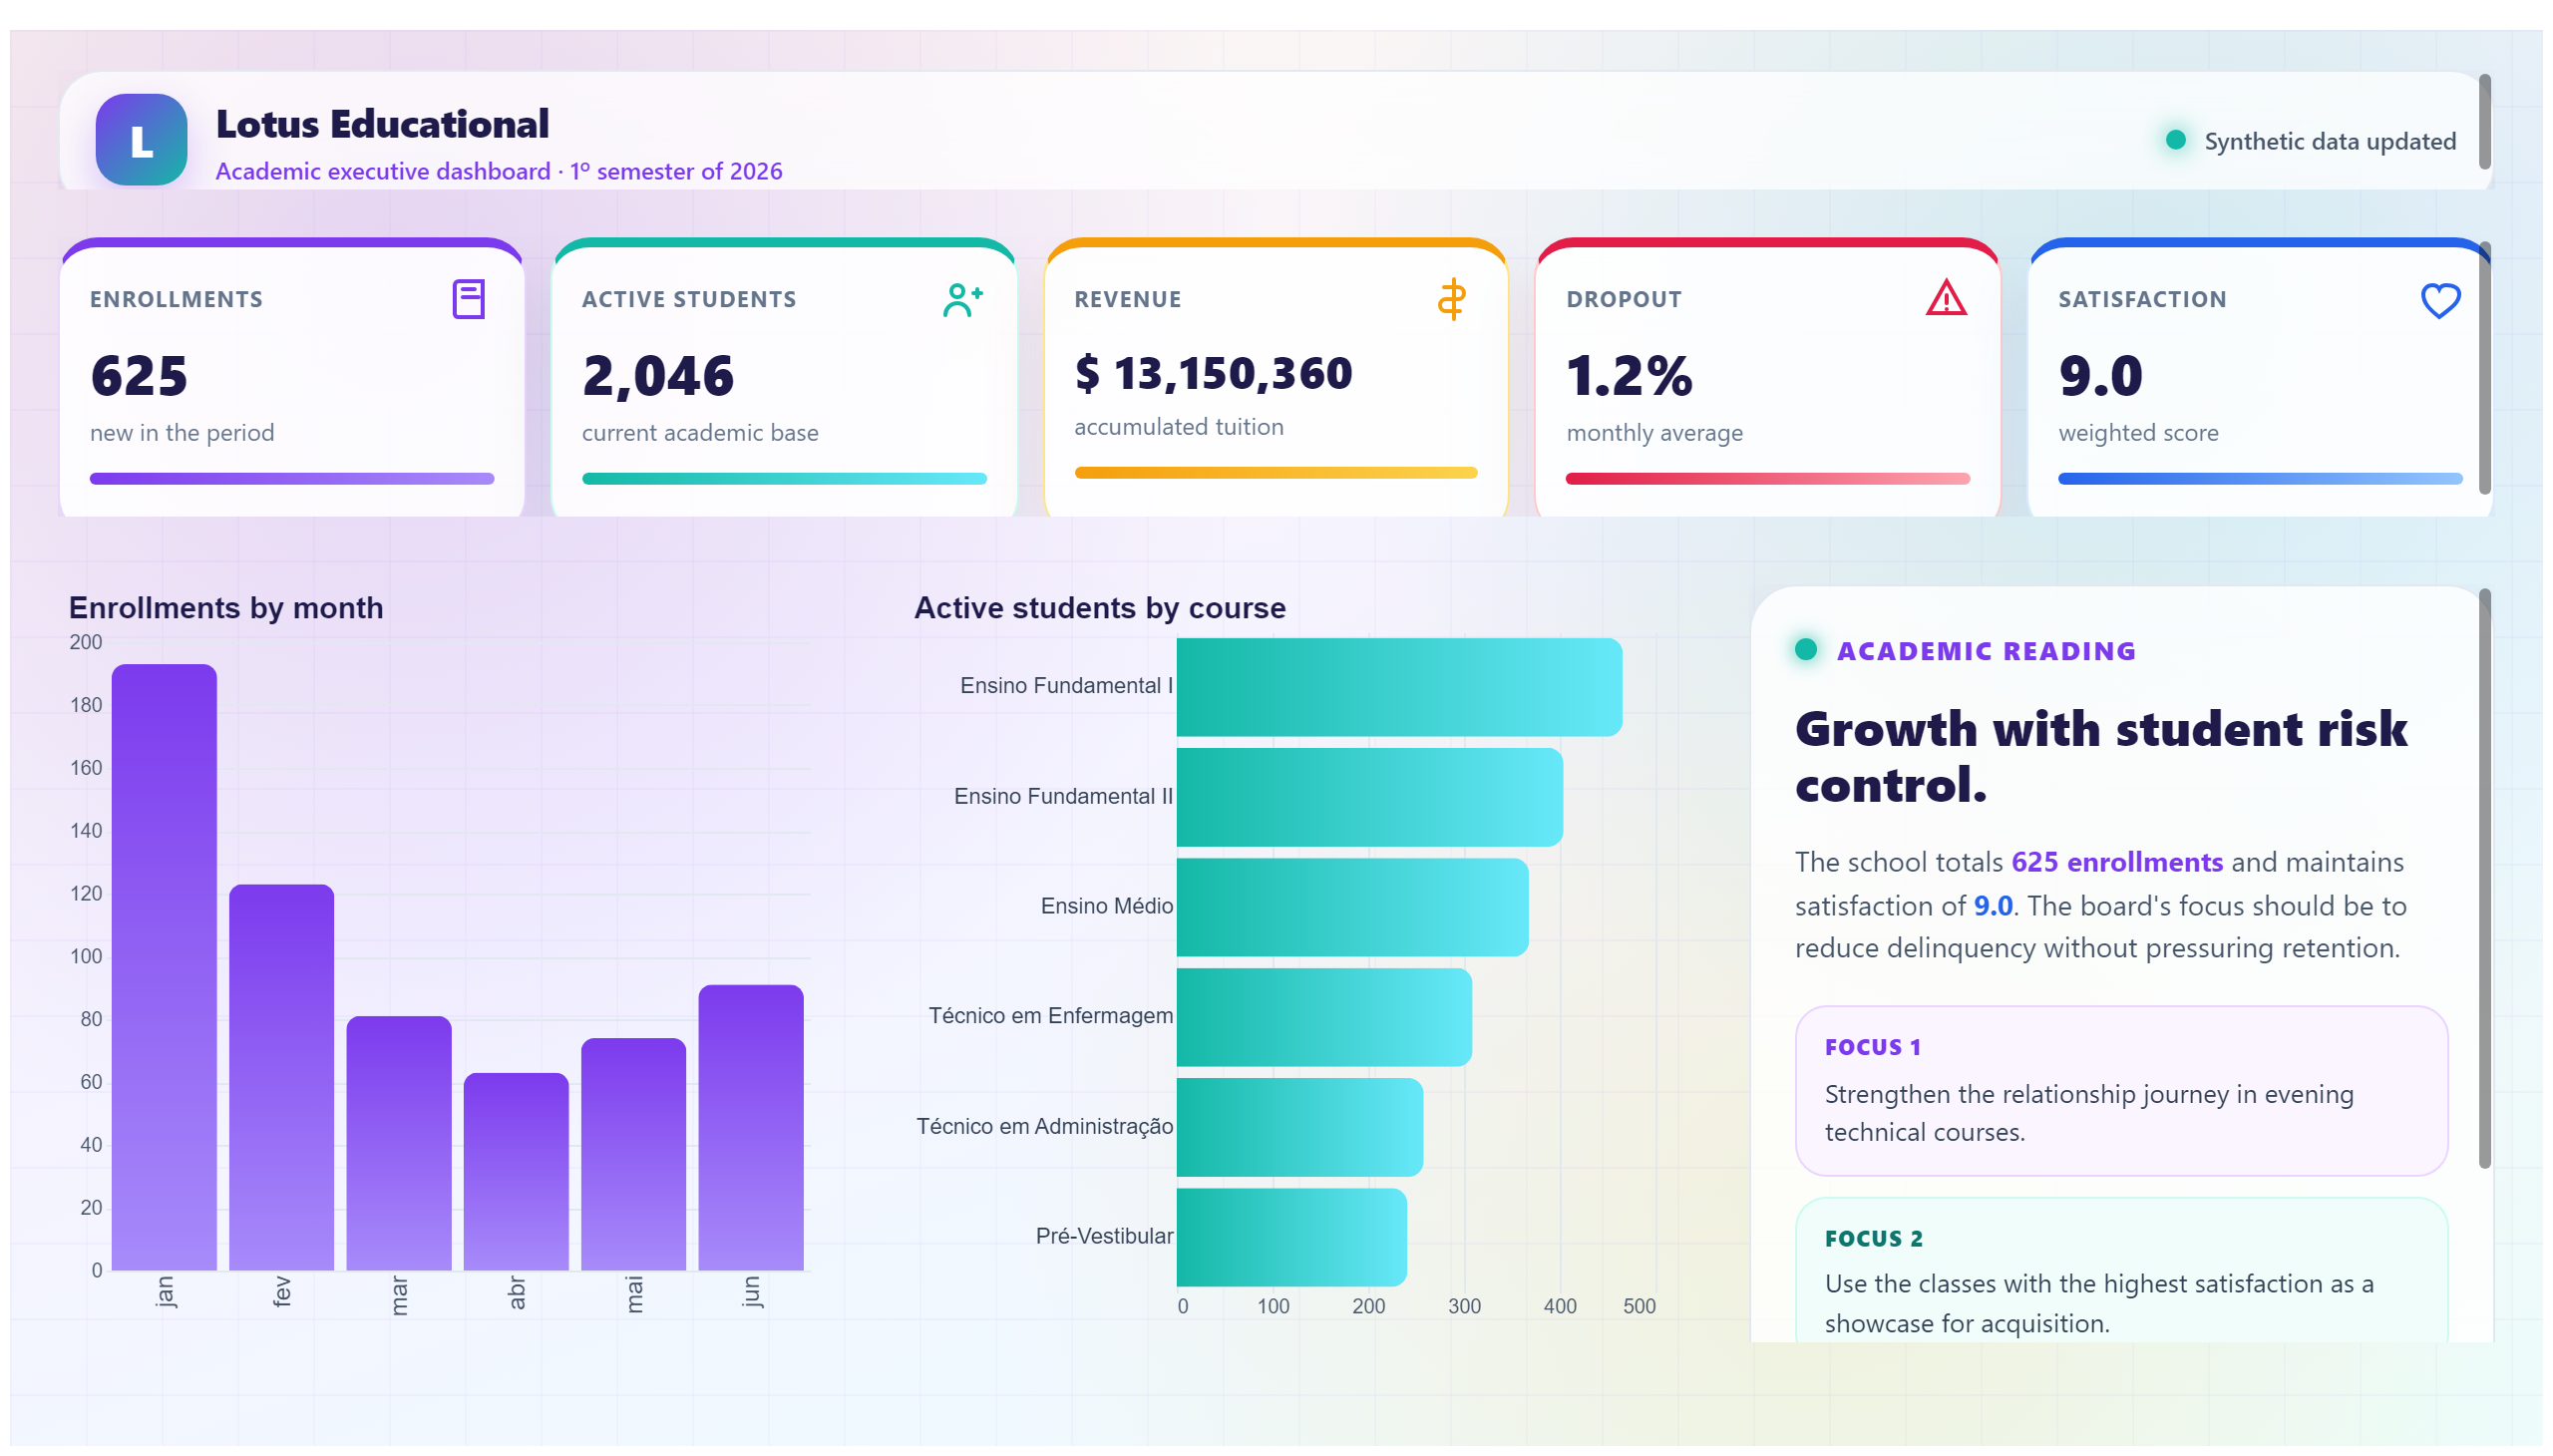
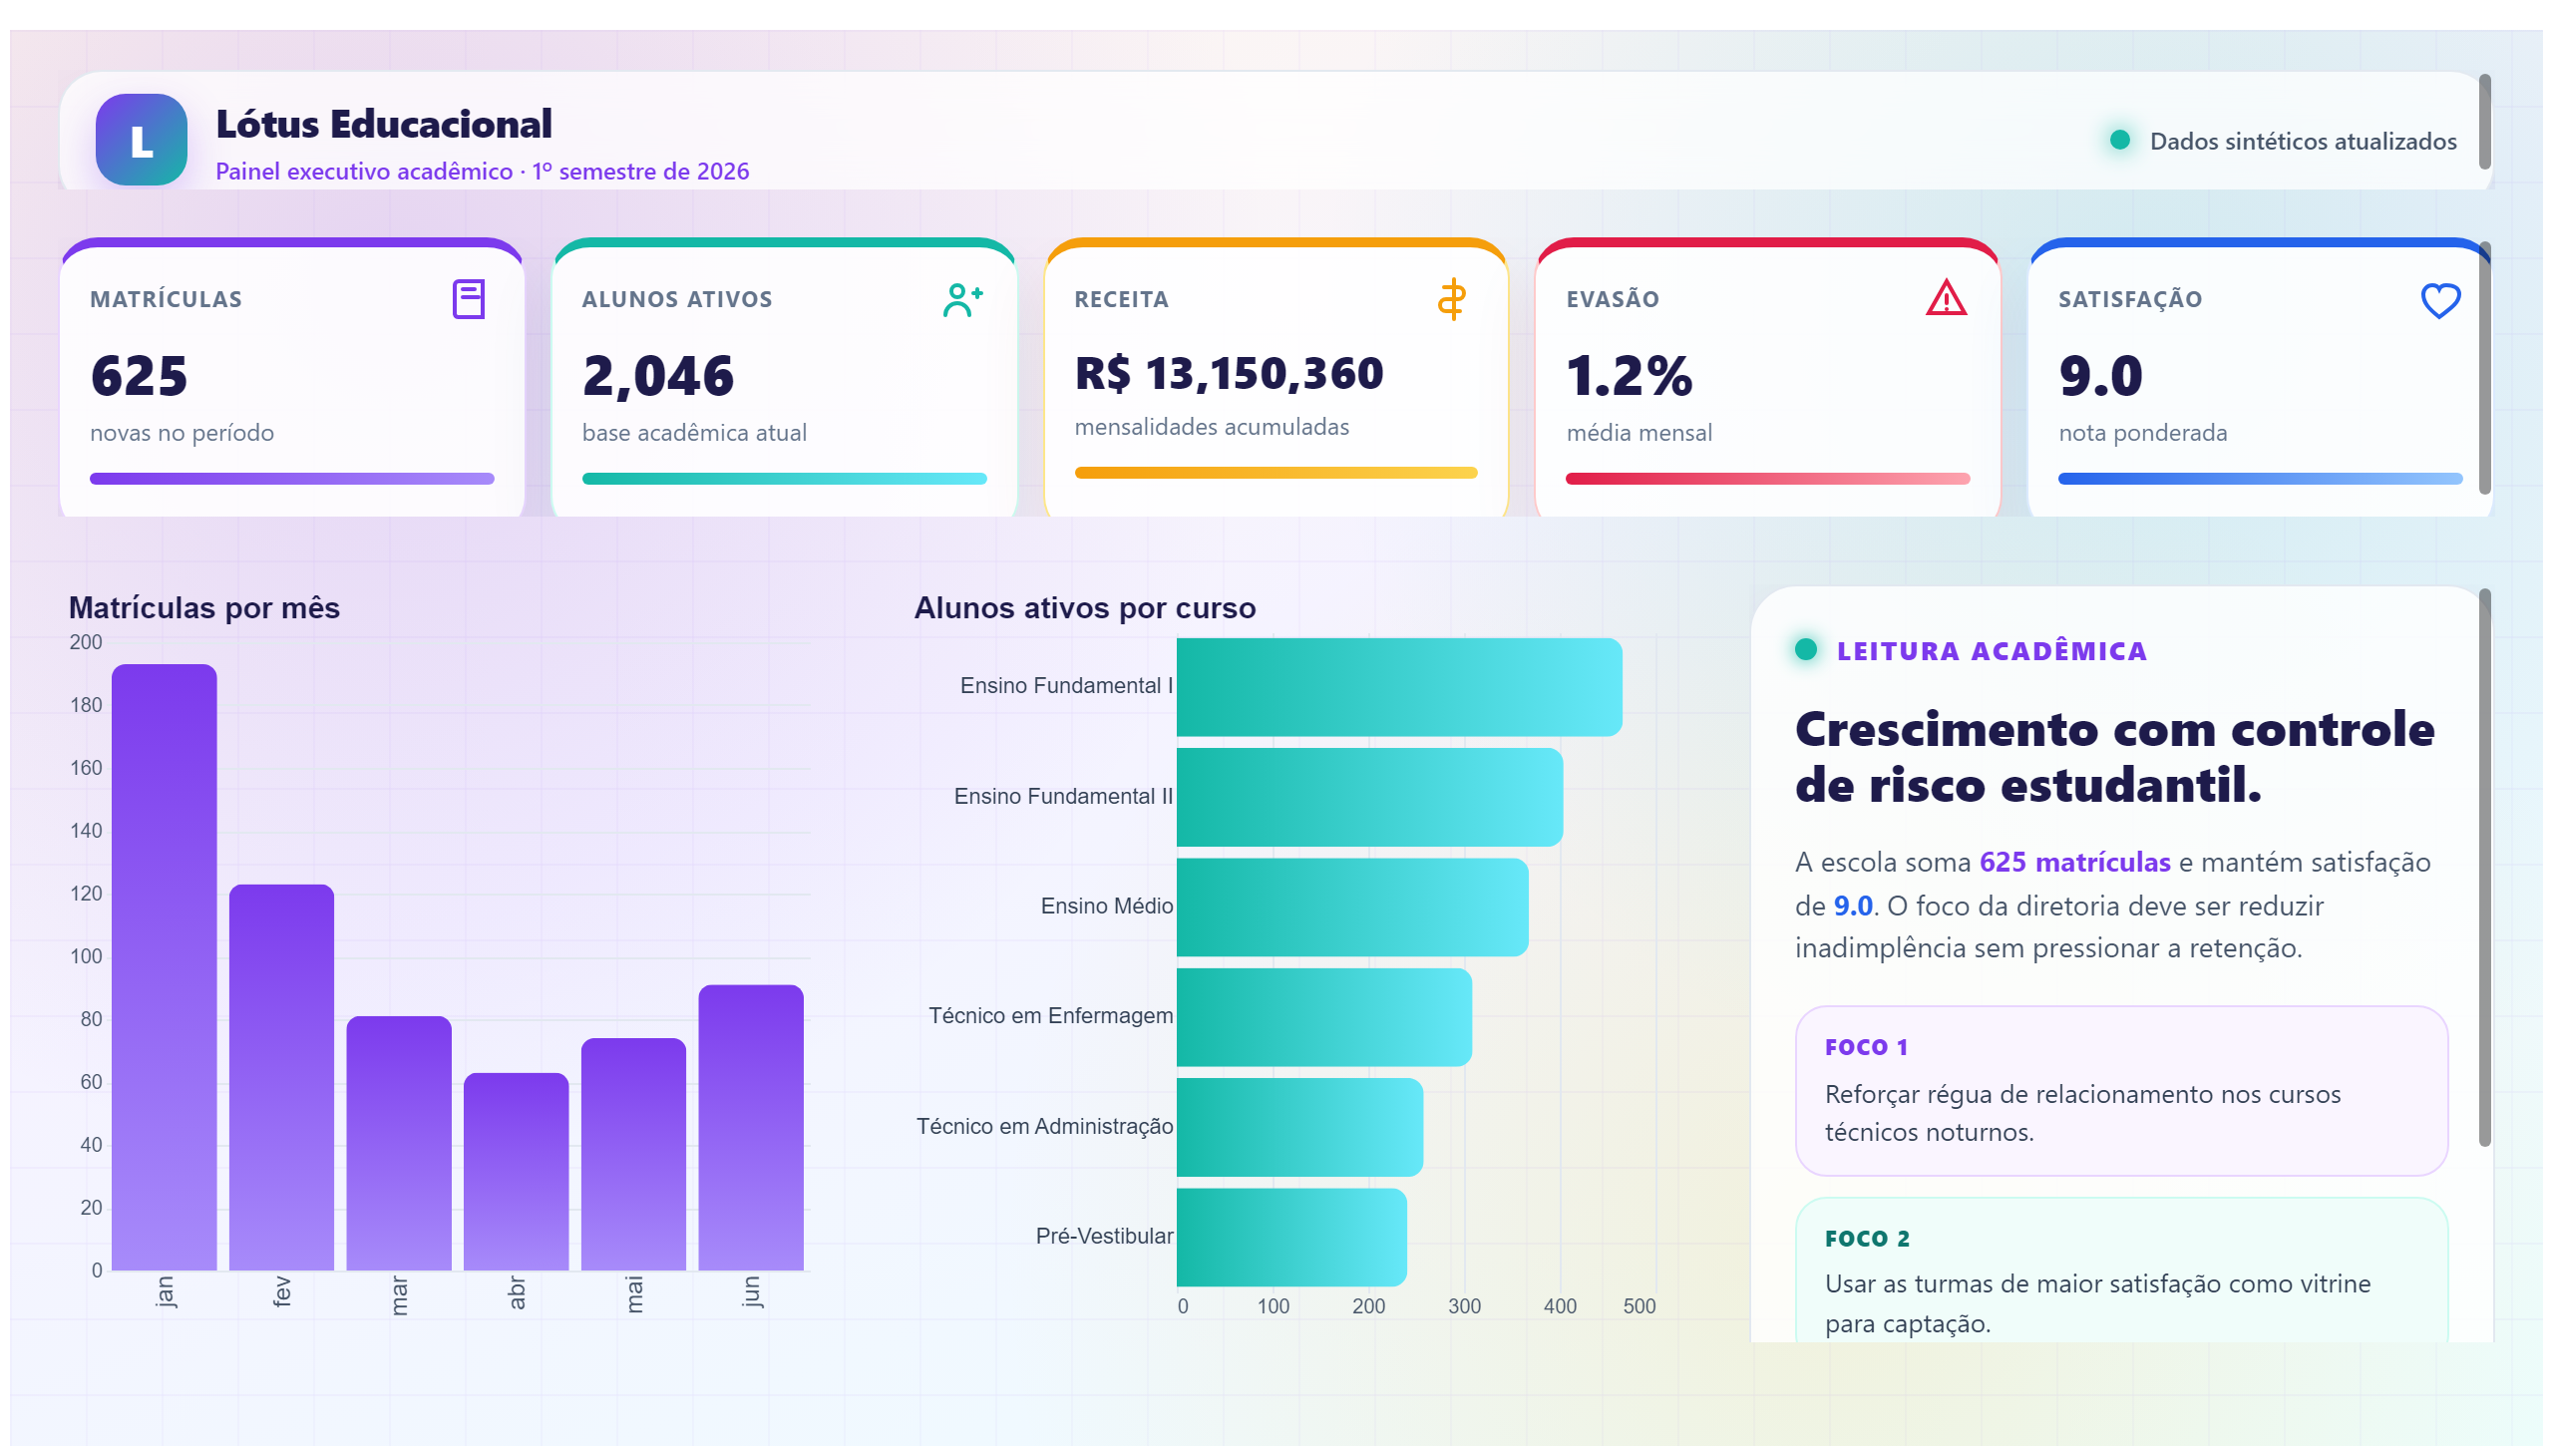
This dashboard represents a comprehensive Power BI course, designed to guide users through practical topics and real-world applications. It serves as a complete learning resource, covering essential aspects of Power BI to help users build their skills from foundational concepts to more advanced techniques. The report offers a structured overview of the course content, enabling learners to track their progress and understand the practical use cases of Power BI in data analysis and visualization.
The dashboard addresses key business questions such as how to effectively use Power BI tools to transform raw data into actionable insights, how to create interactive reports, and how to apply these skills to solve real business problems. It is ideal for students, professionals, and data enthusiasts who want to deepen their understanding of Power BI through hands-on experience. By following this course, users can enhance their ability to make data-driven decisions and improve reporting efficiency within their organizations.
Frequently asked questions about this dashboard
What topics are covered in this Power BI course dashboard?
The dashboard covers practical topics related to Power BI, including data transformation, report creation, and visualization techniques.
Who is the intended audience for this dashboard?
This dashboard is intended for learners, professionals, and anyone interested in gaining practical Power BI skills through a complete course.
How does this dashboard help users in their learning journey?
It provides a structured overview of the course content, allowing users to track progress and apply Power BI concepts to real business scenarios.
Want a dashboard like this with your data?
We build a custom version for your business — US$ 50 per page, delivered within 7 calendar days.
Education Power BI templates
Complete projects built by the Excelverton factory: view them live with a free account and download the PBIP as a channel subscriber (1/month) or Pro subscriber (unlimited).
Create your free account
Save favorites, build collections and use the AI assistant — at no cost.