Corona Virus DataSet
This report presents a dataset about the coronavirus, possibly including statistics and trends.
Create a free account
Save your favorite dashboards, get new templates by area and ask the AI assistant — for free.
About the Corona Virus DataSet dashboard
This is a free Power BI dashboard called Corona Virus DataSet, in the Saúde domain. Explore KPIs, interactive visualizations and get inspired for your own data and business intelligence projects.
This report presents a dataset about the coronavirus, possibly including statistics and trends.
Dashboard analysis
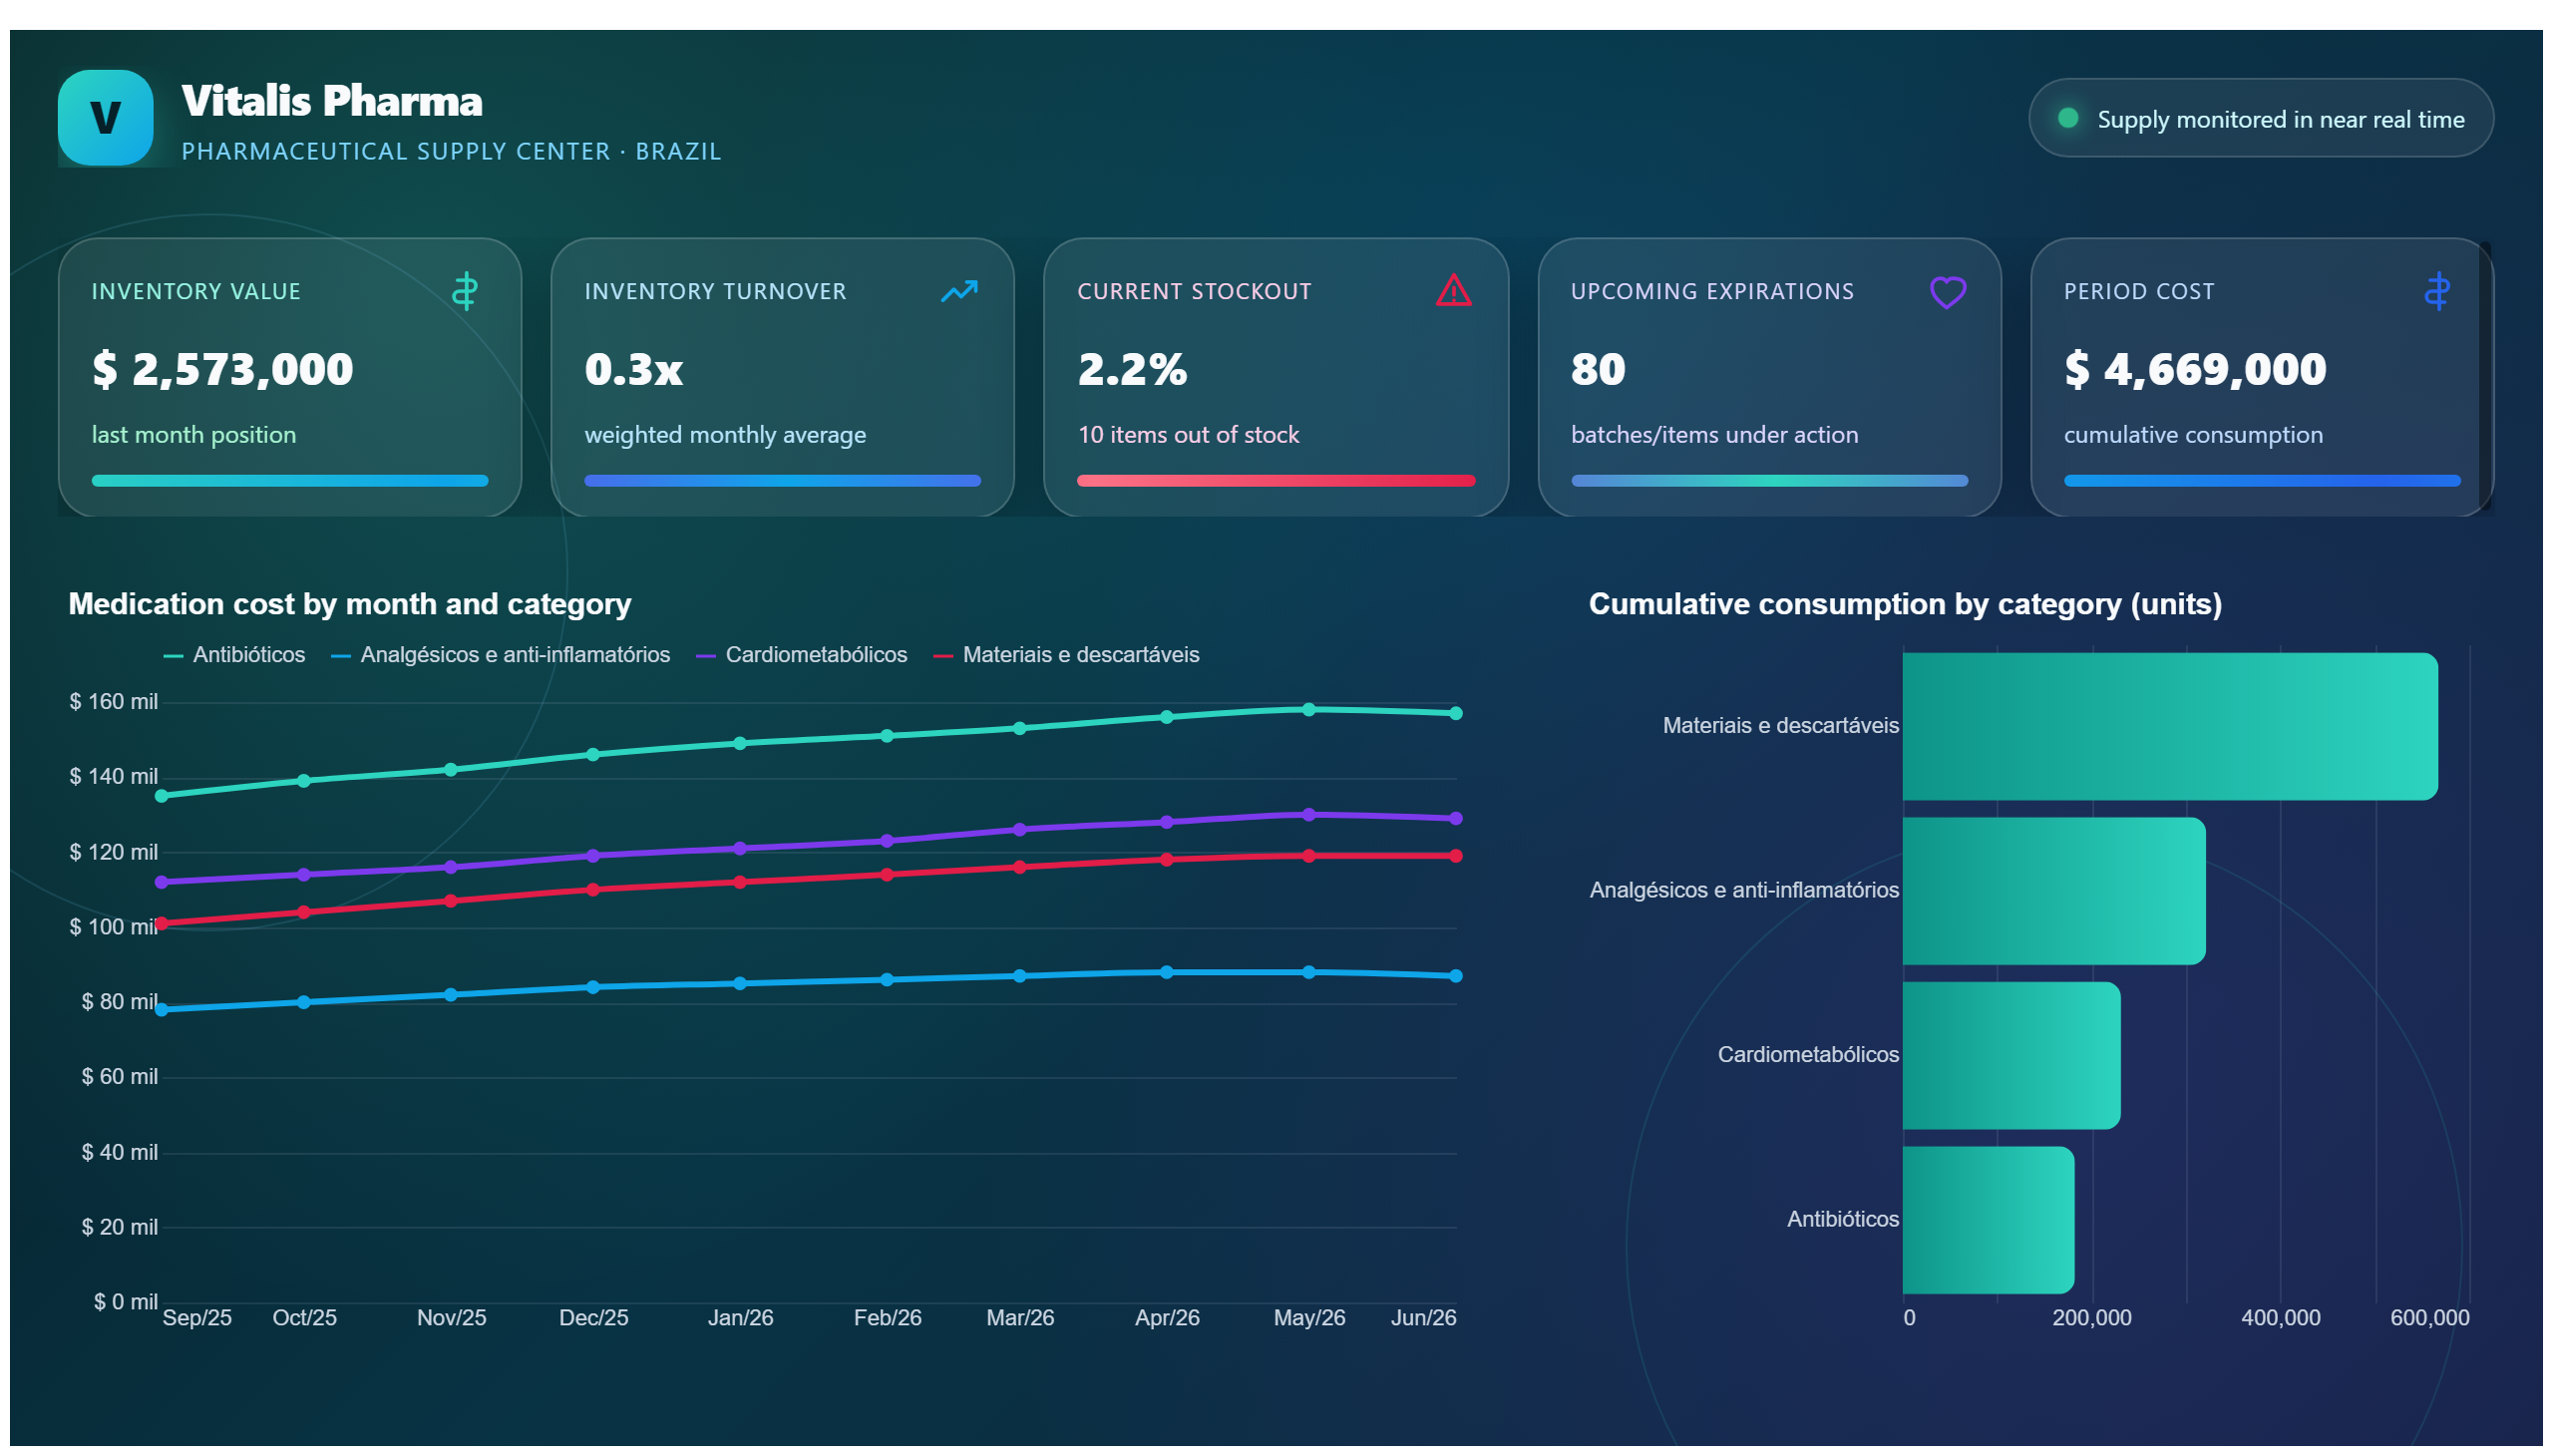
Corona Virus DataSet dashboard offers a comprehensive view of coronavirus-related data, presenting key statistics and trends that help users understand the progression of the pandemic. The report likely includes metrics such as infection rates, recovery numbers, and possibly mortality rates, enabling stakeholders to monitor the current state and historical evolution of the virus spread.
This dashboard serves as a valuable tool for healthcare professionals, policymakers, and data analysts who need to make informed decisions based on accurate and up-to-date information. It answers critical business questions such as: What are the current infection trends? How are different regions or demographics affected? What is the rate of recovery versus new cases? By providing these insights, the report supports strategic planning, resource allocation, and public health interventions.
Frequently asked questions about this dashboard
What type of data is included in the Corona Virus DataSet dashboard?
The dashboard includes coronavirus-related statistics and trends, such as infection rates and possibly recovery and mortality data.
Who is the primary audience for this dashboard?
Healthcare professionals, policymakers, and data analysts who require detailed insights into the pandemic's progression.
What business questions does this dashboard help answer?
It helps answer questions about infection trends, regional impact, and recovery rates to support decision-making and public health strategies.
Want a dashboard like this with your data?
We build a custom version for your business — US$ 50 per page, delivered within 7 calendar days.
Healthcare Power BI templates
Complete projects built by the Excelverton factory: view them live with a free account and download the PBIP as a channel subscriber (1/month) or Pro subscriber (unlimited).
Create your free account
Save favorites, build collections and use the AI assistant — at no cost.