Dashboard PBI - Financial Performance Overview
This panel offers an overview of the company's financial performance, including revenues and expenses.
Create a free account
Save your favorite dashboards, get new templates by area and ask the AI assistant — for free.
About the Dashboard PBI - Financial Performance Overview dashboard
This is a free Power BI dashboard called Dashboard PBI - Financial Performance Overview, in the Financeiro domain. Explore KPIs, interactive visualizations and get inspired for your own data and business intelligence projects.
This panel offers an overview of the company's financial performance, including revenues and expenses.
Dashboard analysis
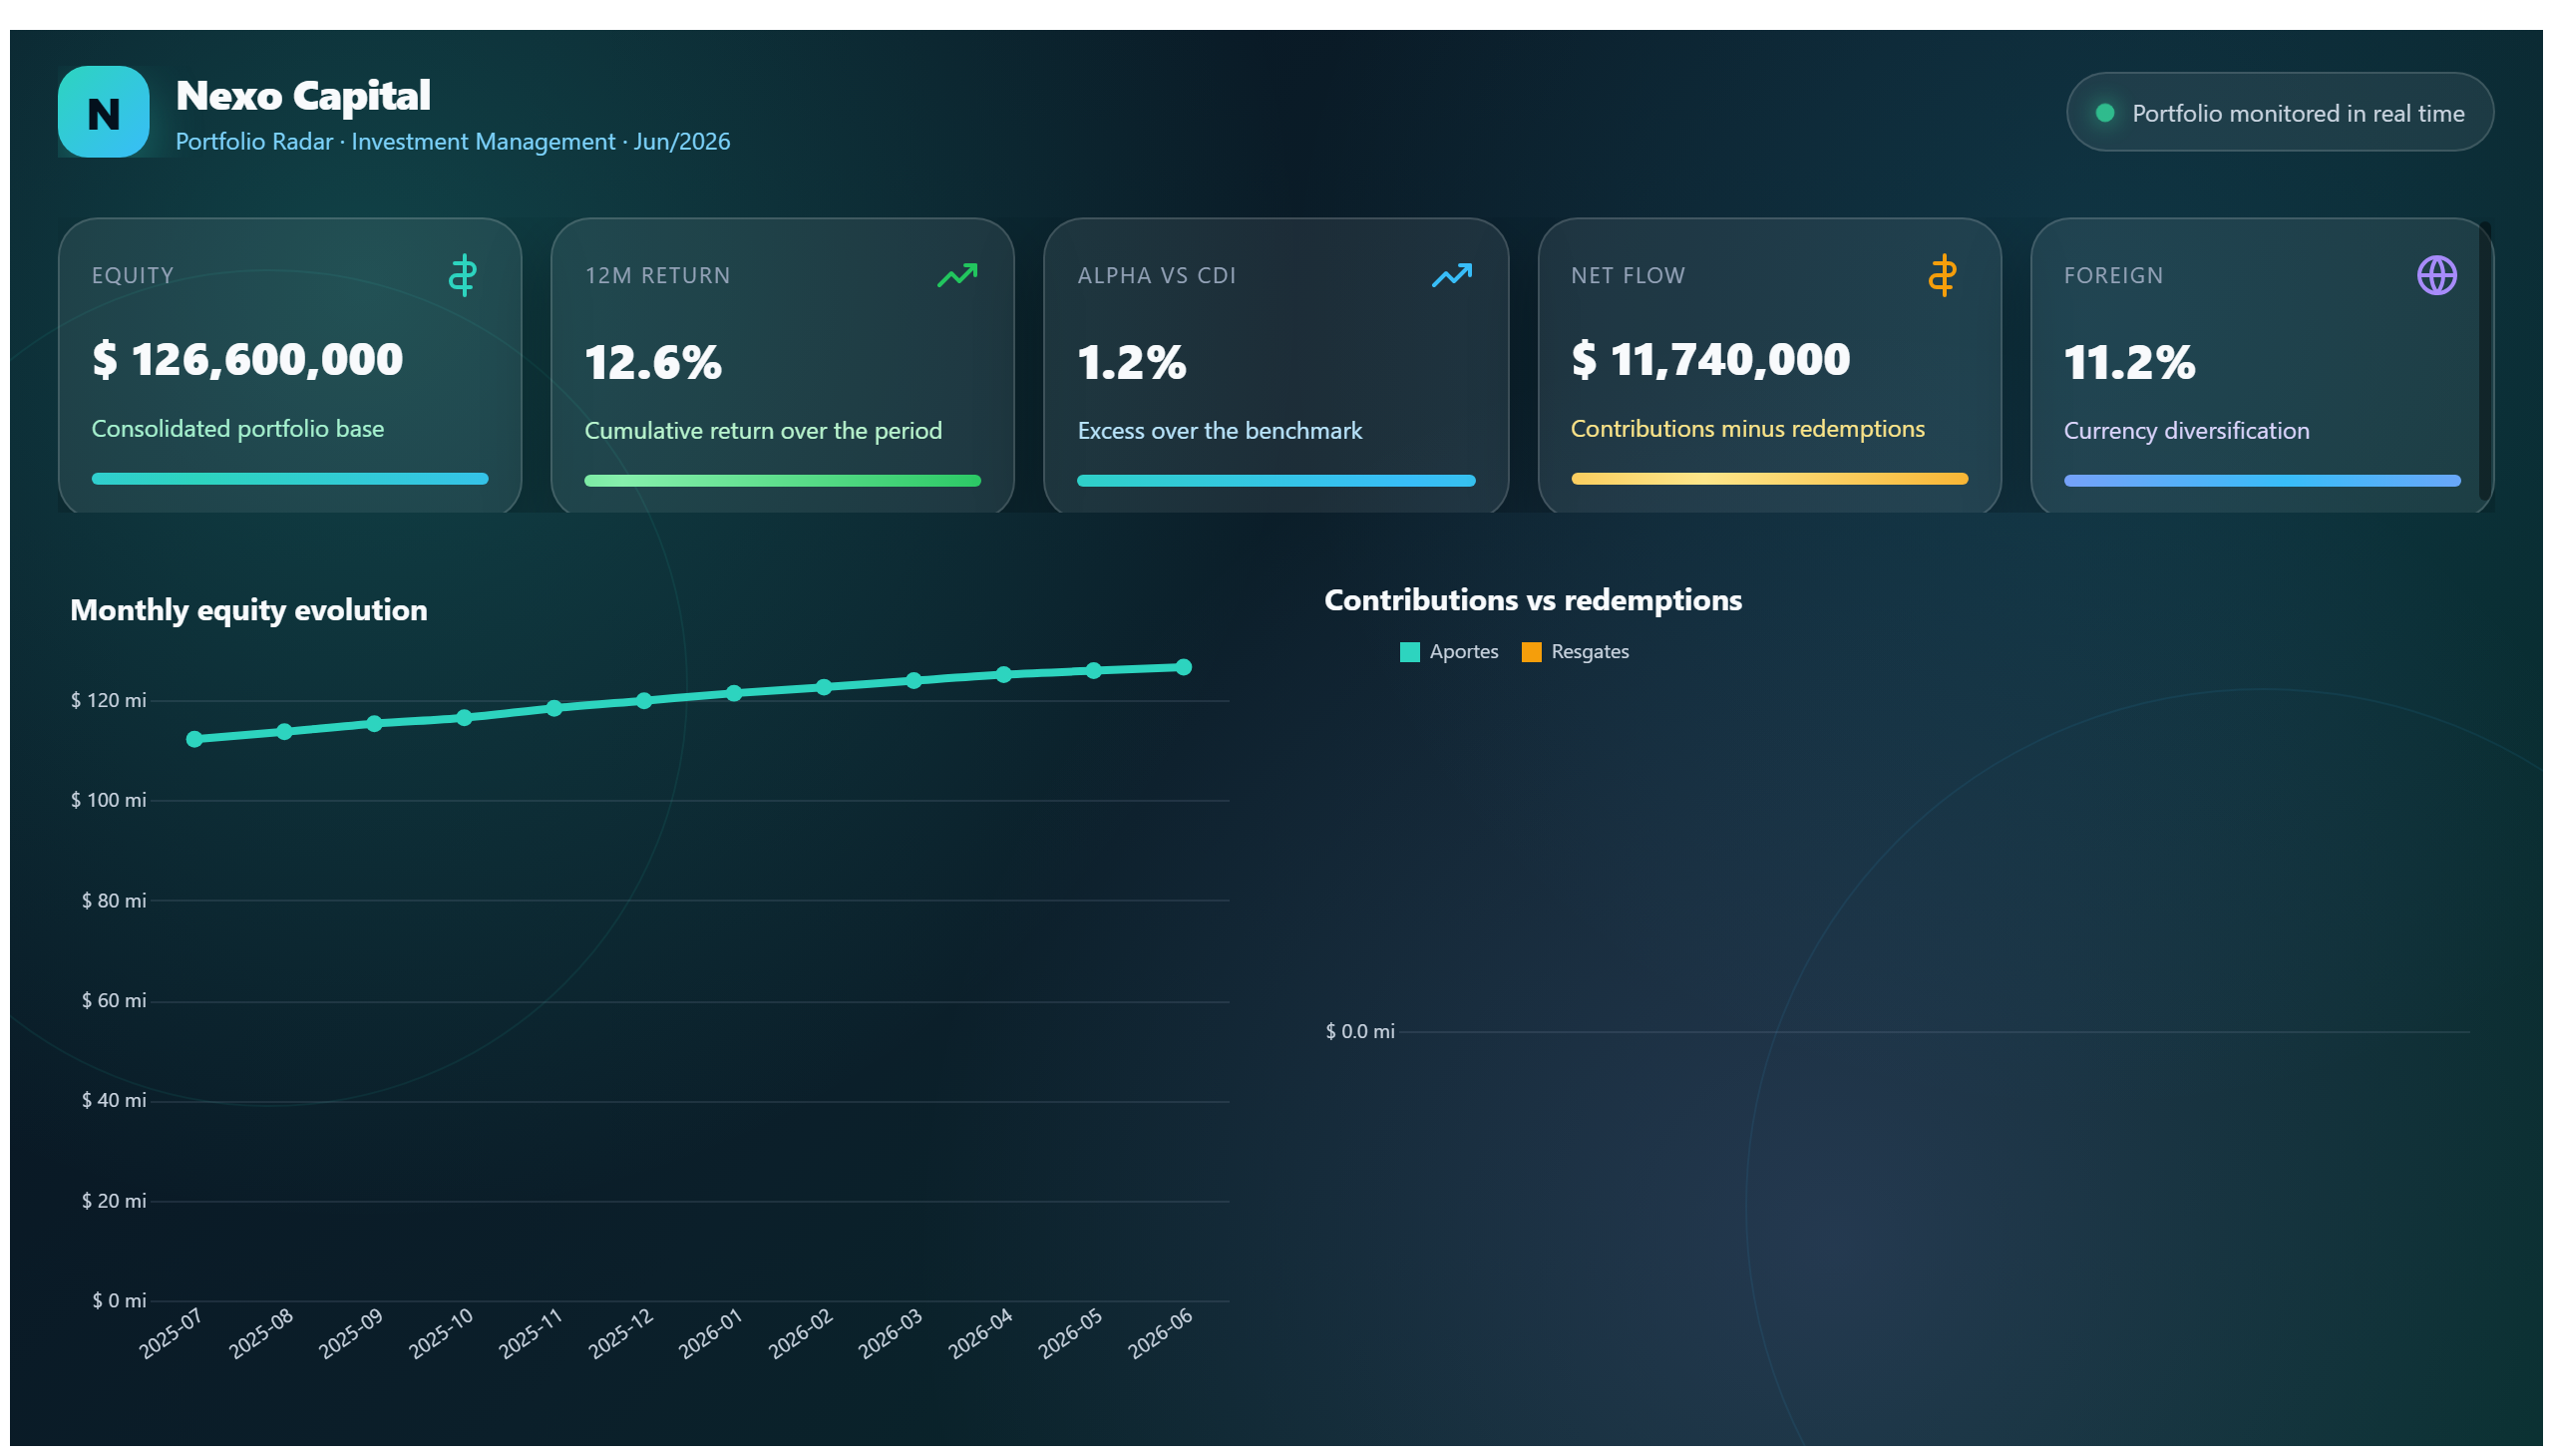
The Financial Performance Overview dashboard provides a comprehensive snapshot of a company's financial health by showcasing key metrics such as revenues and expenses. It enables users to quickly assess the overall financial performance, identify trends, and detect potential areas of concern or opportunity. By visualizing income and expenditure side by side, stakeholders can better understand how financial resources are being managed over time.
This dashboard is designed to answer critical business questions such as: How are revenues and expenses evolving month over month? Are there any significant fluctuations that require attention? What is the overall profitability status of the company? It serves finance professionals, managers, and executives who need timely insights to make informed decisions regarding budgeting, cost control, and strategic planning.
With its clear and concise presentation, the dashboard supports effective financial management by highlighting key performance indicators that drive business success. It is an essential tool for anyone involved in monitoring and improving the financial results of the organization.
Frequently asked questions about this dashboard
What financial metrics are displayed in this dashboard?
The dashboard displays key financial metrics including revenues and expenses to provide an overview of the company's financial performance.
Who is the primary audience for this dashboard?
The dashboard is intended for finance professionals, managers, and executives who require insights into the company's financial health for decision-making.
Can this dashboard help identify trends in financial performance?
Yes, by visualizing revenues and expenses over time, the dashboard helps users detect trends and significant fluctuations in financial performance.
Want a dashboard like this with your data?
We build a custom version for your business — US$ 50 per page, delivered within 7 calendar days.
Finance Power BI templates
Complete projects built by the Excelverton factory: view them live with a free account and download the PBIP as a channel subscriber (1/month) or Pro subscriber (unlimited).
Create your free account
Save favorites, build collections and use the AI assistant — at no cost.