General Education Enrollment
This report shows enrollment data in general education, possibly analyzing trends and demographics.
Create a free account
Save your favorite dashboards, get new templates by area and ask the AI assistant — for free.
About the General Education Enrollment dashboard
This is a free Power BI dashboard called General Education Enrollment, in the Educação domain. Explore KPIs, interactive visualizations and get inspired for your own data and business intelligence projects.
This report shows enrollment data in general education, possibly analyzing trends and demographics.
Dashboard analysis
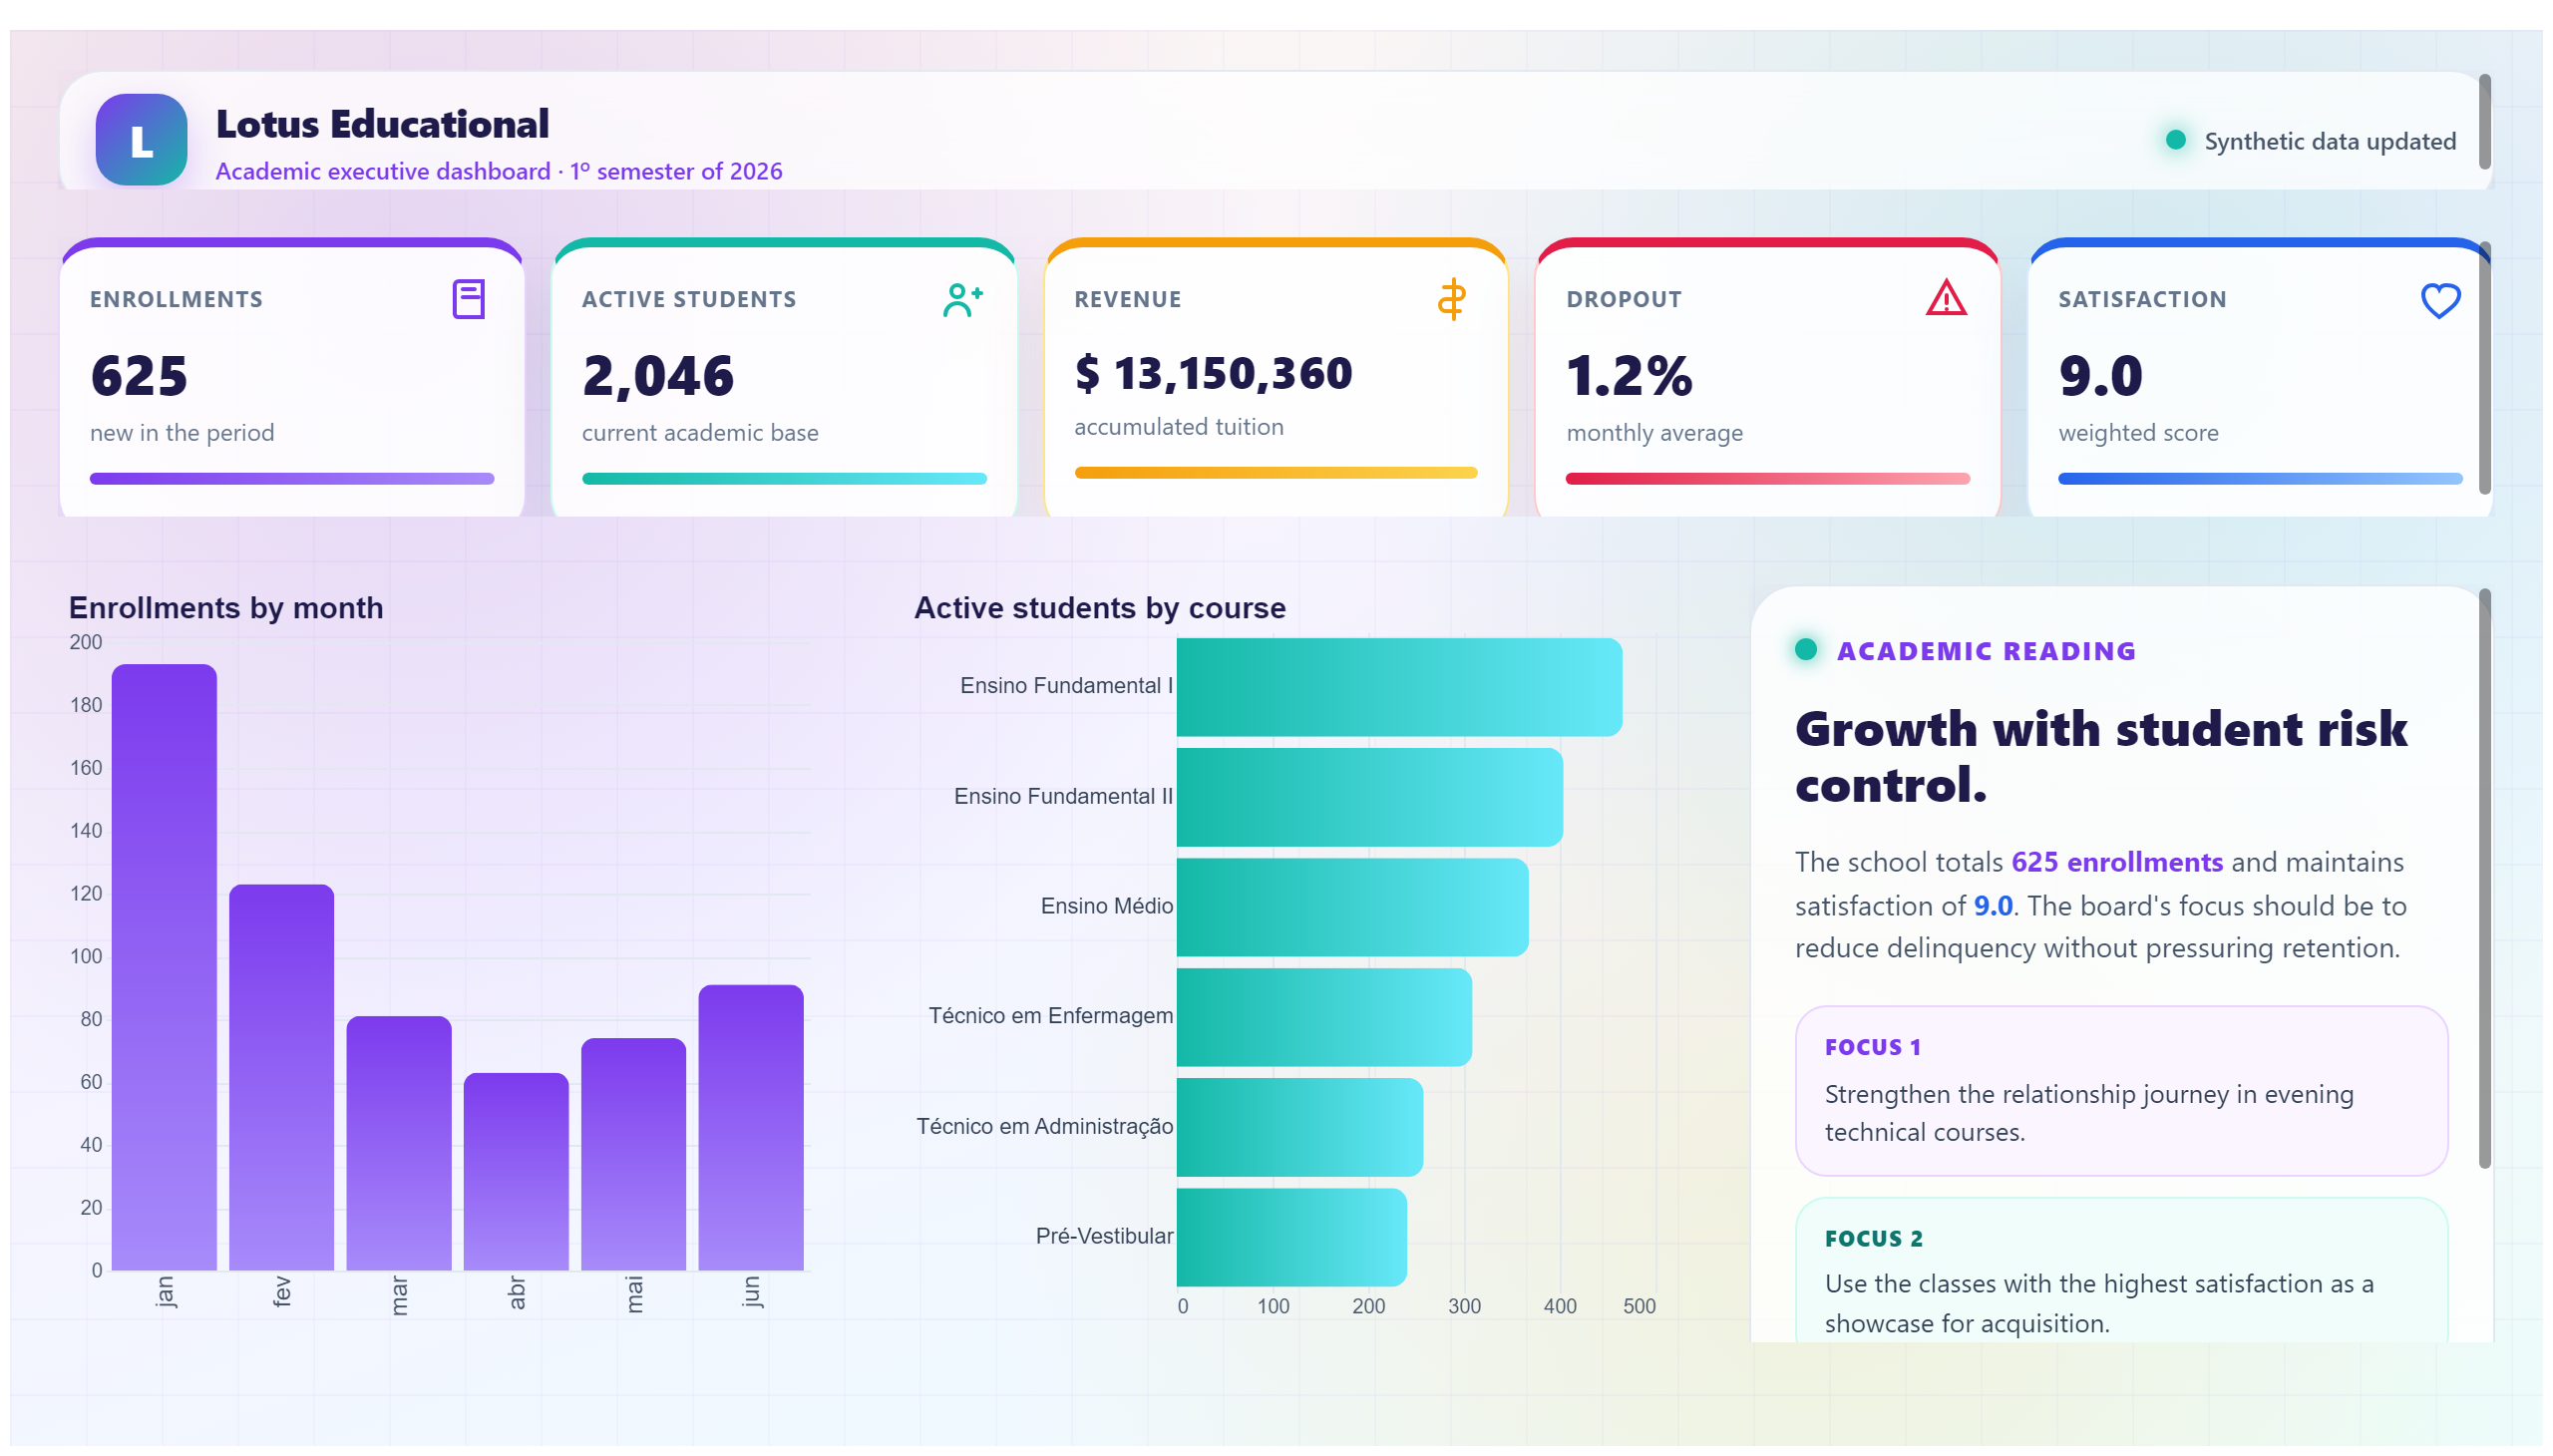
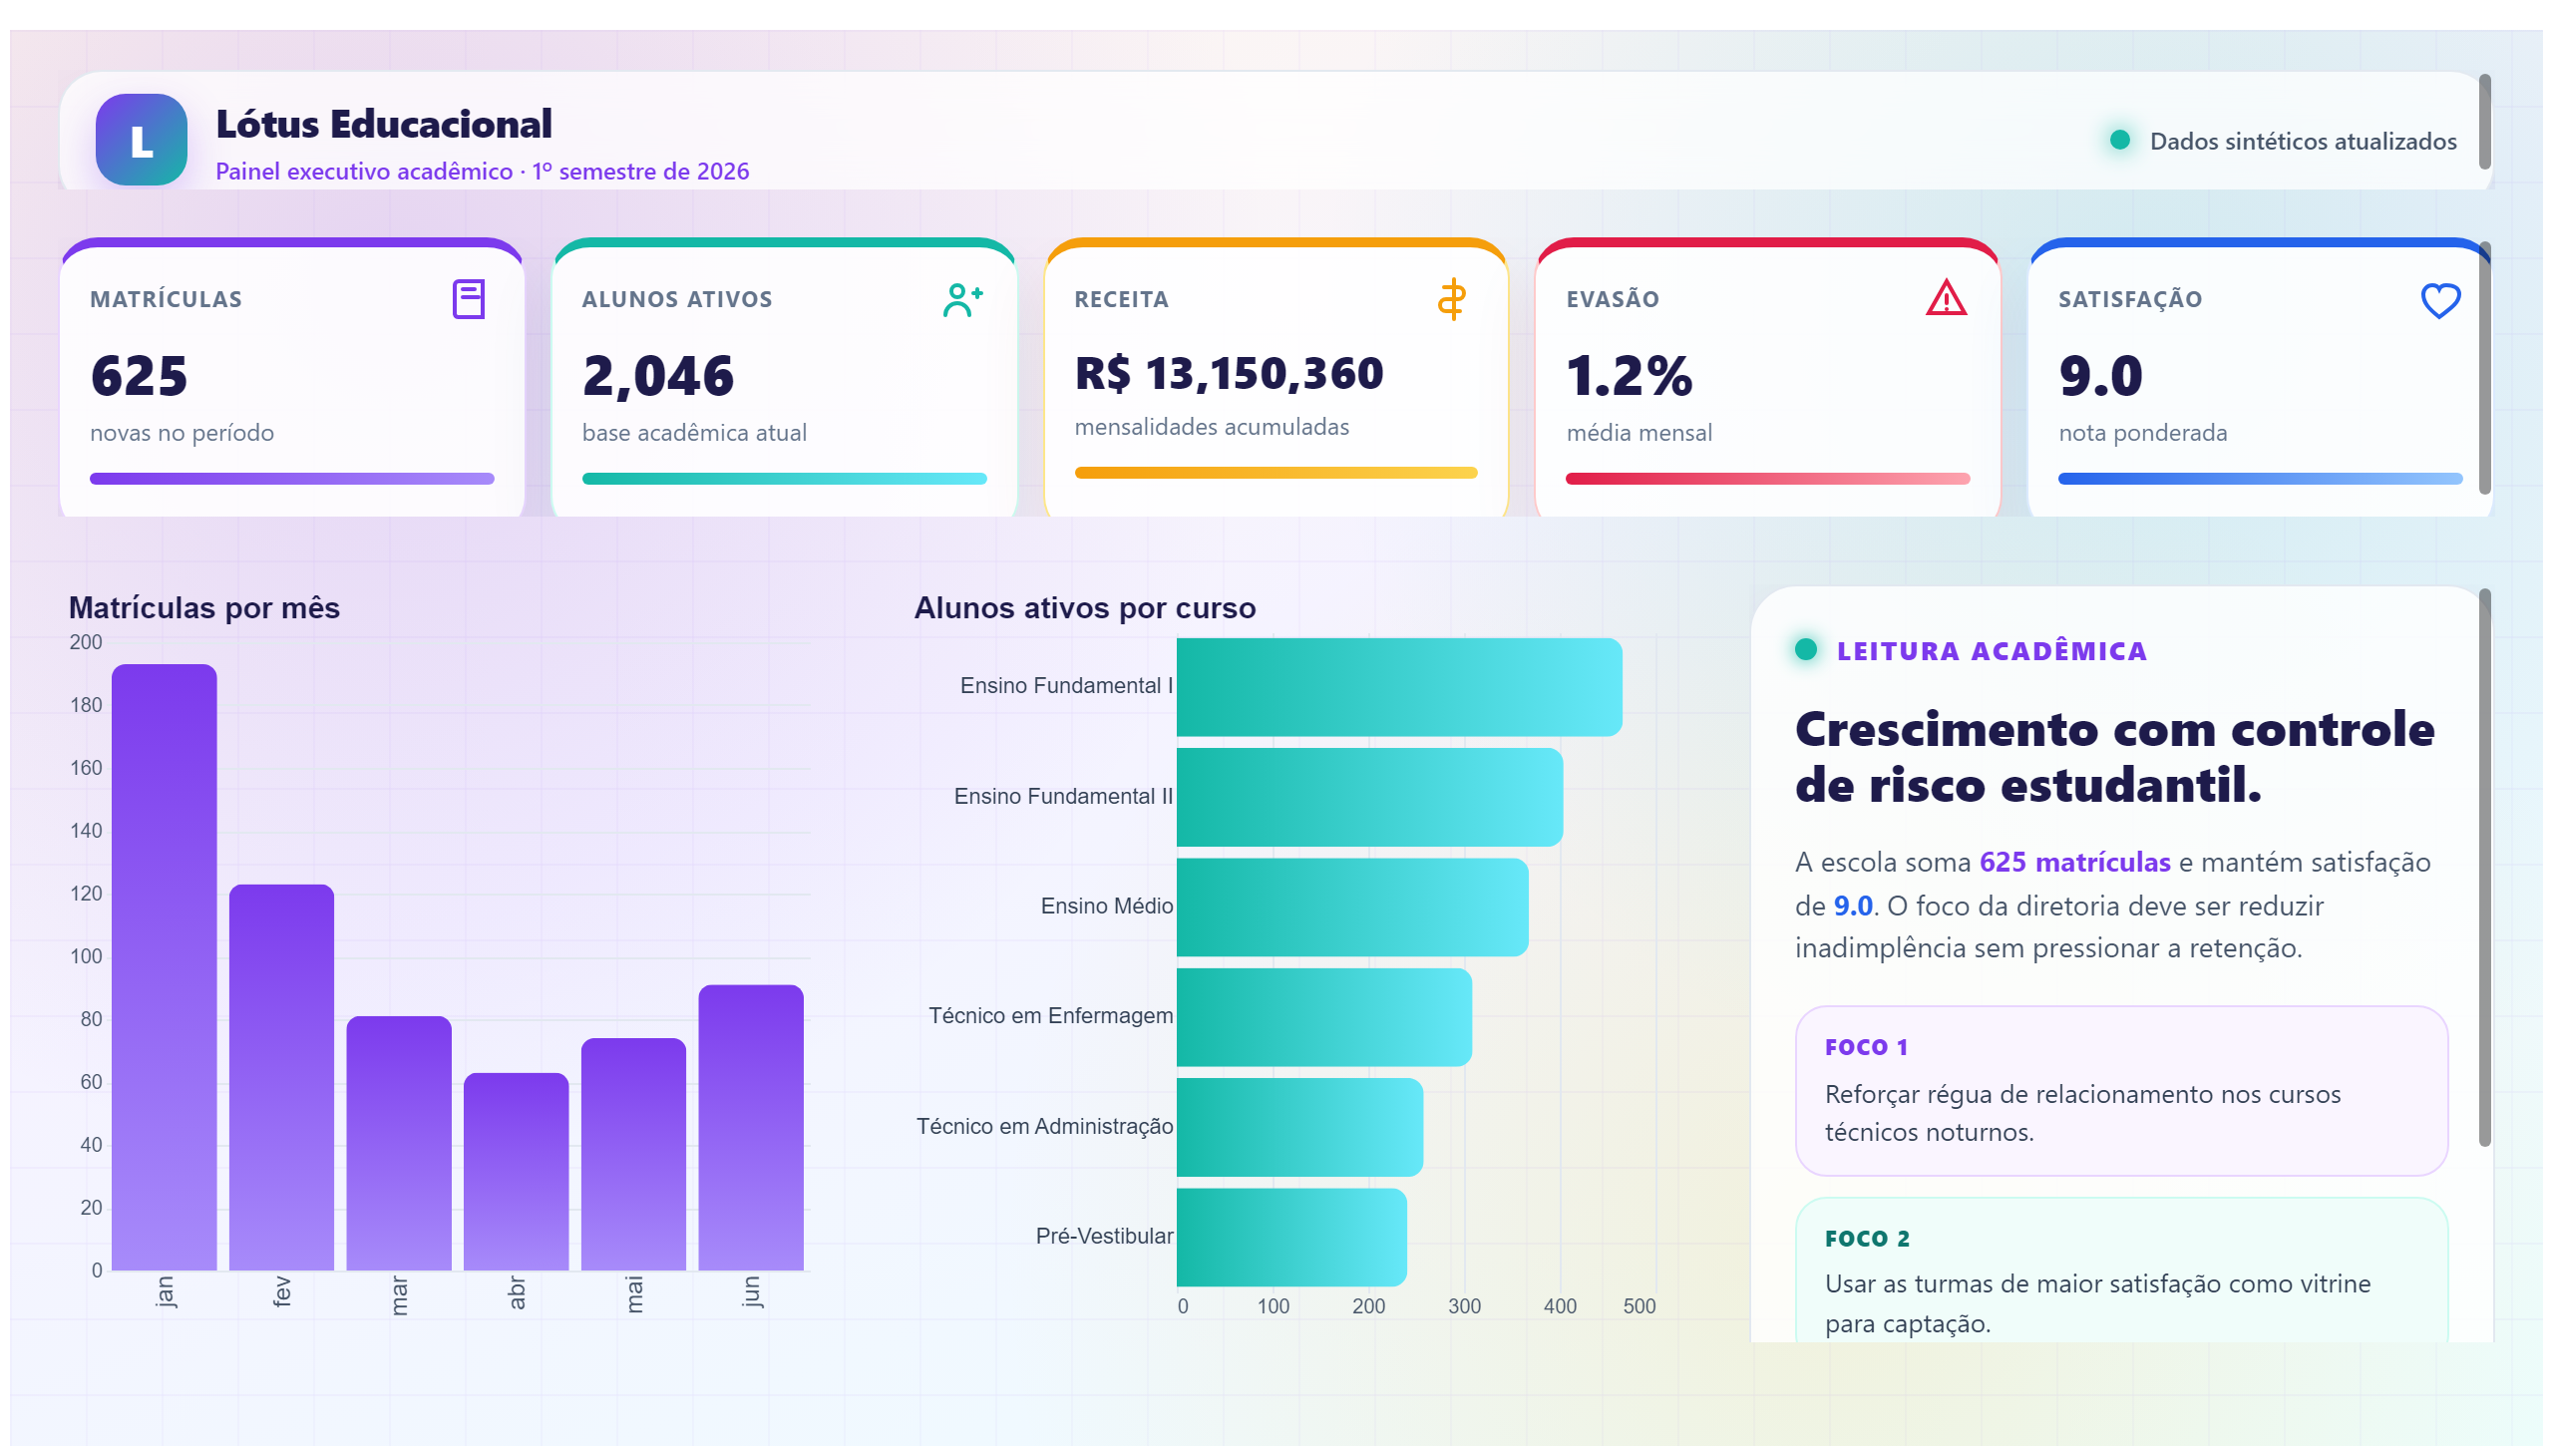
The General Education Enrollment dashboard provides a comprehensive overview of enrollment data within the general education sector. By visualizing trends and demographic breakdowns, this report enables stakeholders to understand how student populations are evolving over time. It highlights key metrics such as total enrollment numbers, changes across different age groups or regions, and possibly gender distribution, allowing for a nuanced analysis of the educational landscape.
This dashboard is particularly useful for education administrators, policy makers, and planners who need to monitor enrollment patterns to make informed decisions. Questions such as "How has enrollment changed over recent years?", "Which demographic groups are growing or declining in enrollment?", and "Are there regional disparities in general education participation?" can be addressed through this report. By providing clear insights into these areas, the dashboard supports strategic planning, resource allocation, and the development of targeted educational programs.
Frequently asked questions about this dashboard
What time periods does the enrollment data cover?
The dashboard analyzes enrollment trends over multiple years, allowing users to observe changes and patterns across different time frames.
Can the dashboard show enrollment by demographic groups?
Yes, it includes demographic breakdowns such as age groups and potentially other factors to help understand the composition of enrolled students.
Who is the intended audience for this dashboard?
The dashboard is designed for education administrators, policy makers, and planners who need to monitor and analyze general education enrollment data.
Want a dashboard like this with your data?
We build a custom version for your business — US$ 50 per page, delivered within 7 calendar days.
Education Power BI templates
Complete projects built by the Excelverton factory: view them live with a free account and download the PBIP as a channel subscriber (1/month) or Pro subscriber (unlimited).
Create your free account
Save favorites, build collections and use the AI assistant — at no cost.