FrotasLogistica
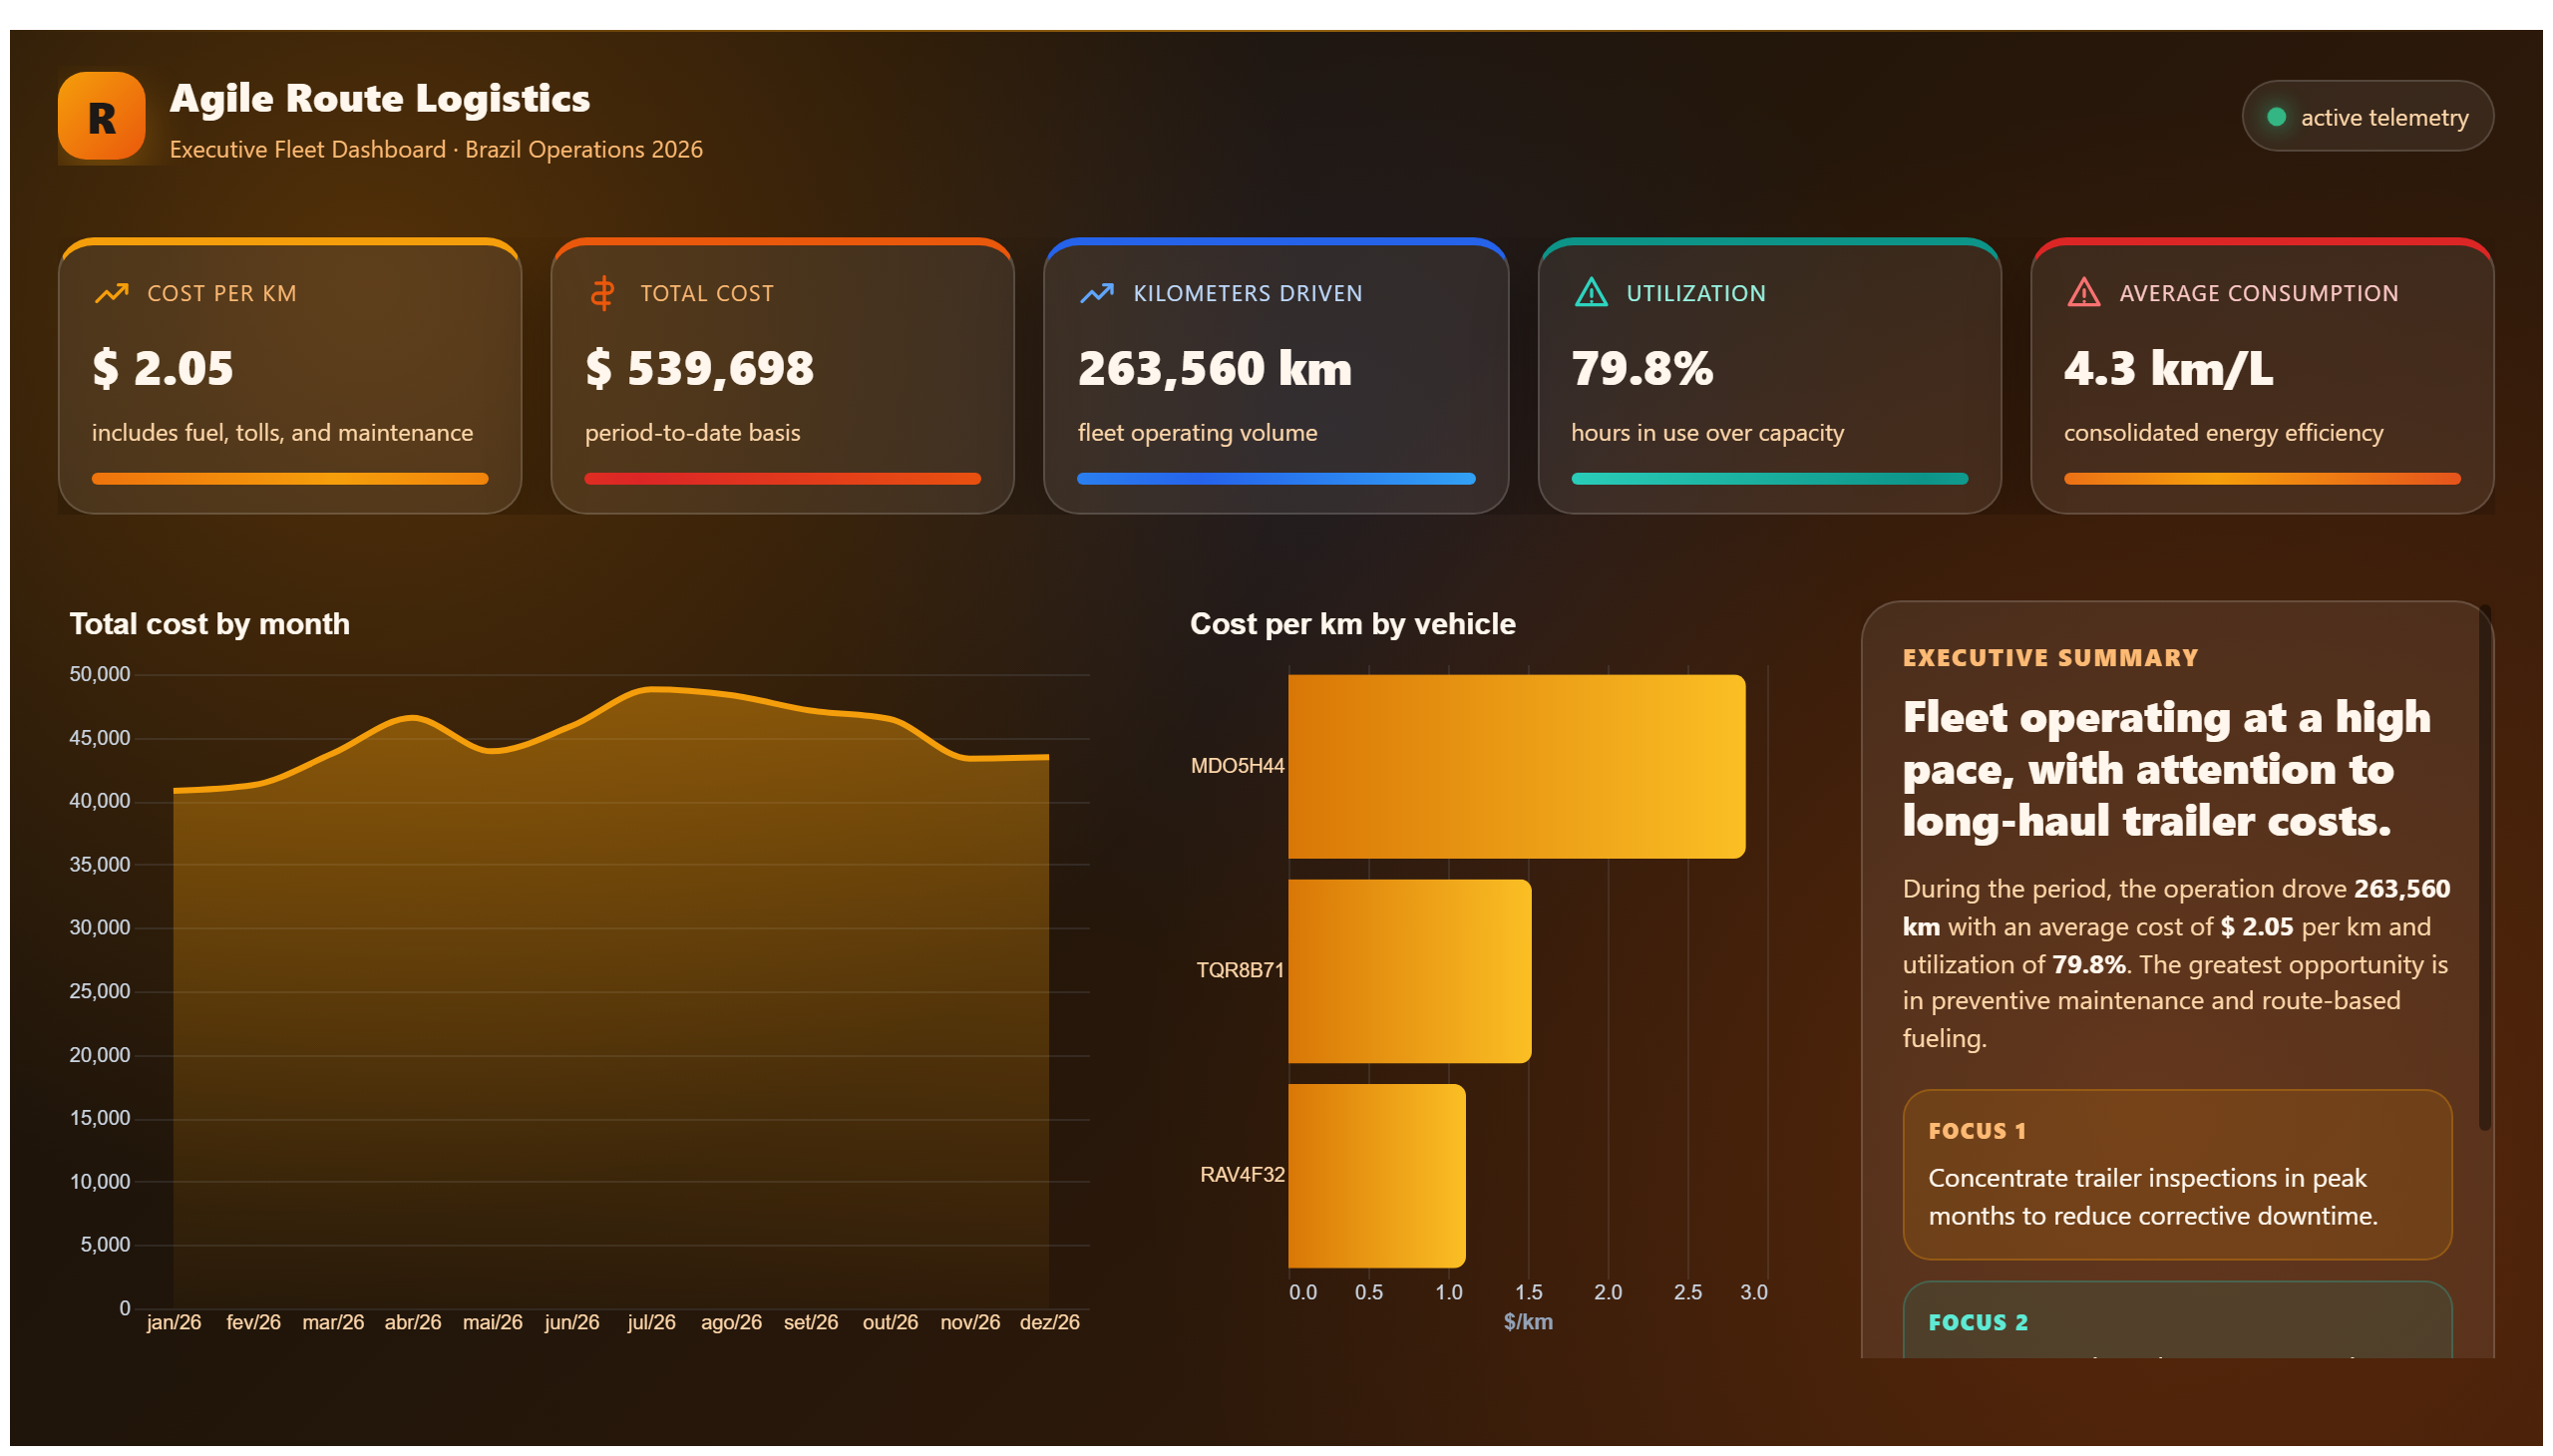
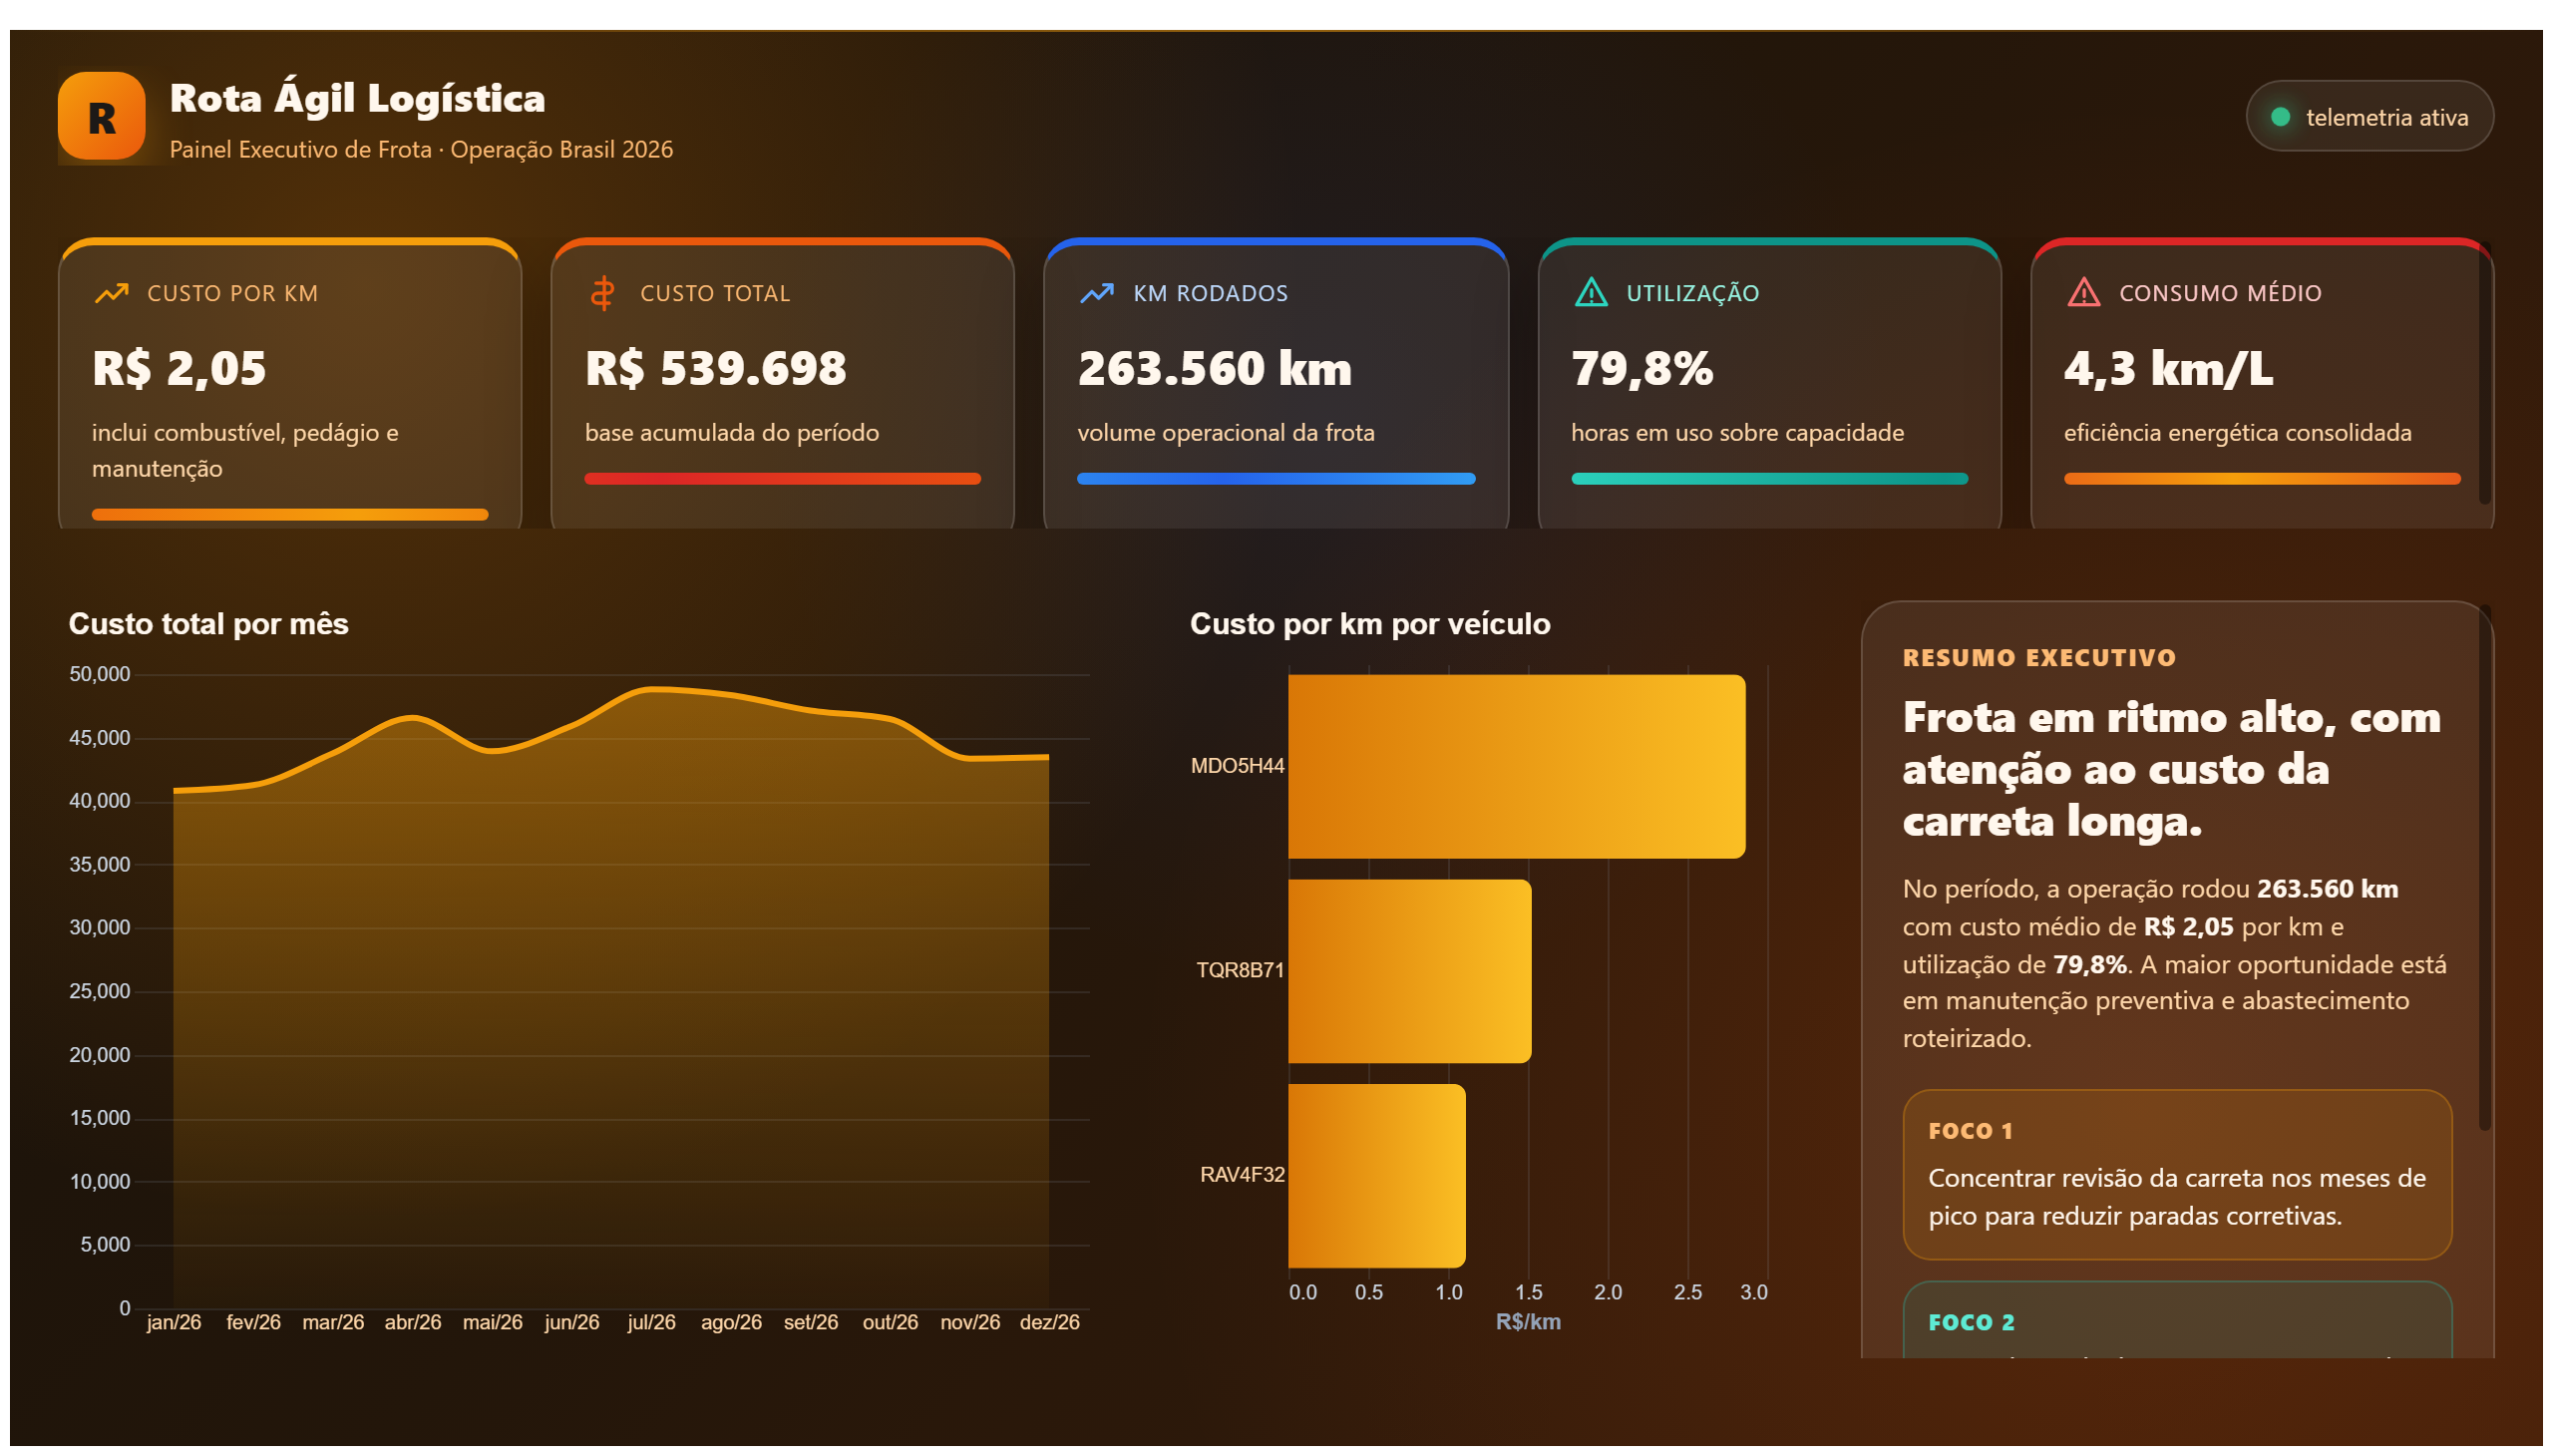
This report analyzes fleet logistics data, including efficiency and costs.
This report analyzes the supply chain, providing insights on operations.
Save your favorite dashboards, get new templates by area and ask the AI assistant — for free.
This is a free Power BI dashboard called Atliq_mart_Supply_chain_analysis, in the Logística domain. Explore KPIs, interactive visualizations and get inspired for your own data and business intelligence projects.
This report analyzes the supply chain, providing insights on operations.
The Atliq_mart_Supply_chain_analysis dashboard offers a comprehensive overview of supply chain operations, delivering critical insights to optimize performance. It visualizes key metrics such as inventory levels, supplier performance, and shipment timelines, enabling users to monitor the flow of goods from procurement to delivery. This report is designed to help supply chain managers and operations teams identify bottlenecks, inefficiencies, and opportunities for cost reduction.
By answering essential business questions like "Where are the delays occurring in the supply chain?" and "How are suppliers performing against delivery targets?", the dashboard supports data-driven decision-making. It allows users to drill down into specific segments of the supply chain to assess operational health and forecast potential disruptions. Ultimately, this tool empowers organizations to enhance supply chain resilience and improve overall operational efficiency.
The dashboard tracks key metrics including inventory levels, supplier performance, and shipment timelines to provide a detailed view of supply chain operations.
The report is primarily intended for supply chain managers and operations teams responsible for monitoring and optimizing supply chain performance.
By visualizing data on operations and supplier performance, the dashboard highlights bottlenecks and delays, enabling users to pinpoint areas needing improvement.
We build a custom version for your business — US$ 50 per page, delivered within 7 calendar days.
Explore more Power BI dashboards from the same domain to compare KPIs, layouts and analytics models.
This report analyzes fleet logistics data, including efficiency and costs.
Report on fleet management in transportation and logistics, focusing on efficiency and costs.
Logistics report that may show product flow and inventory.
This report analyzes data related to a company's supply chain.
Complete projects built by the Excelverton factory: view them live and download the PBIP — 1 free downloads every 30 days with a free account, unlimited on Pro.
Save favorites, build collections and use the AI assistant — at no cost.