Health project
This report analyzes a project in the health sector, addressing critical aspects and expected results.
Create a free account
Save your favorite dashboards, get new templates by area and ask the AI assistant — for free.
About the Health project dashboard
This is a free Power BI dashboard called Health project, in the Saúde domain. Explore KPIs, interactive visualizations and get inspired for your own data and business intelligence projects.
This report analyzes a project in the health sector, addressing critical aspects and expected results.
Dashboard analysis
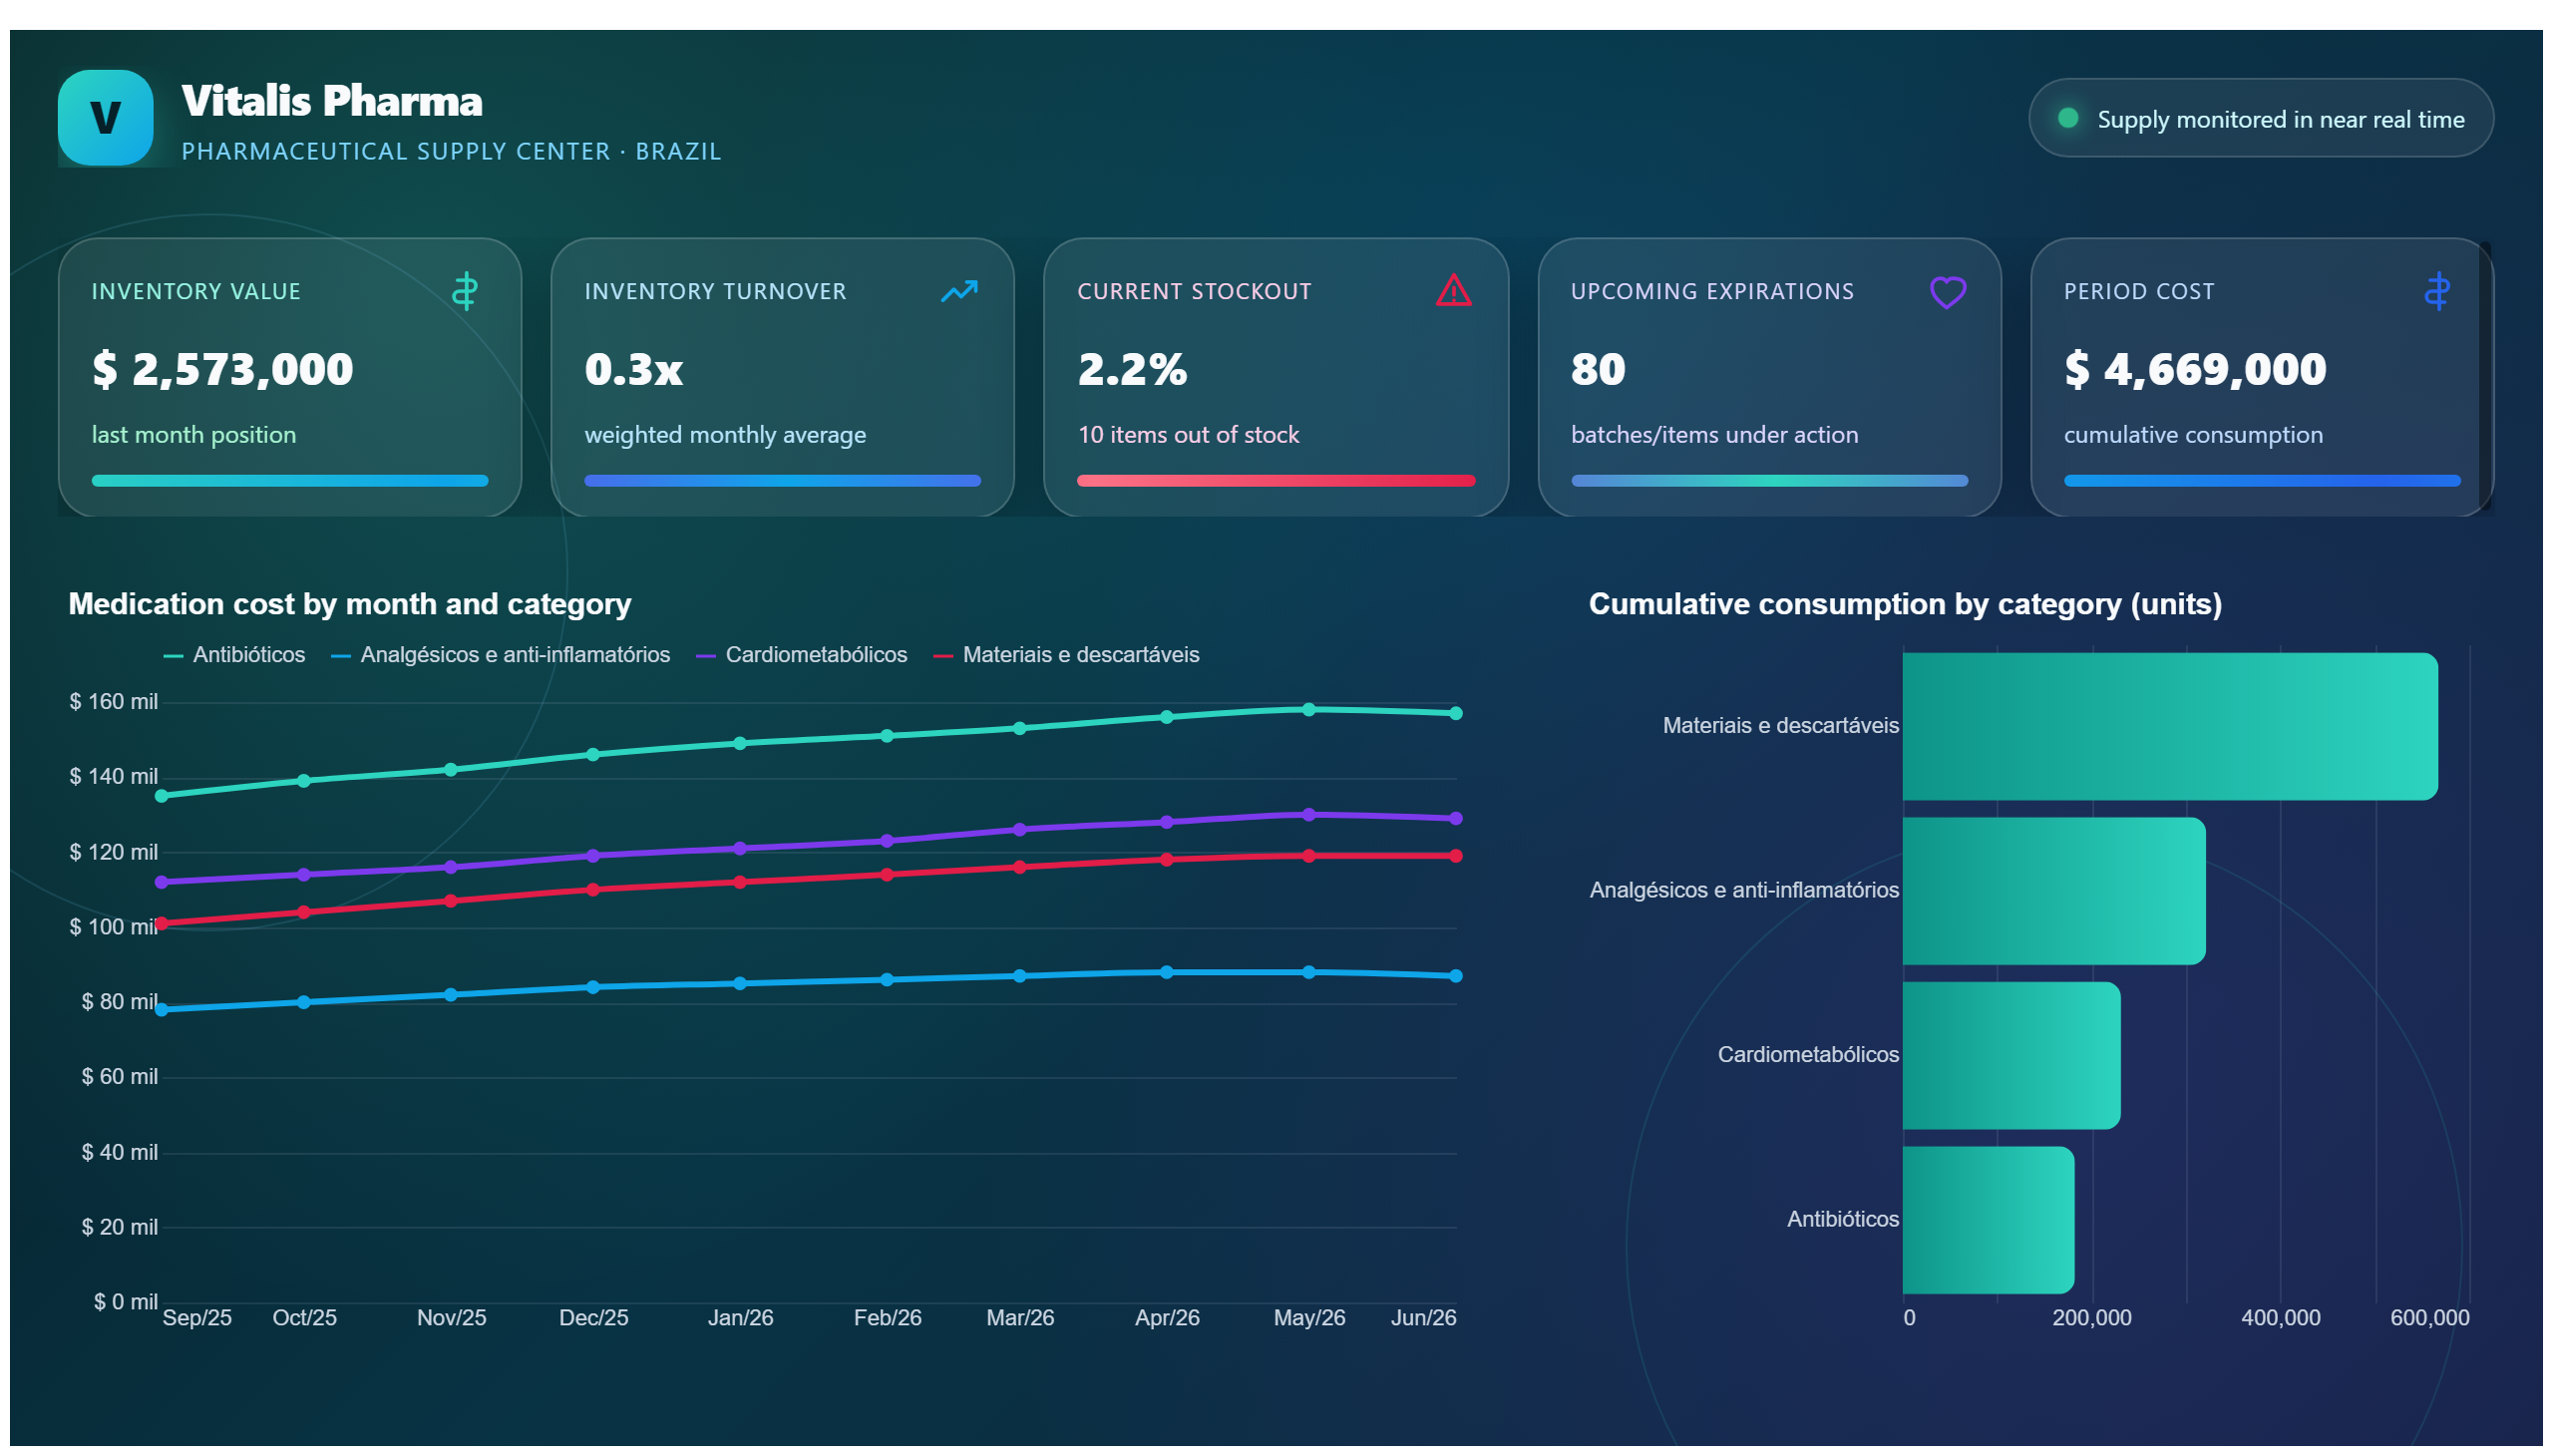
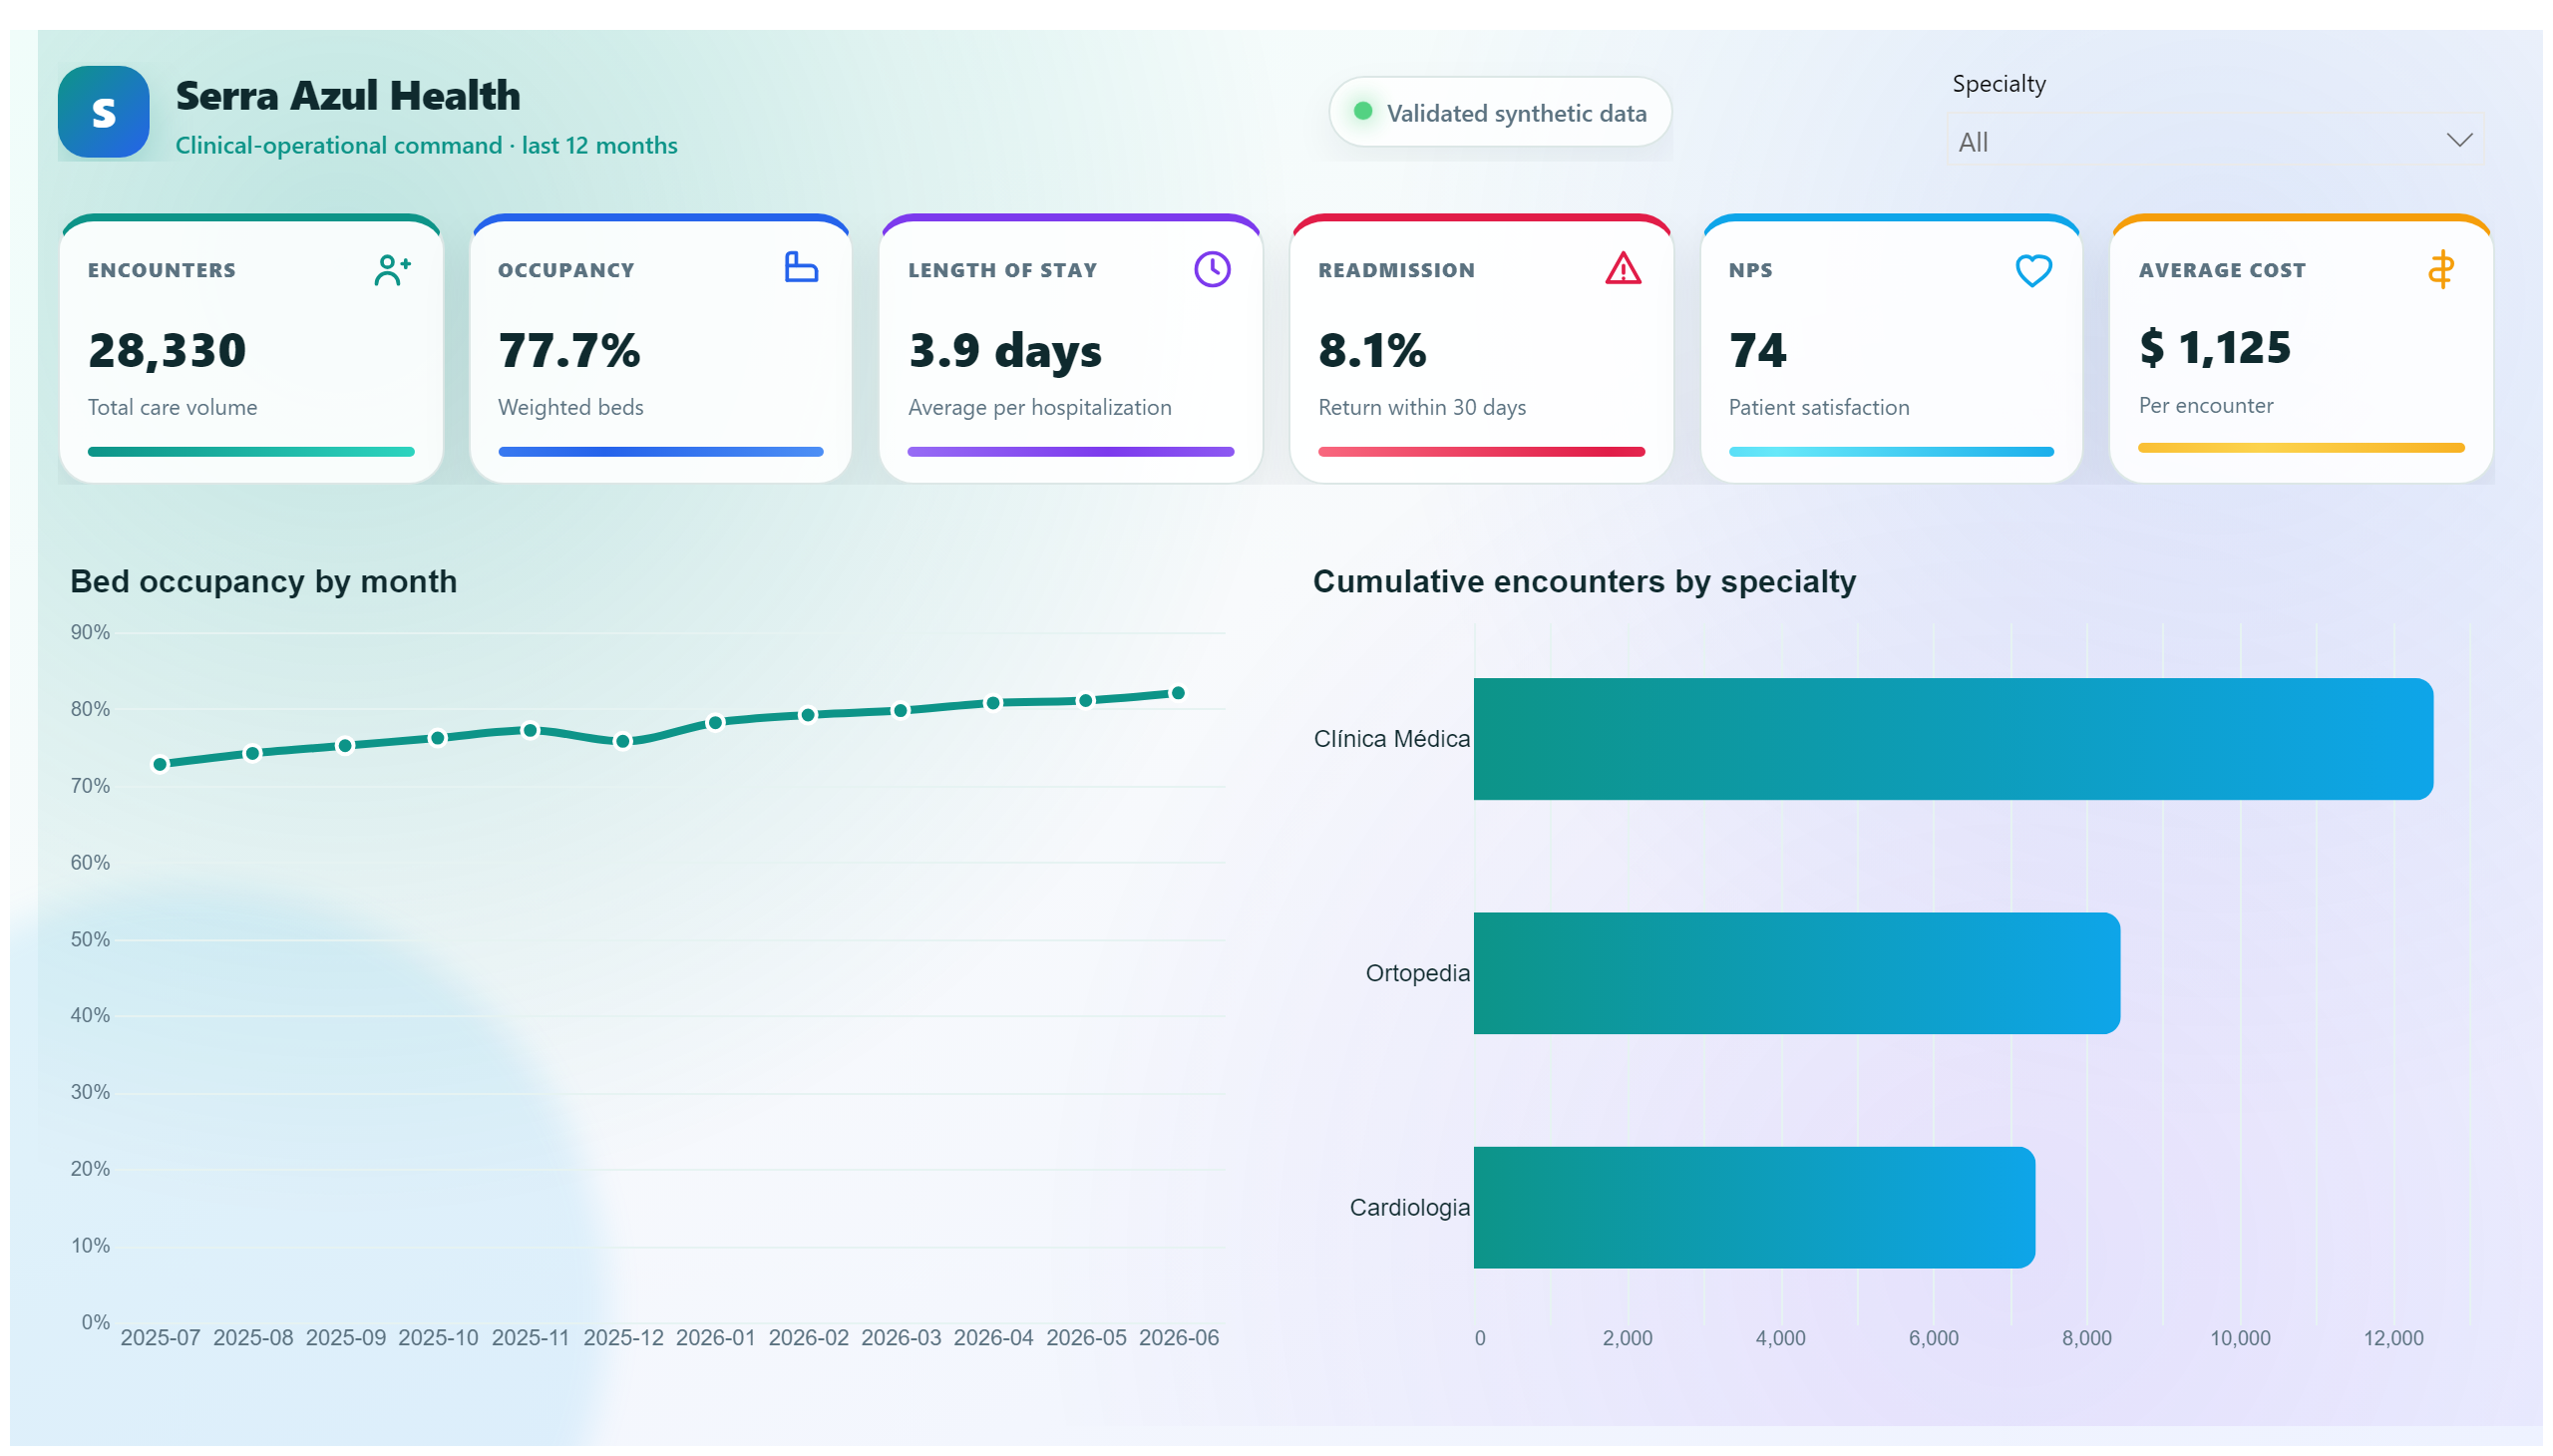
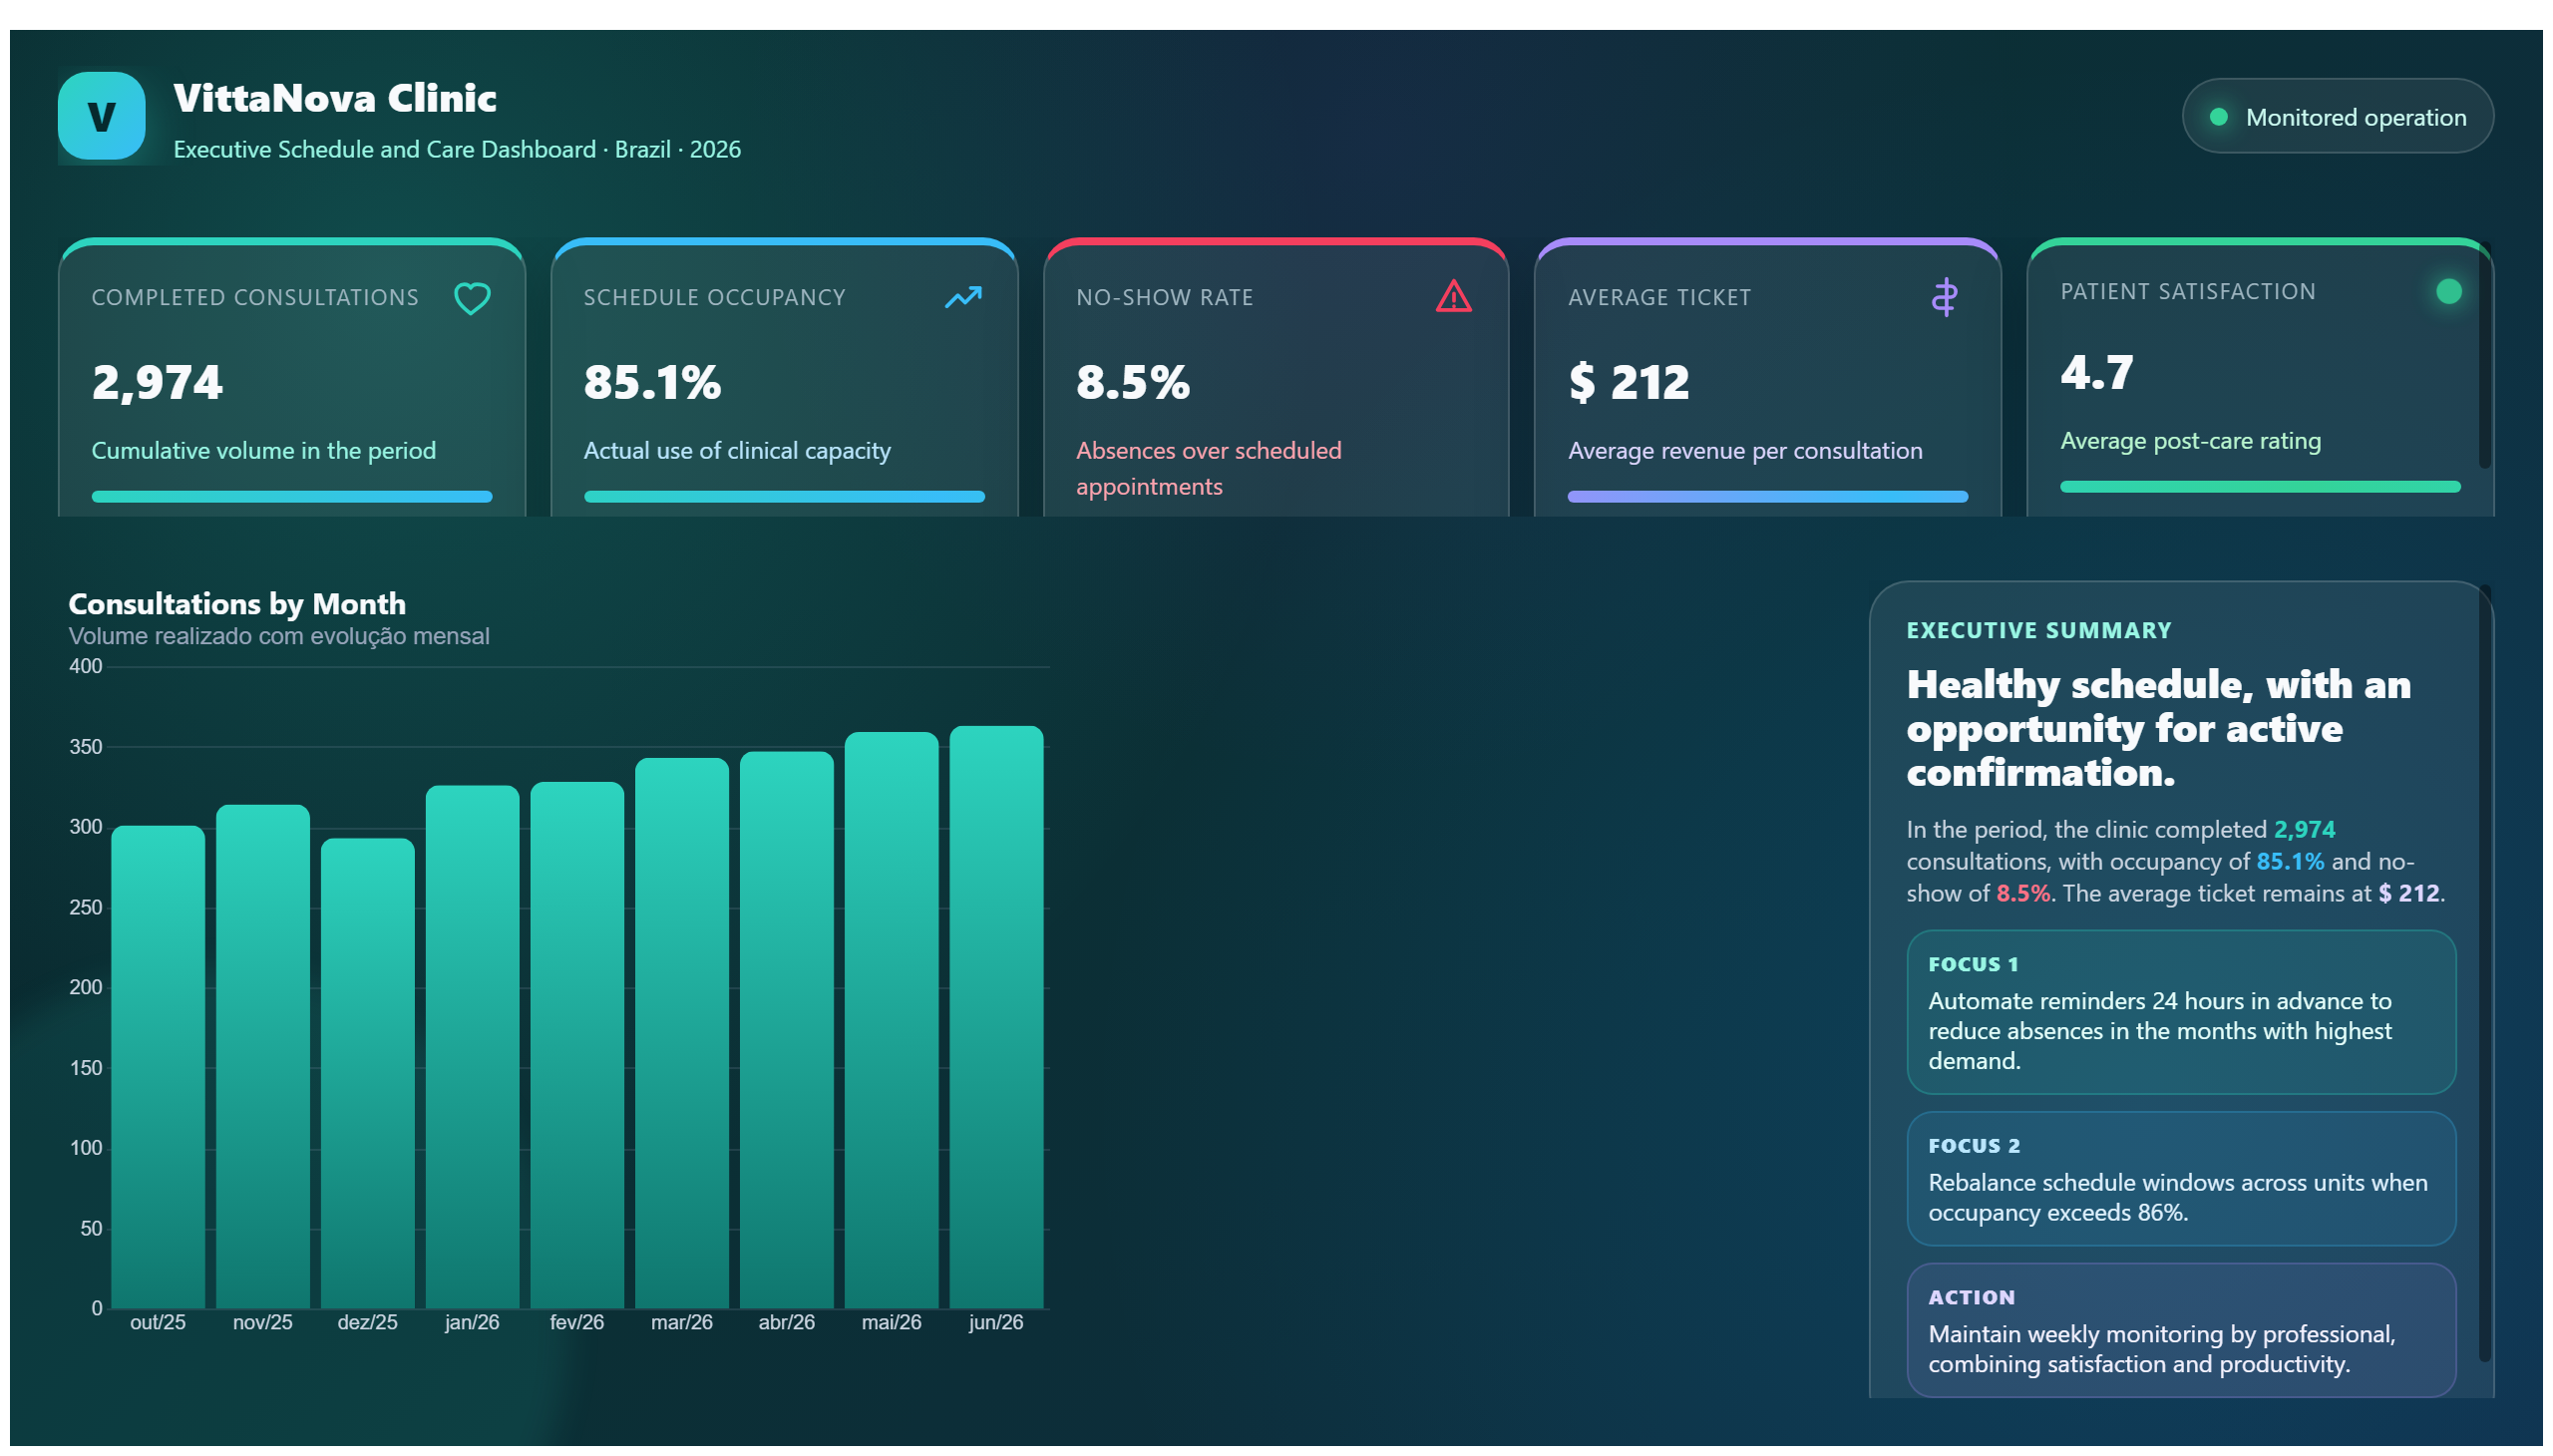
This dashboard provides a comprehensive analysis of a health sector project, focusing on critical aspects and expected outcomes. It offers stakeholders a clear overview of project performance, highlighting key metrics and progress indicators essential for effective decision-making. By visualizing data related to project milestones, resource allocation, and impact measures, it enables users to monitor the project's trajectory and identify potential risks or areas for improvement.
The dashboard addresses important business questions such as: How is the project progressing against its planned goals? What are the critical factors influencing success or delays? What outcomes can be anticipated based on current trends? It is designed for healthcare managers, project coordinators, and data analysts who require actionable insights to optimize project delivery and ensure alignment with strategic objectives.
Frequently asked questions about this dashboard
What key metrics does the Health project dashboard track?
The dashboard tracks critical aspects such as project milestones, resource allocation, and expected outcomes to provide a clear picture of project performance.
Who is the primary audience for this dashboard?
Healthcare managers, project coordinators, and data analysts who need to monitor project progress and make informed decisions.
How does this dashboard support decision-making in health projects?
By visualizing progress and critical factors, it helps identify risks and areas for improvement, enabling timely interventions to achieve project goals.
Want a dashboard like this with your data?
We build a custom version for your business — US$ 50 per page, delivered within 7 calendar days.
Healthcare Power BI templates
Complete projects built by the Excelverton factory: view them live with a free account and download the PBIP as a channel subscriber (1/month) or Pro subscriber (unlimited).
Create your free account
Save favorites, build collections and use the AI assistant — at no cost.