Dashboard preview
FrotasLogistica
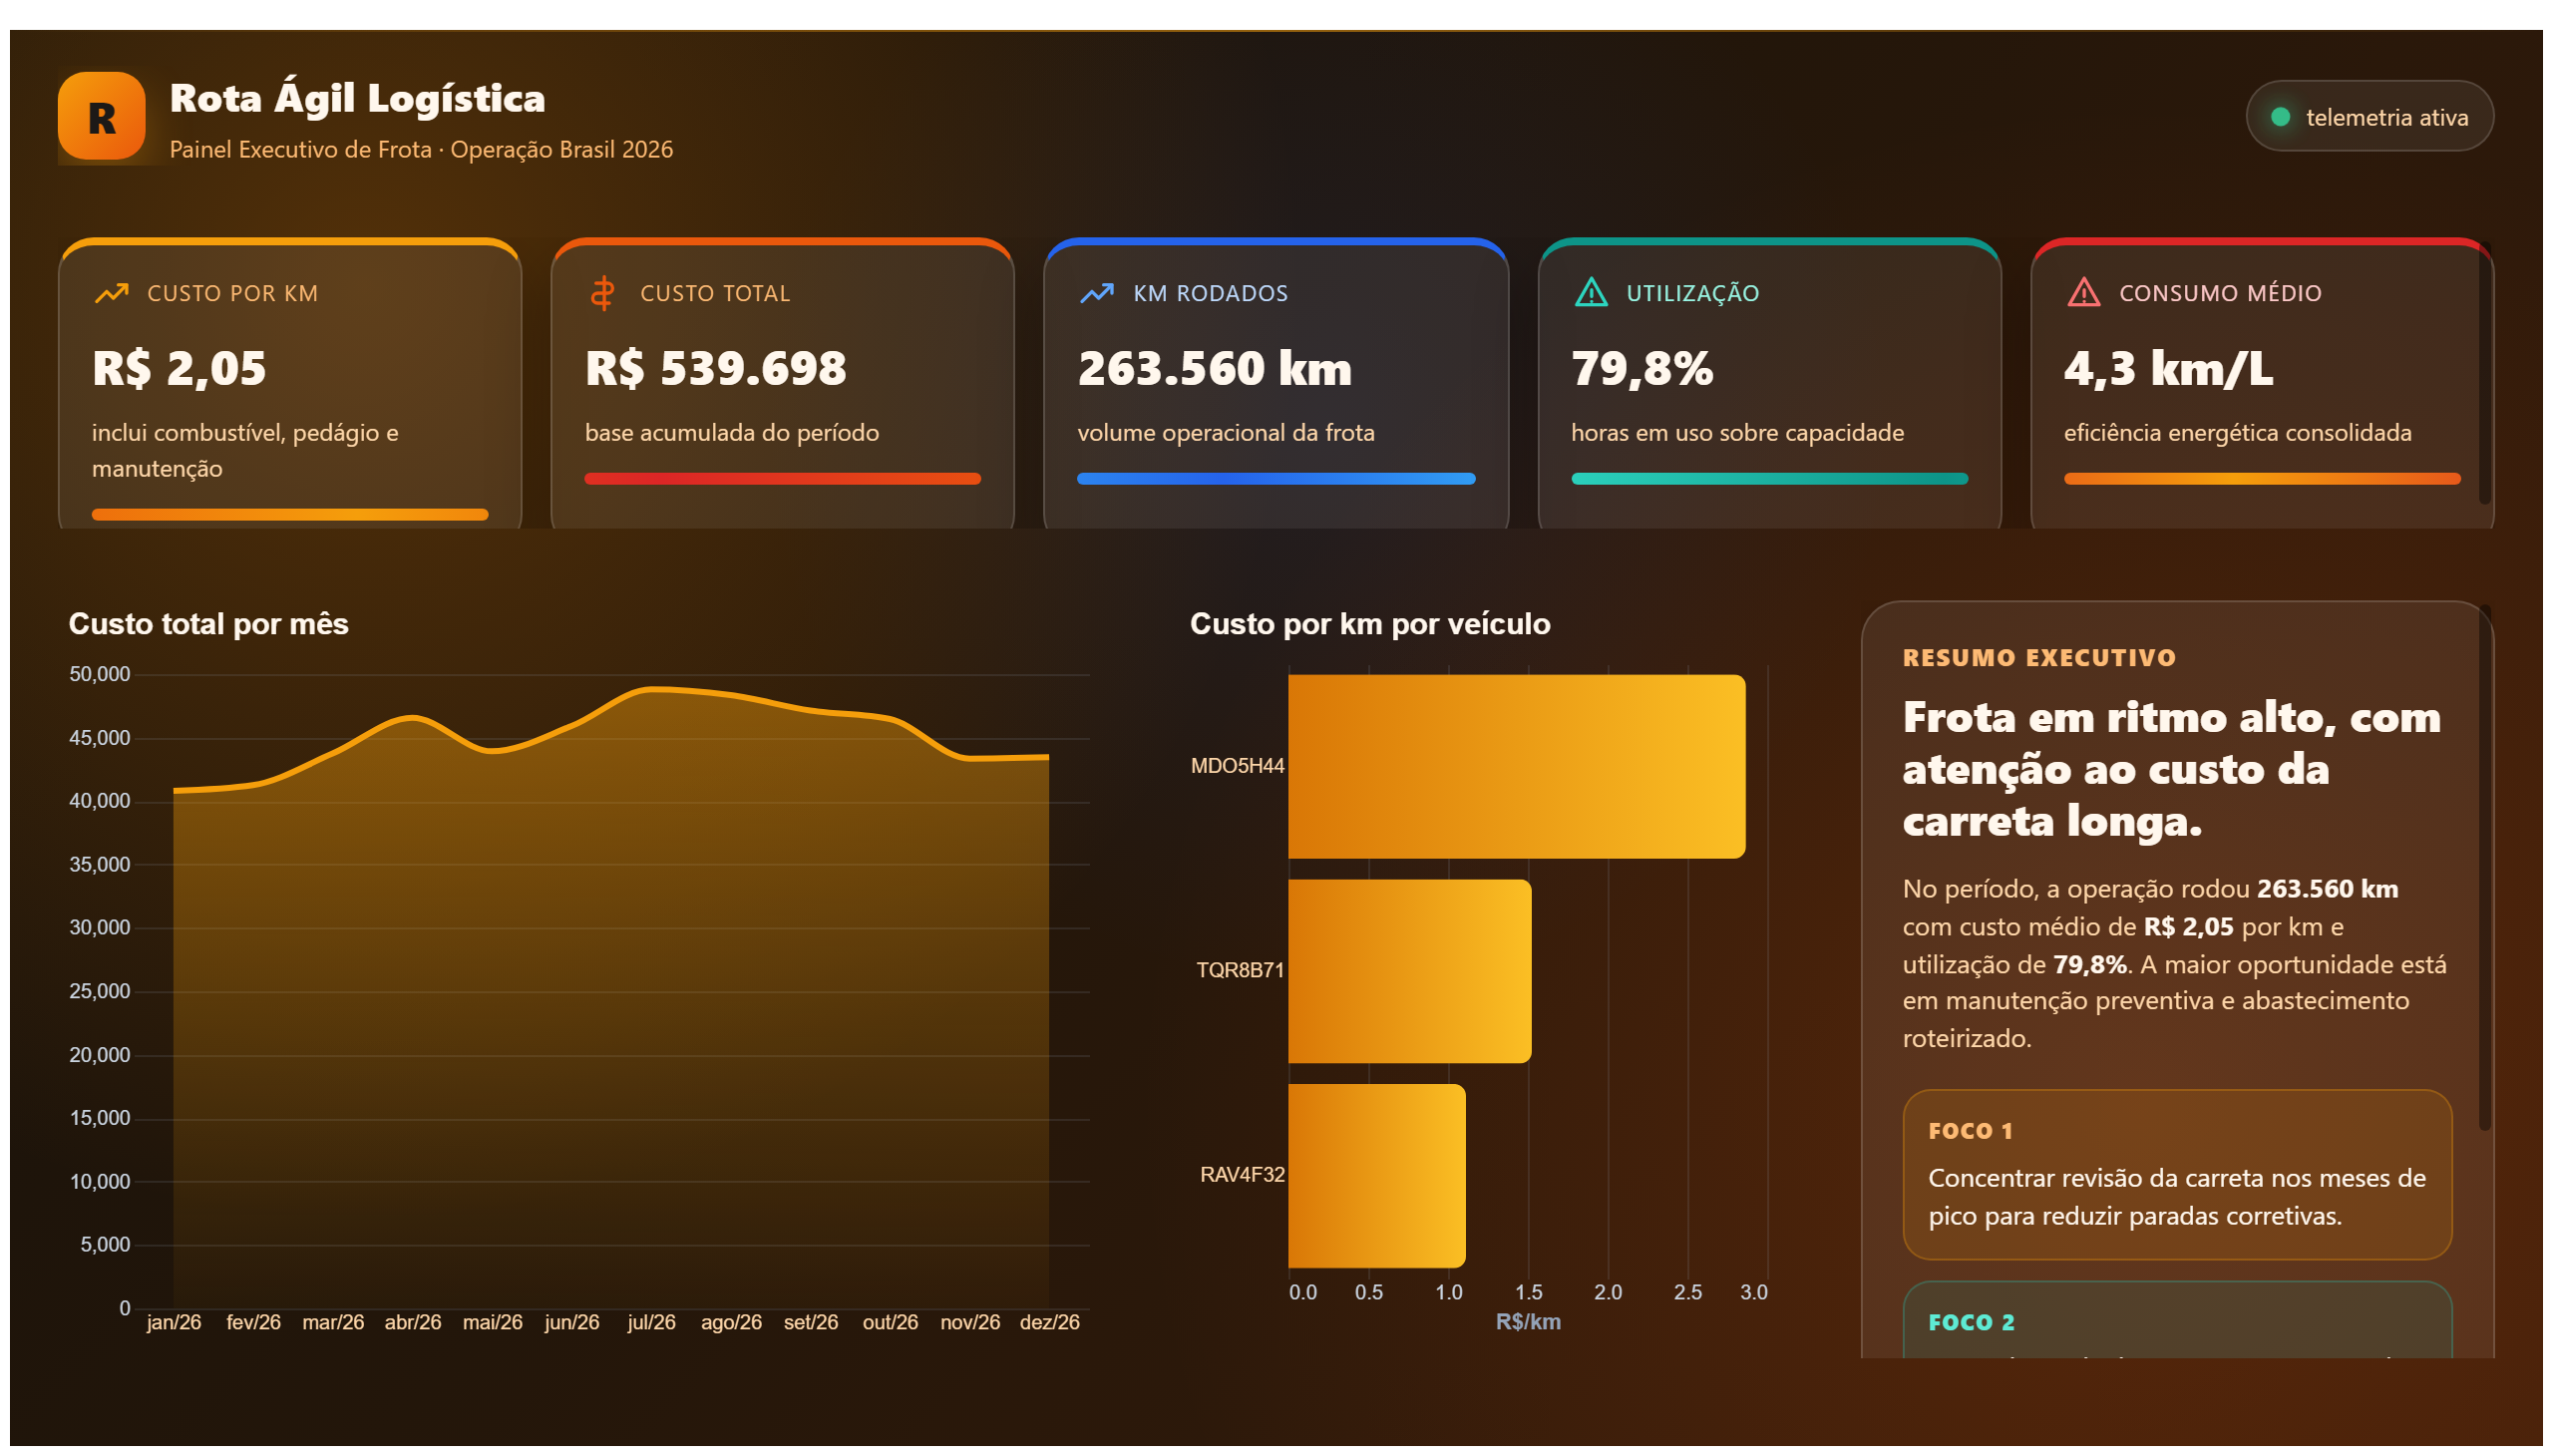
This report analyzes fleet logistics data, including efficiency and costs.
This report analyzes dispatched loads, important for logistics.
Save your favorite dashboards, get new templates by area and ask the AI assistant — for free.
This is a free Power BI dashboard called 4-logistica-cargas-expedidas, in the Logística domain. Explore KPIs, interactive visualizations and get inspired for your own data and business intelligence projects.
This report analyzes dispatched loads, important for logistics.
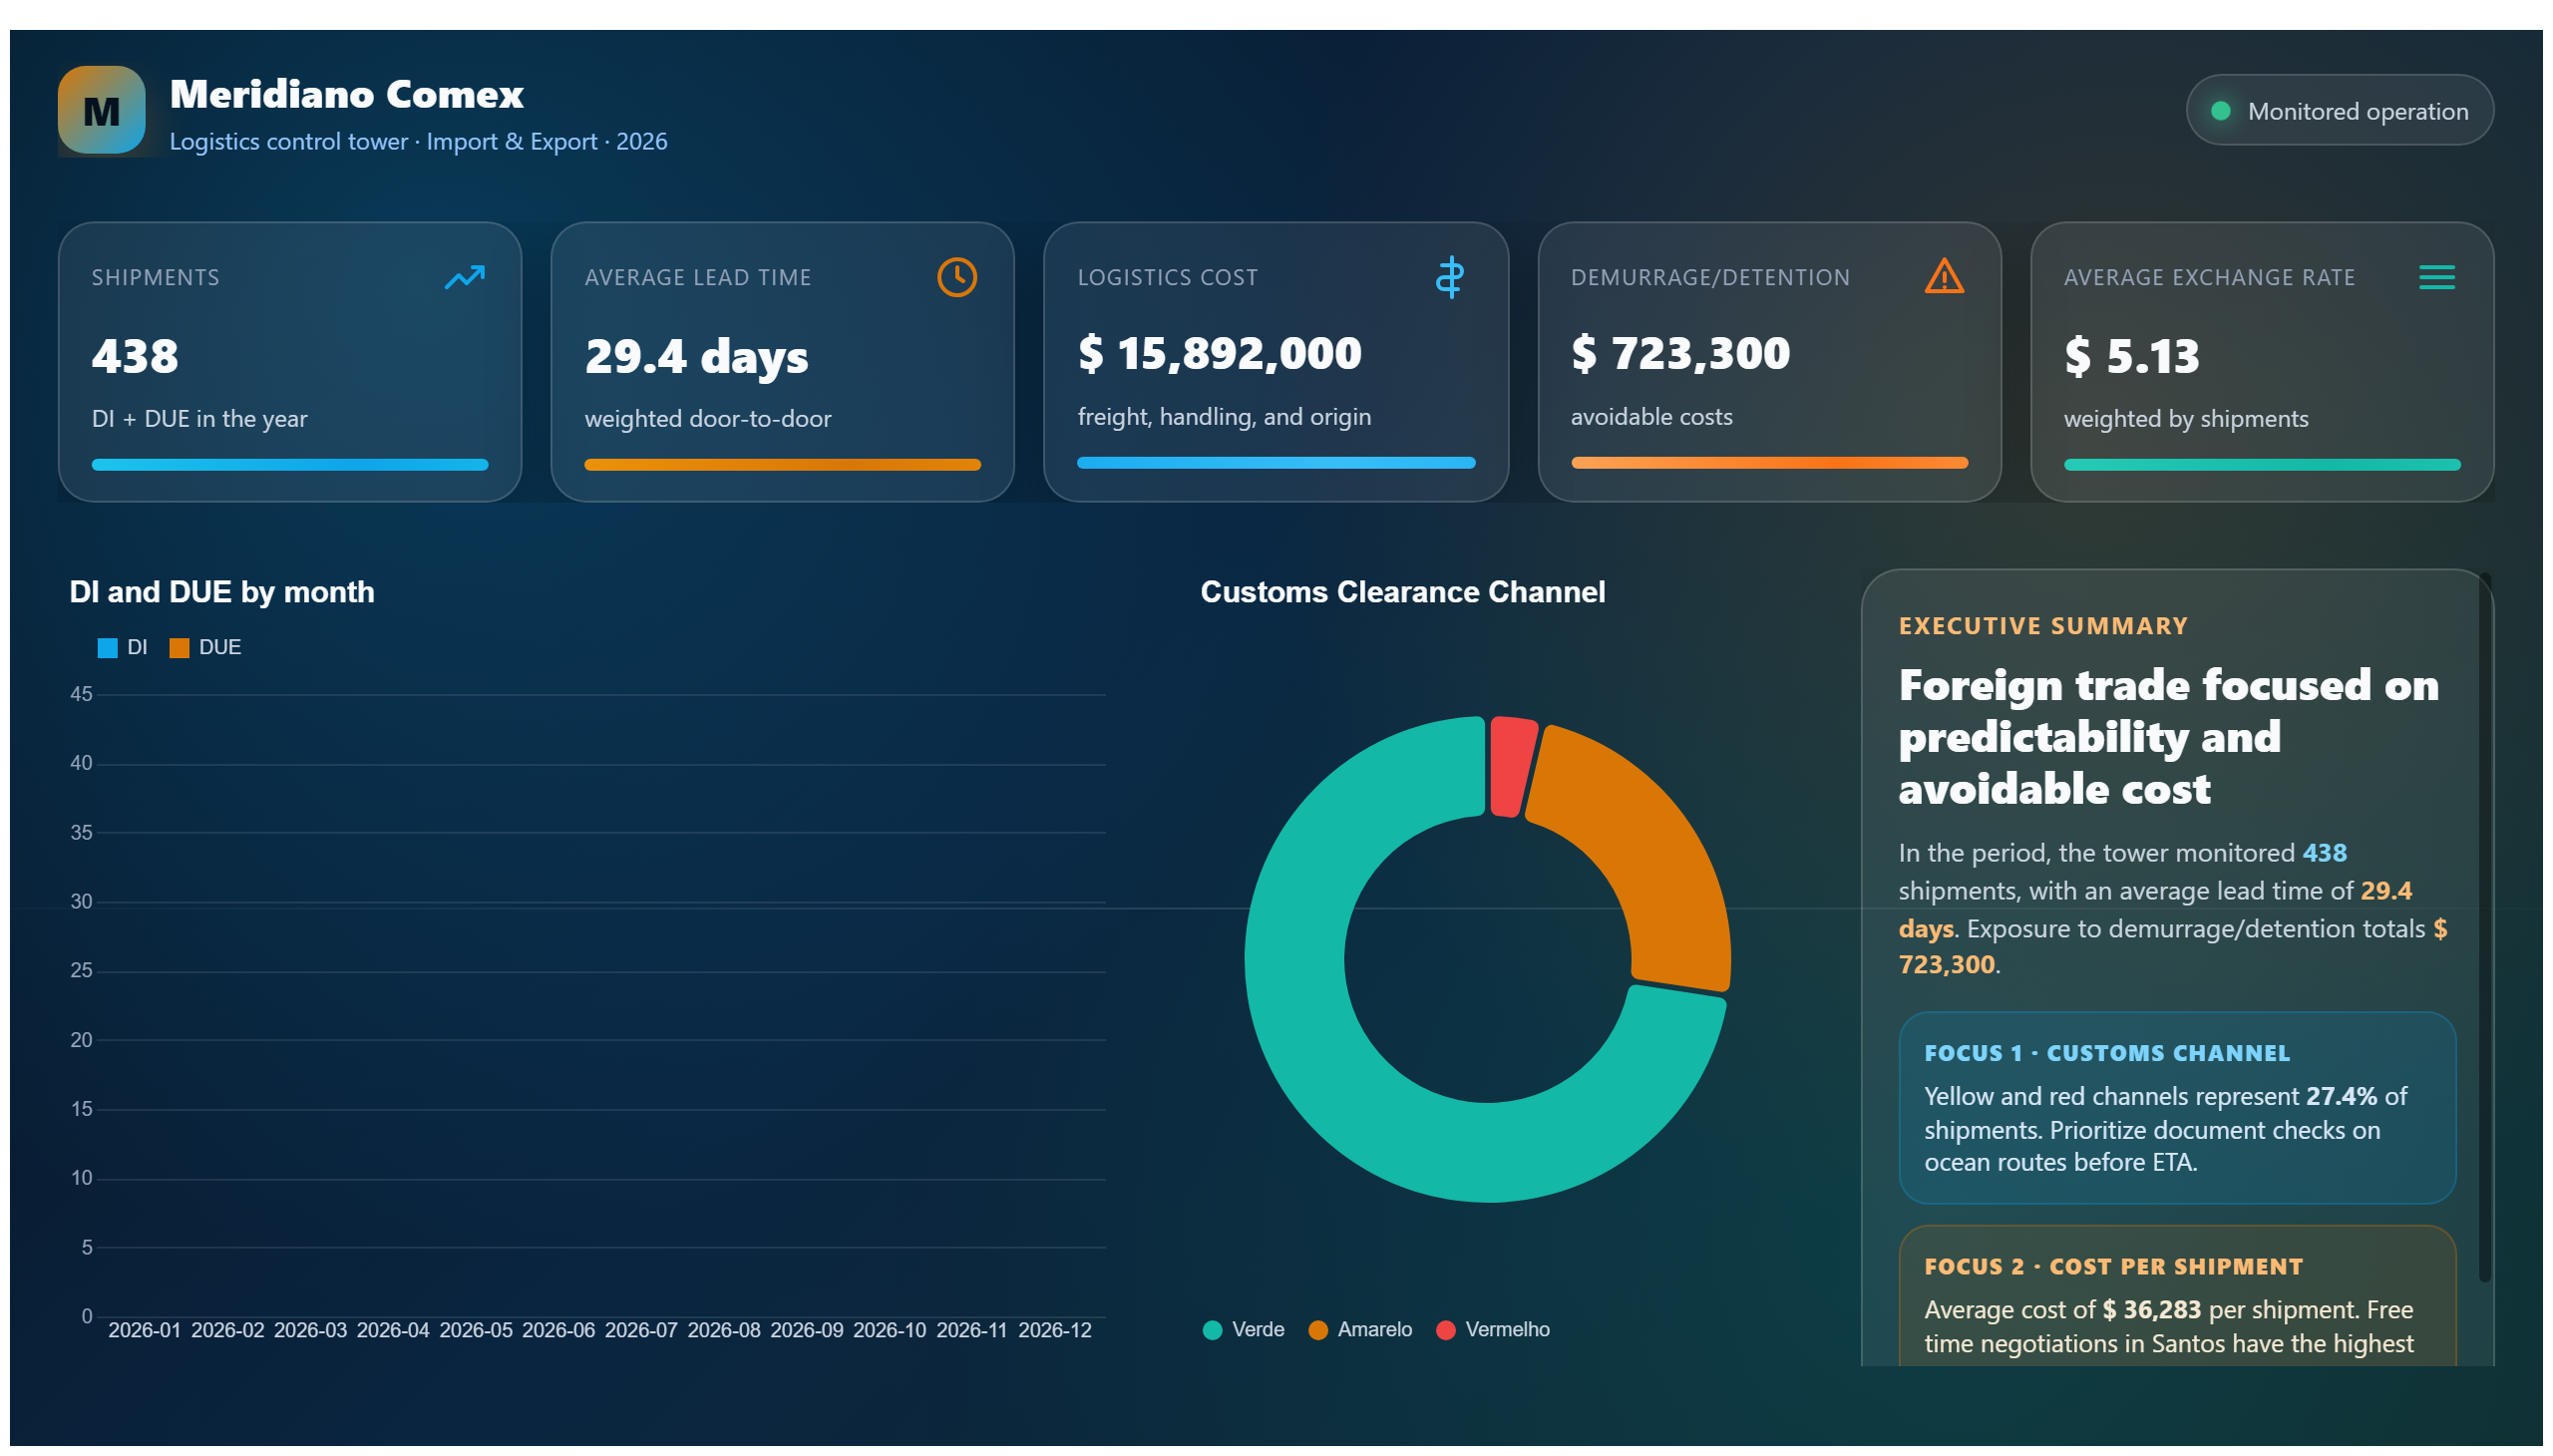
This dashboard provides a comprehensive analysis of dispatched shipments, a critical aspect of logistics operations. It offers insights into the volume, timing, and efficiency of cargo dispatches, enabling logistics managers to monitor and optimize their shipment processes. By visualizing key metrics related to dispatched loads, the dashboard helps identify trends, bottlenecks, and opportunities for improvement in the supply chain.
Business questions addressed by this dashboard include: How many shipments have been dispatched over a given period? Are dispatch volumes meeting planned targets? What are the peak times or days for shipments? This information is crucial for logistics coordinators, supply chain analysts, and operations managers who need to ensure timely delivery and efficient resource allocation.
Overall, the dashboard serves as a decision-support tool to enhance operational efficiency, reduce delays, and improve customer satisfaction by providing clear visibility into the dispatch process.
The dashboard shows key metrics such as the total number of dispatched loads, dispatch frequency over time, and distribution of shipments across different periods.
The dashboard is designed for logistics managers, supply chain analysts, and operations teams responsible for monitoring and optimizing shipment dispatches.
By providing visibility into shipment volumes and timing, the dashboard helps identify inefficiencies and bottlenecks, enabling teams to make data-driven decisions to streamline dispatch processes.
We build a custom version for your business — US$ 50 per page, delivered within 7 calendar days.
Complete projects built by the Excelverton factory: view them live with a free account and download the PBIP as a channel subscriber (1/month) or Pro subscriber (unlimited).
Save favorites, build collections and use the AI assistant — at no cost.