House Sales Analysis Dashboard PBIX
This dashboard analyzes house sales, offering insights into the real estate market.
Create a free account
Save your favorite dashboards, get new templates by area and ask the AI assistant — for free.
About the House Sales Analysis Dashboard PBIX dashboard
This is a free Power BI dashboard called House Sales Analysis Dashboard PBIX, in the Financeiro domain. Explore KPIs, interactive visualizations and get inspired for your own data and business intelligence projects.
This dashboard analyzes house sales, offering insights into the real estate market.
Dashboard analysis
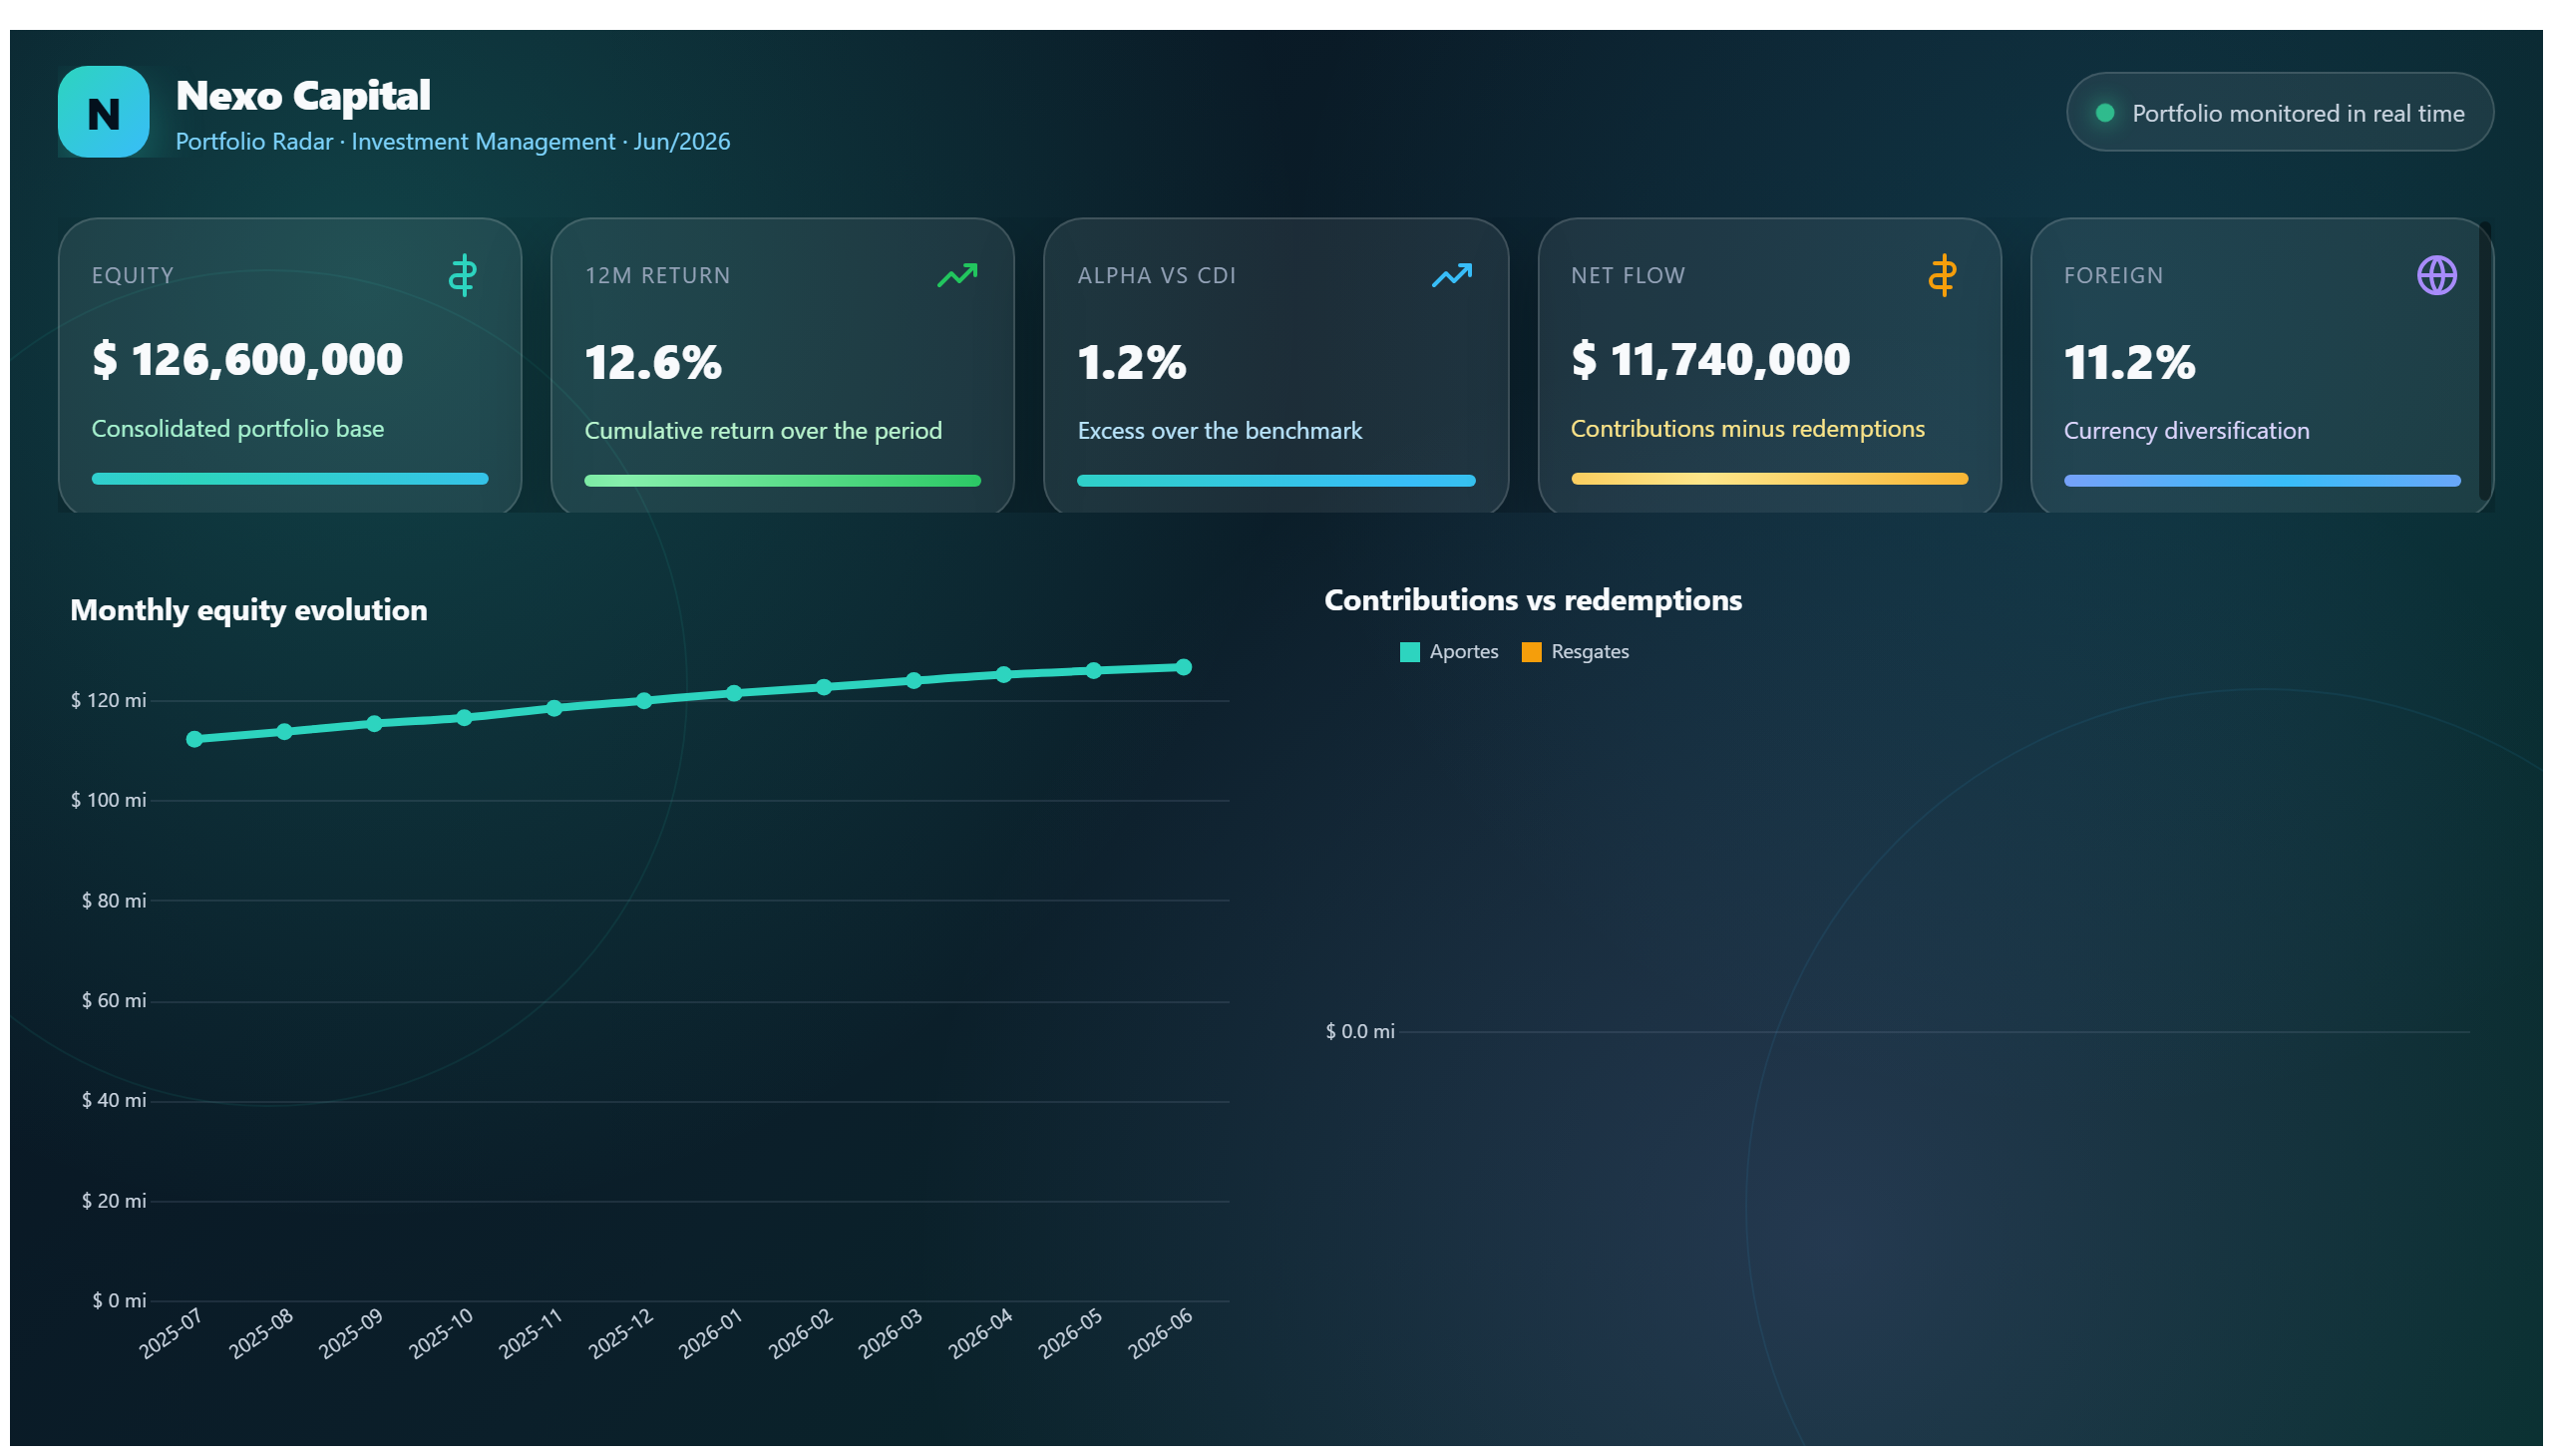
The House Sales Analysis Dashboard PBIX provides a comprehensive overview of the housing market by analyzing house sales data. It offers valuable insights into sales trends, price fluctuations, and market dynamics, enabling users to understand how the real estate market is performing over time. The dashboard is designed to highlight key metrics such as total sales volume, average sale prices, and regional performance, helping stakeholders identify patterns and opportunities.
This dashboard is particularly useful for real estate professionals, financial analysts, and investors who need to make informed decisions based on market behavior. It answers critical business questions such as which regions are experiencing growth, how prices are evolving, and what the overall sales performance looks like. By providing a clear visualization of these factors, users can strategize better, optimize investments, and anticipate market shifts effectively.
Frequently asked questions about this dashboard
What key metrics does the House Sales Analysis Dashboard display?
The dashboard displays key metrics including total sales volume, average sale prices, and regional sales performance.
Who is the primary audience for this dashboard?
The primary audience includes real estate professionals, financial analysts, and investors interested in housing market trends.
What business questions can this dashboard help answer?
It helps answer questions about market growth regions, price trends, and overall sales performance in the real estate sector.
Want a dashboard like this with your data?
We build a custom version for your business — US$ 50 per page, delivered within 7 calendar days.
Finance Power BI templates
Complete projects built by the Excelverton factory: view them live with a free account and download the PBIP as a channel subscriber (1/month) or Pro subscriber (unlimited).
Create your free account
Save favorites, build collections and use the AI assistant — at no cost.