52nd_lesson_Nurekenov
Report about a specific lesson from an educational project.
Create a free account
Save your favorite dashboards, get new templates by area and ask the AI assistant — for free.
About the 52nd_lesson_Nurekenov dashboard
This is a free Power BI dashboard called 52nd_lesson_Nurekenov, in the Educação domain. Explore KPIs, interactive visualizations and get inspired for your own data and business intelligence projects.
Report about a specific lesson from an educational project.
Dashboard analysis
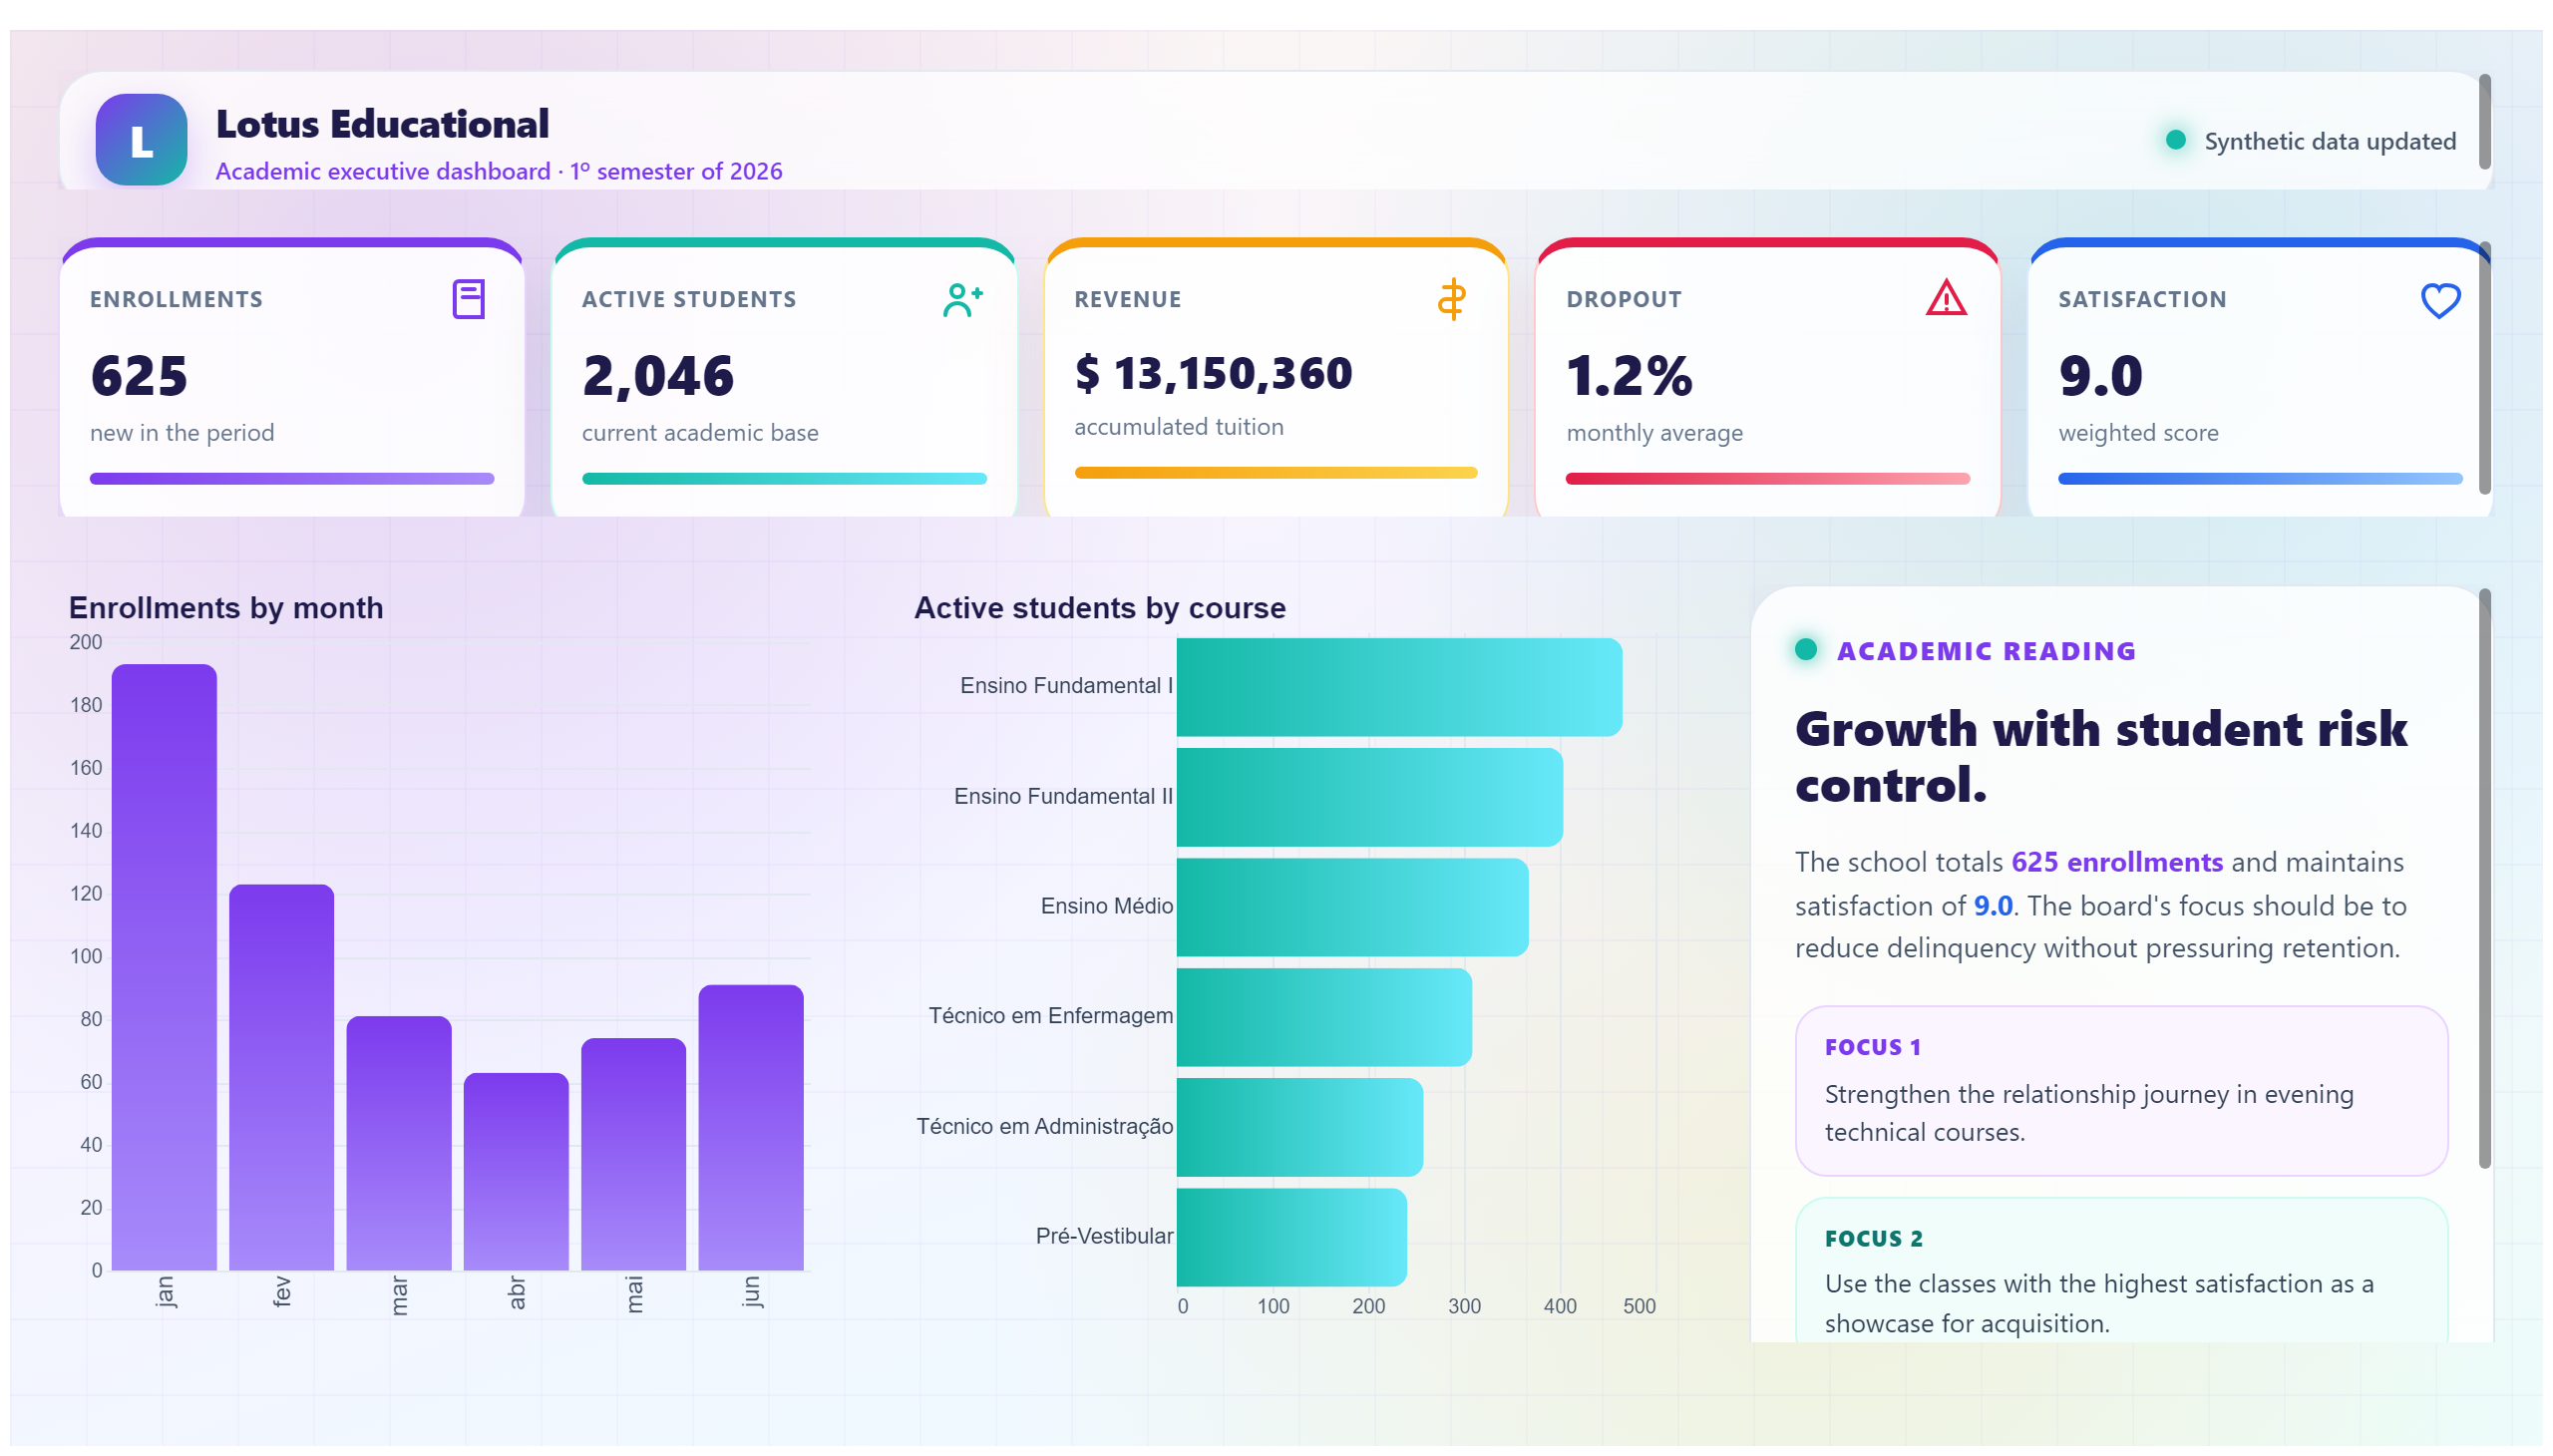
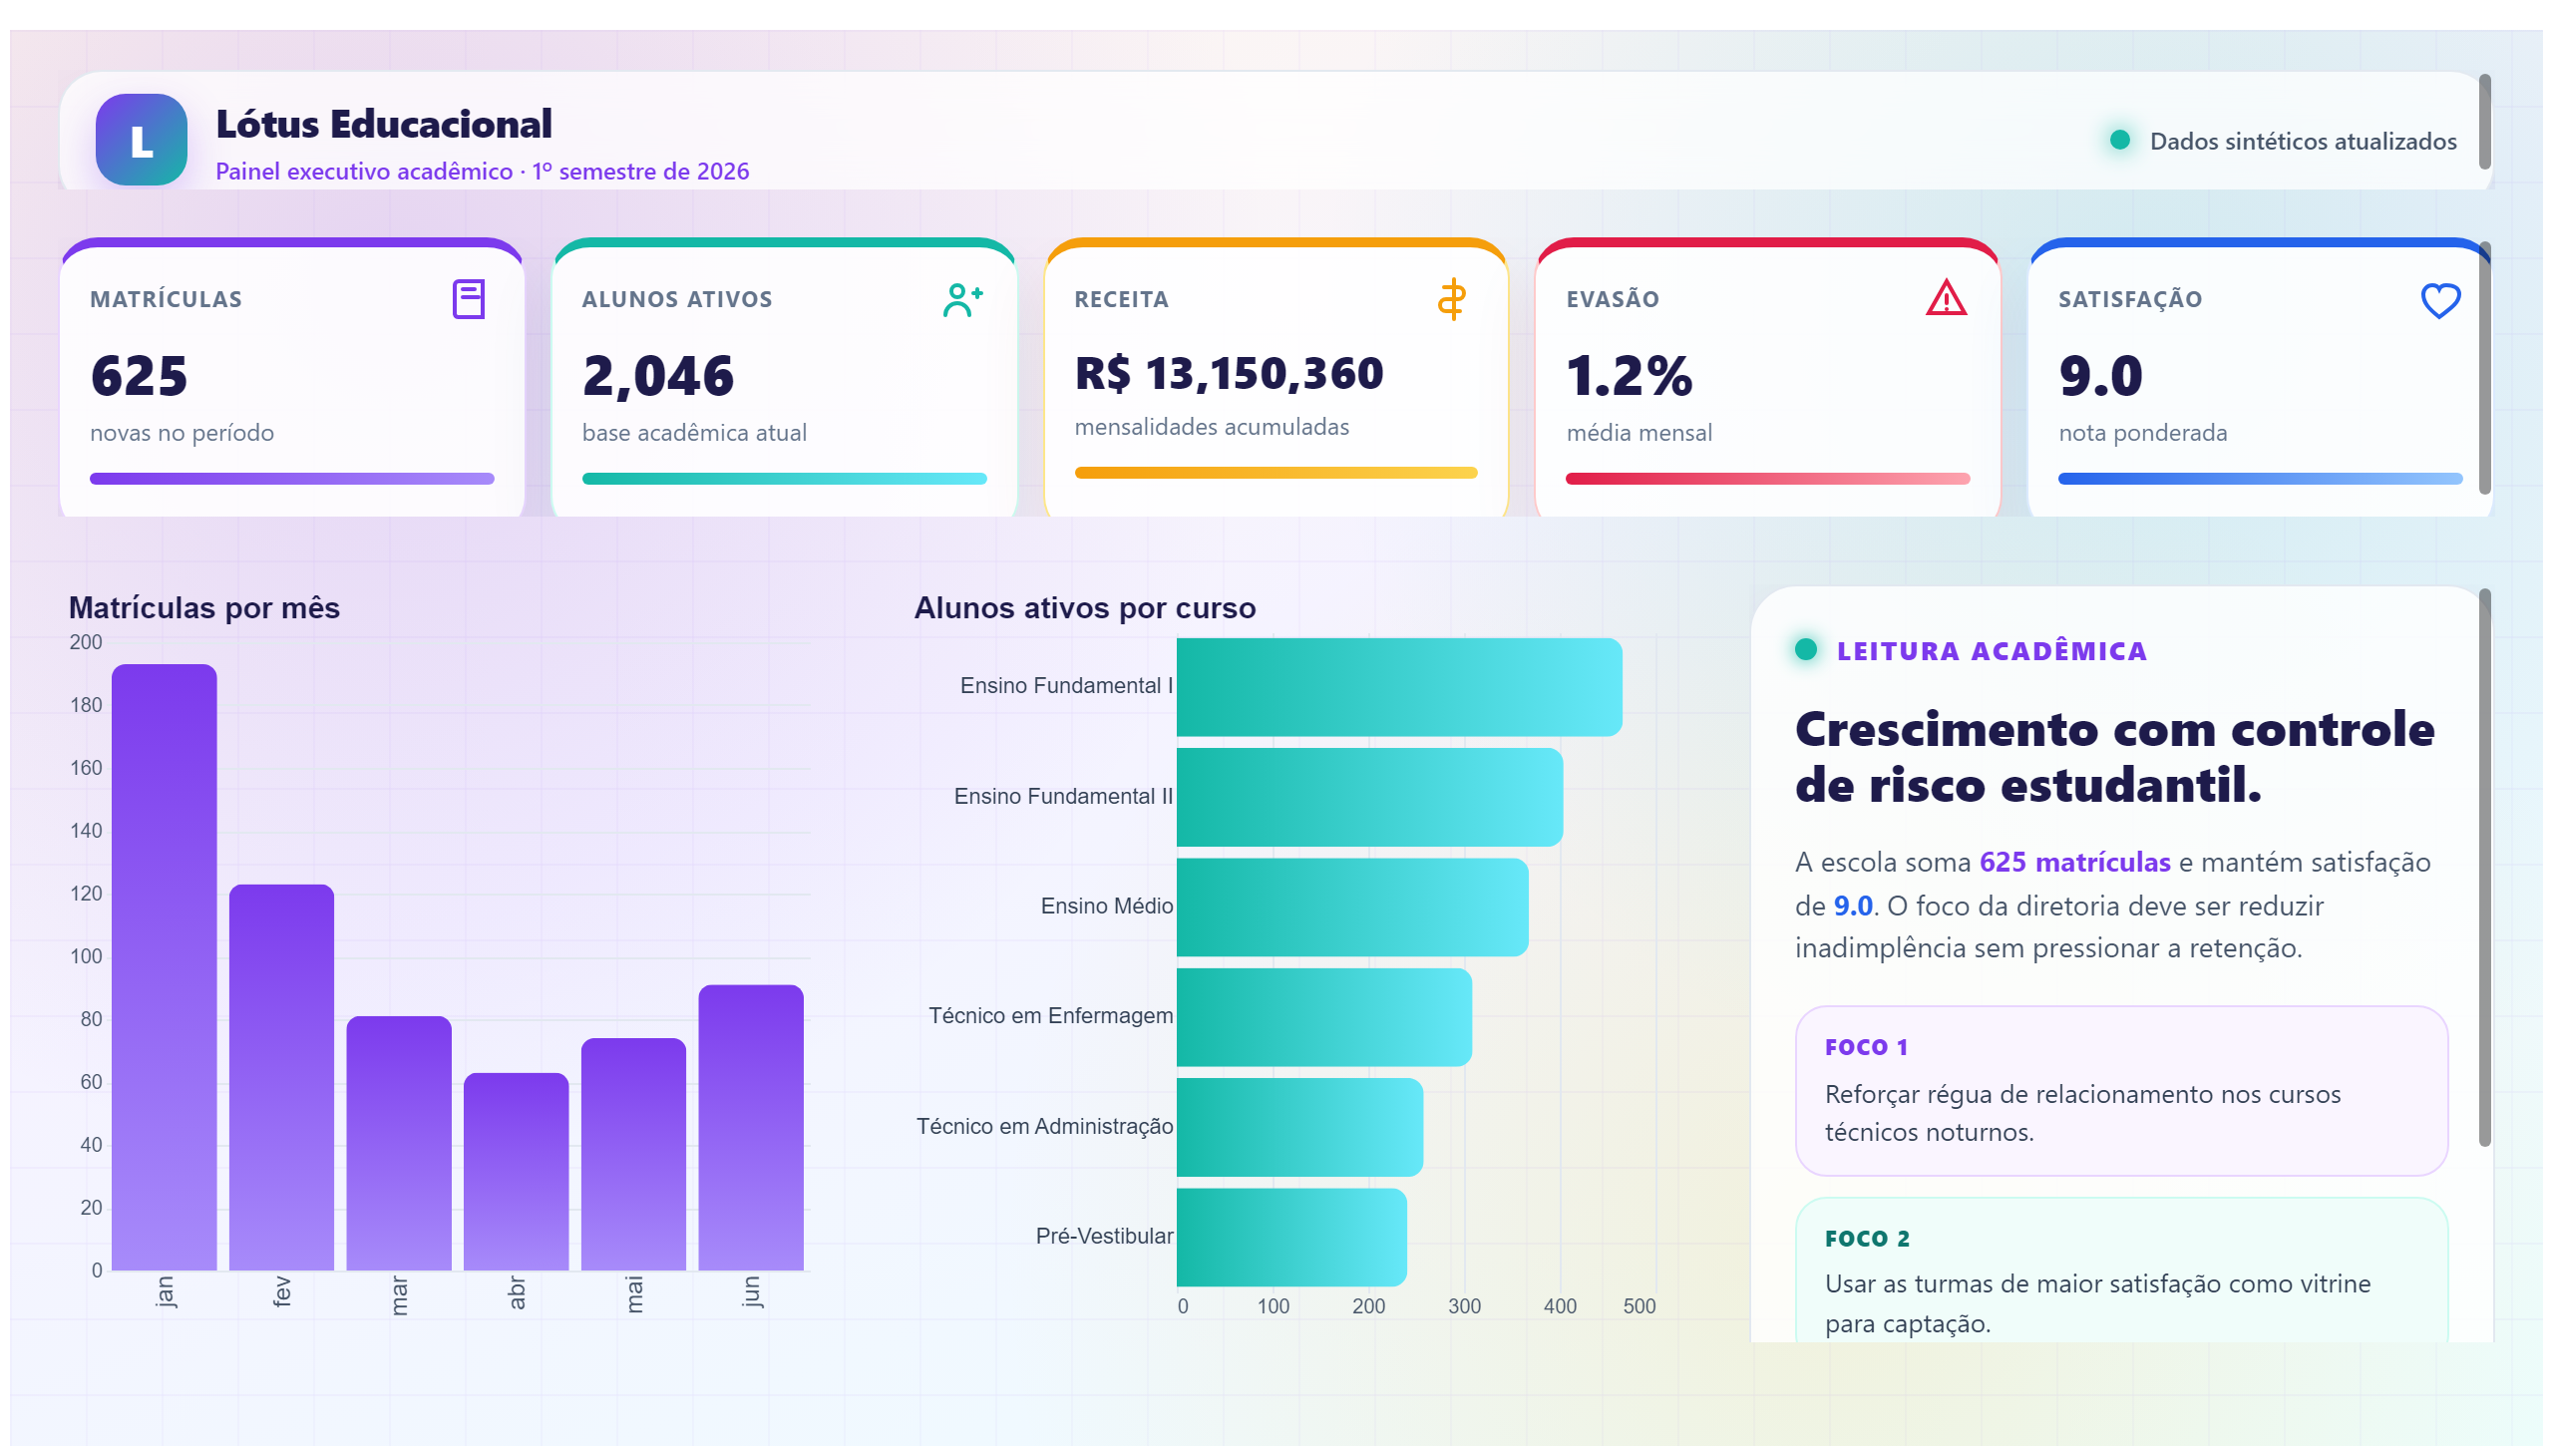
This dashboard provides an in-depth analysis of a specific lesson within an educational project, focusing on the 52nd lesson titled "Nurekenov." It offers detailed insights into the lesson's performance, engagement metrics, and learning outcomes. Educators and project managers can use this report to understand how effectively the lesson meets its educational objectives and identify areas for improvement.
The dashboard answers key business questions such as: How well did students perform in this particular lesson? What engagement levels were observed during the lesson? Are there any patterns or trends that suggest the lesson's strengths or weaknesses? By visualizing these metrics, stakeholders can make data-driven decisions to enhance curriculum design and teaching strategies.
Overall, this report serves educators, curriculum developers, and educational analysts who are involved in monitoring and optimizing the learning experience within the project. It provides a focused view on one lesson, enabling targeted interventions and continuous improvement in educational delivery.
Frequently asked questions about this dashboard
What specific metrics does the 52nd lesson dashboard track?
The dashboard tracks student performance, engagement levels, and learning outcomes related to the 52nd lesson.
Who is the primary audience for this dashboard?
Educators, curriculum developers, and educational analysts involved in the project are the main users of this dashboard.
How can this dashboard help improve the educational project?
By providing detailed insights into the lesson's effectiveness, the dashboard helps stakeholders identify strengths and weaknesses, enabling targeted improvements.
Want a dashboard like this with your data?
We build a custom version for your business — US$ 50 per page, delivered within 7 calendar days.
Education Power BI templates
Complete projects built by the Excelverton factory: view them live with a free account and download the PBIP as a channel subscriber (1/month) or Pro subscriber (unlimited).
Create your free account
Save favorites, build collections and use the AI assistant — at no cost.