American Bank
Report about American Bank, presenting relevant financial and operational data.
Create a free account
Save your favorite dashboards, get new templates by area and ask the AI assistant — for free.
About the American Bank dashboard
This is a free Power BI dashboard called American Bank, in the Financeiro domain. Explore KPIs, interactive visualizations and get inspired for your own data and business intelligence projects.
Report about American Bank, presenting relevant financial and operational data.
Dashboard analysis
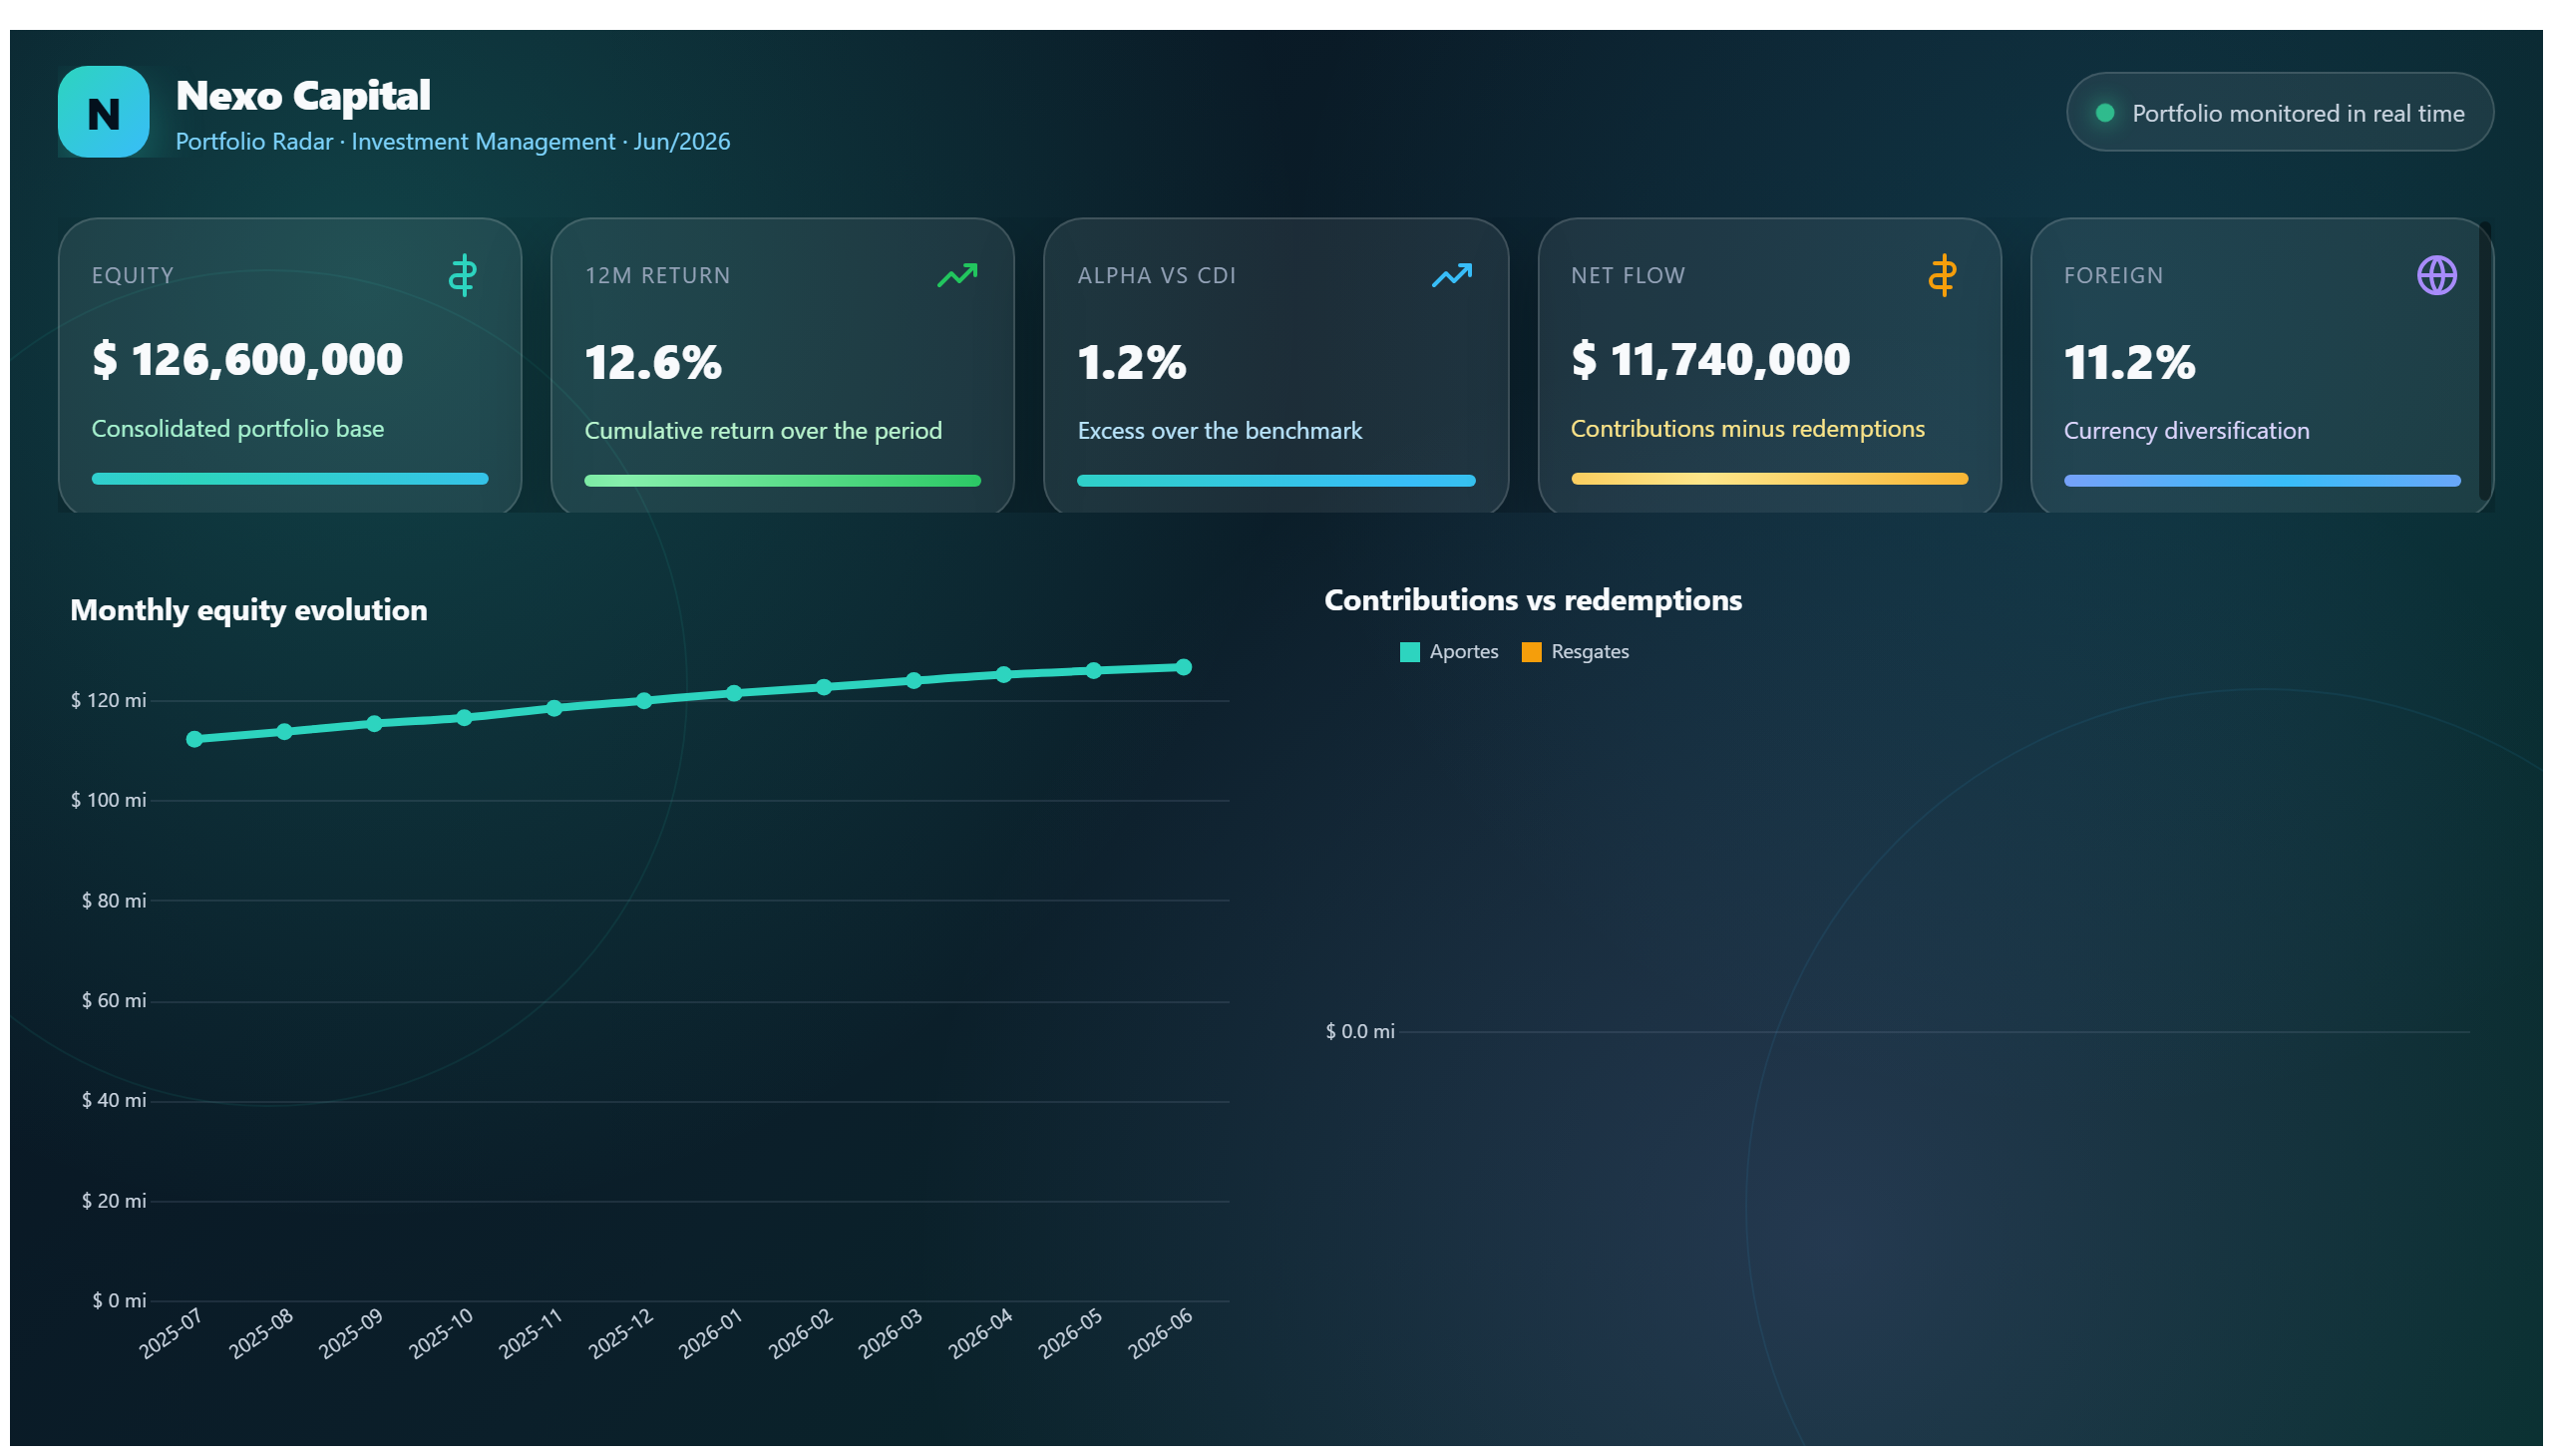
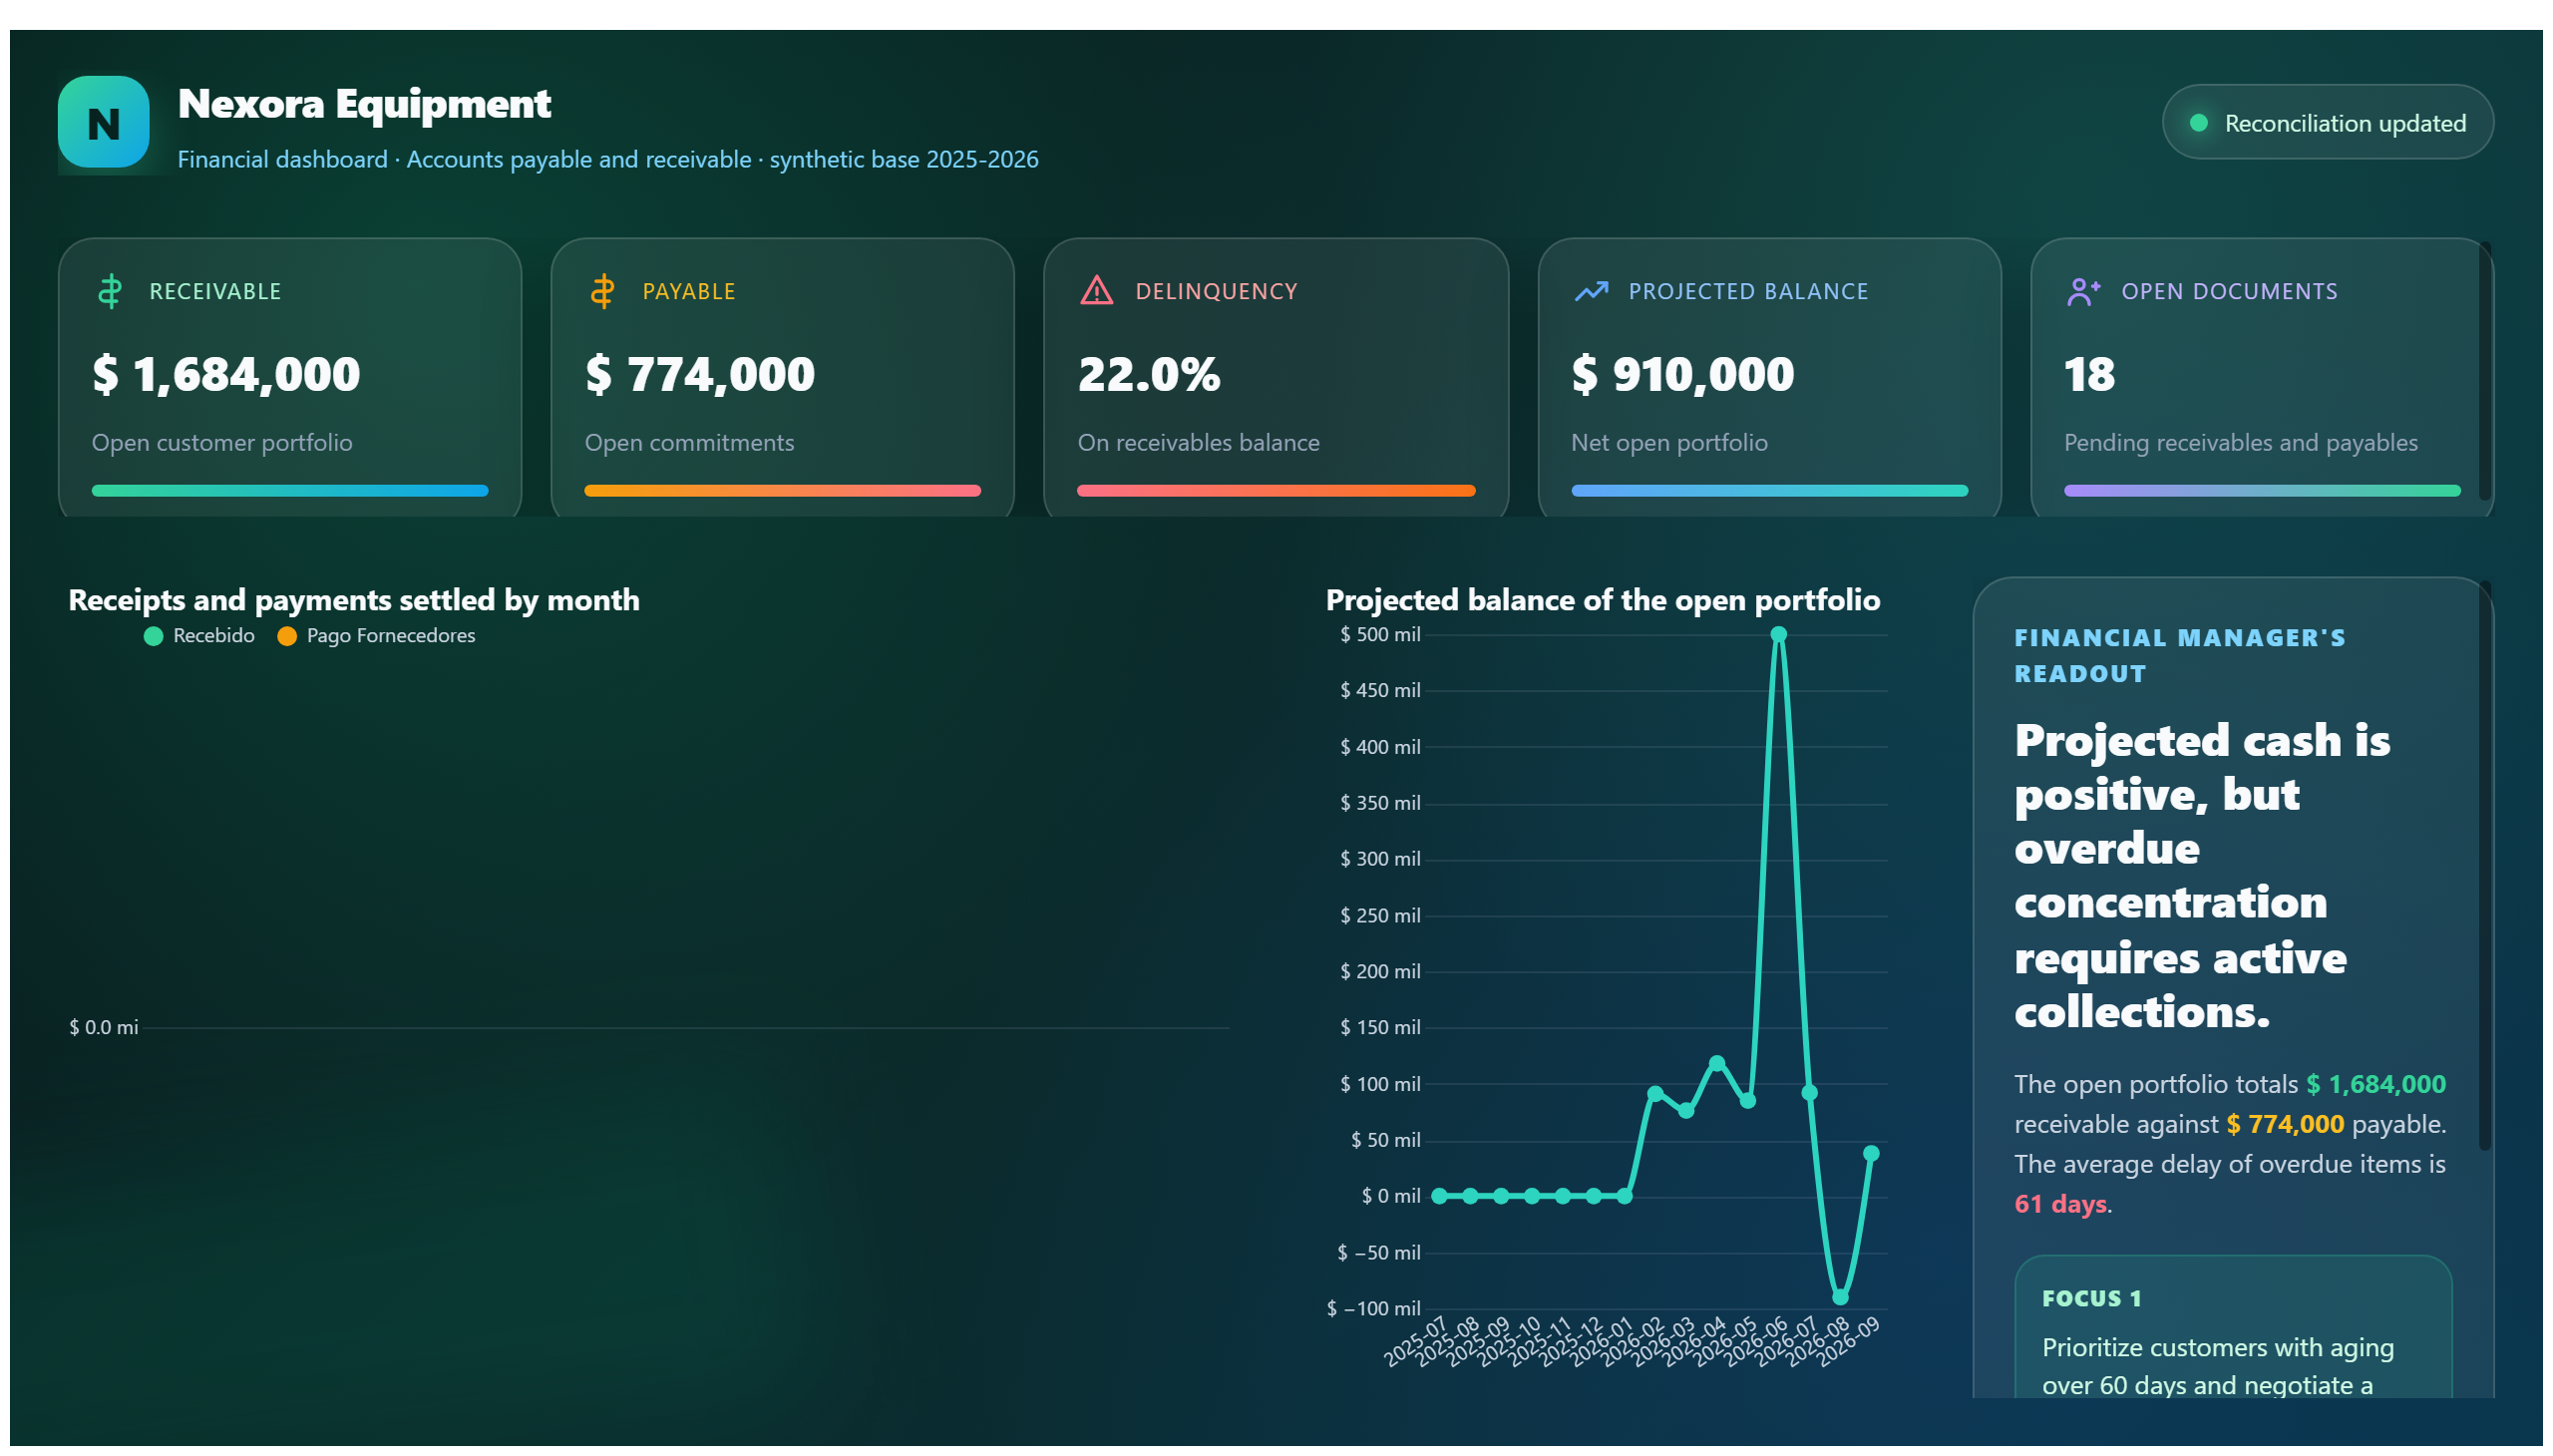
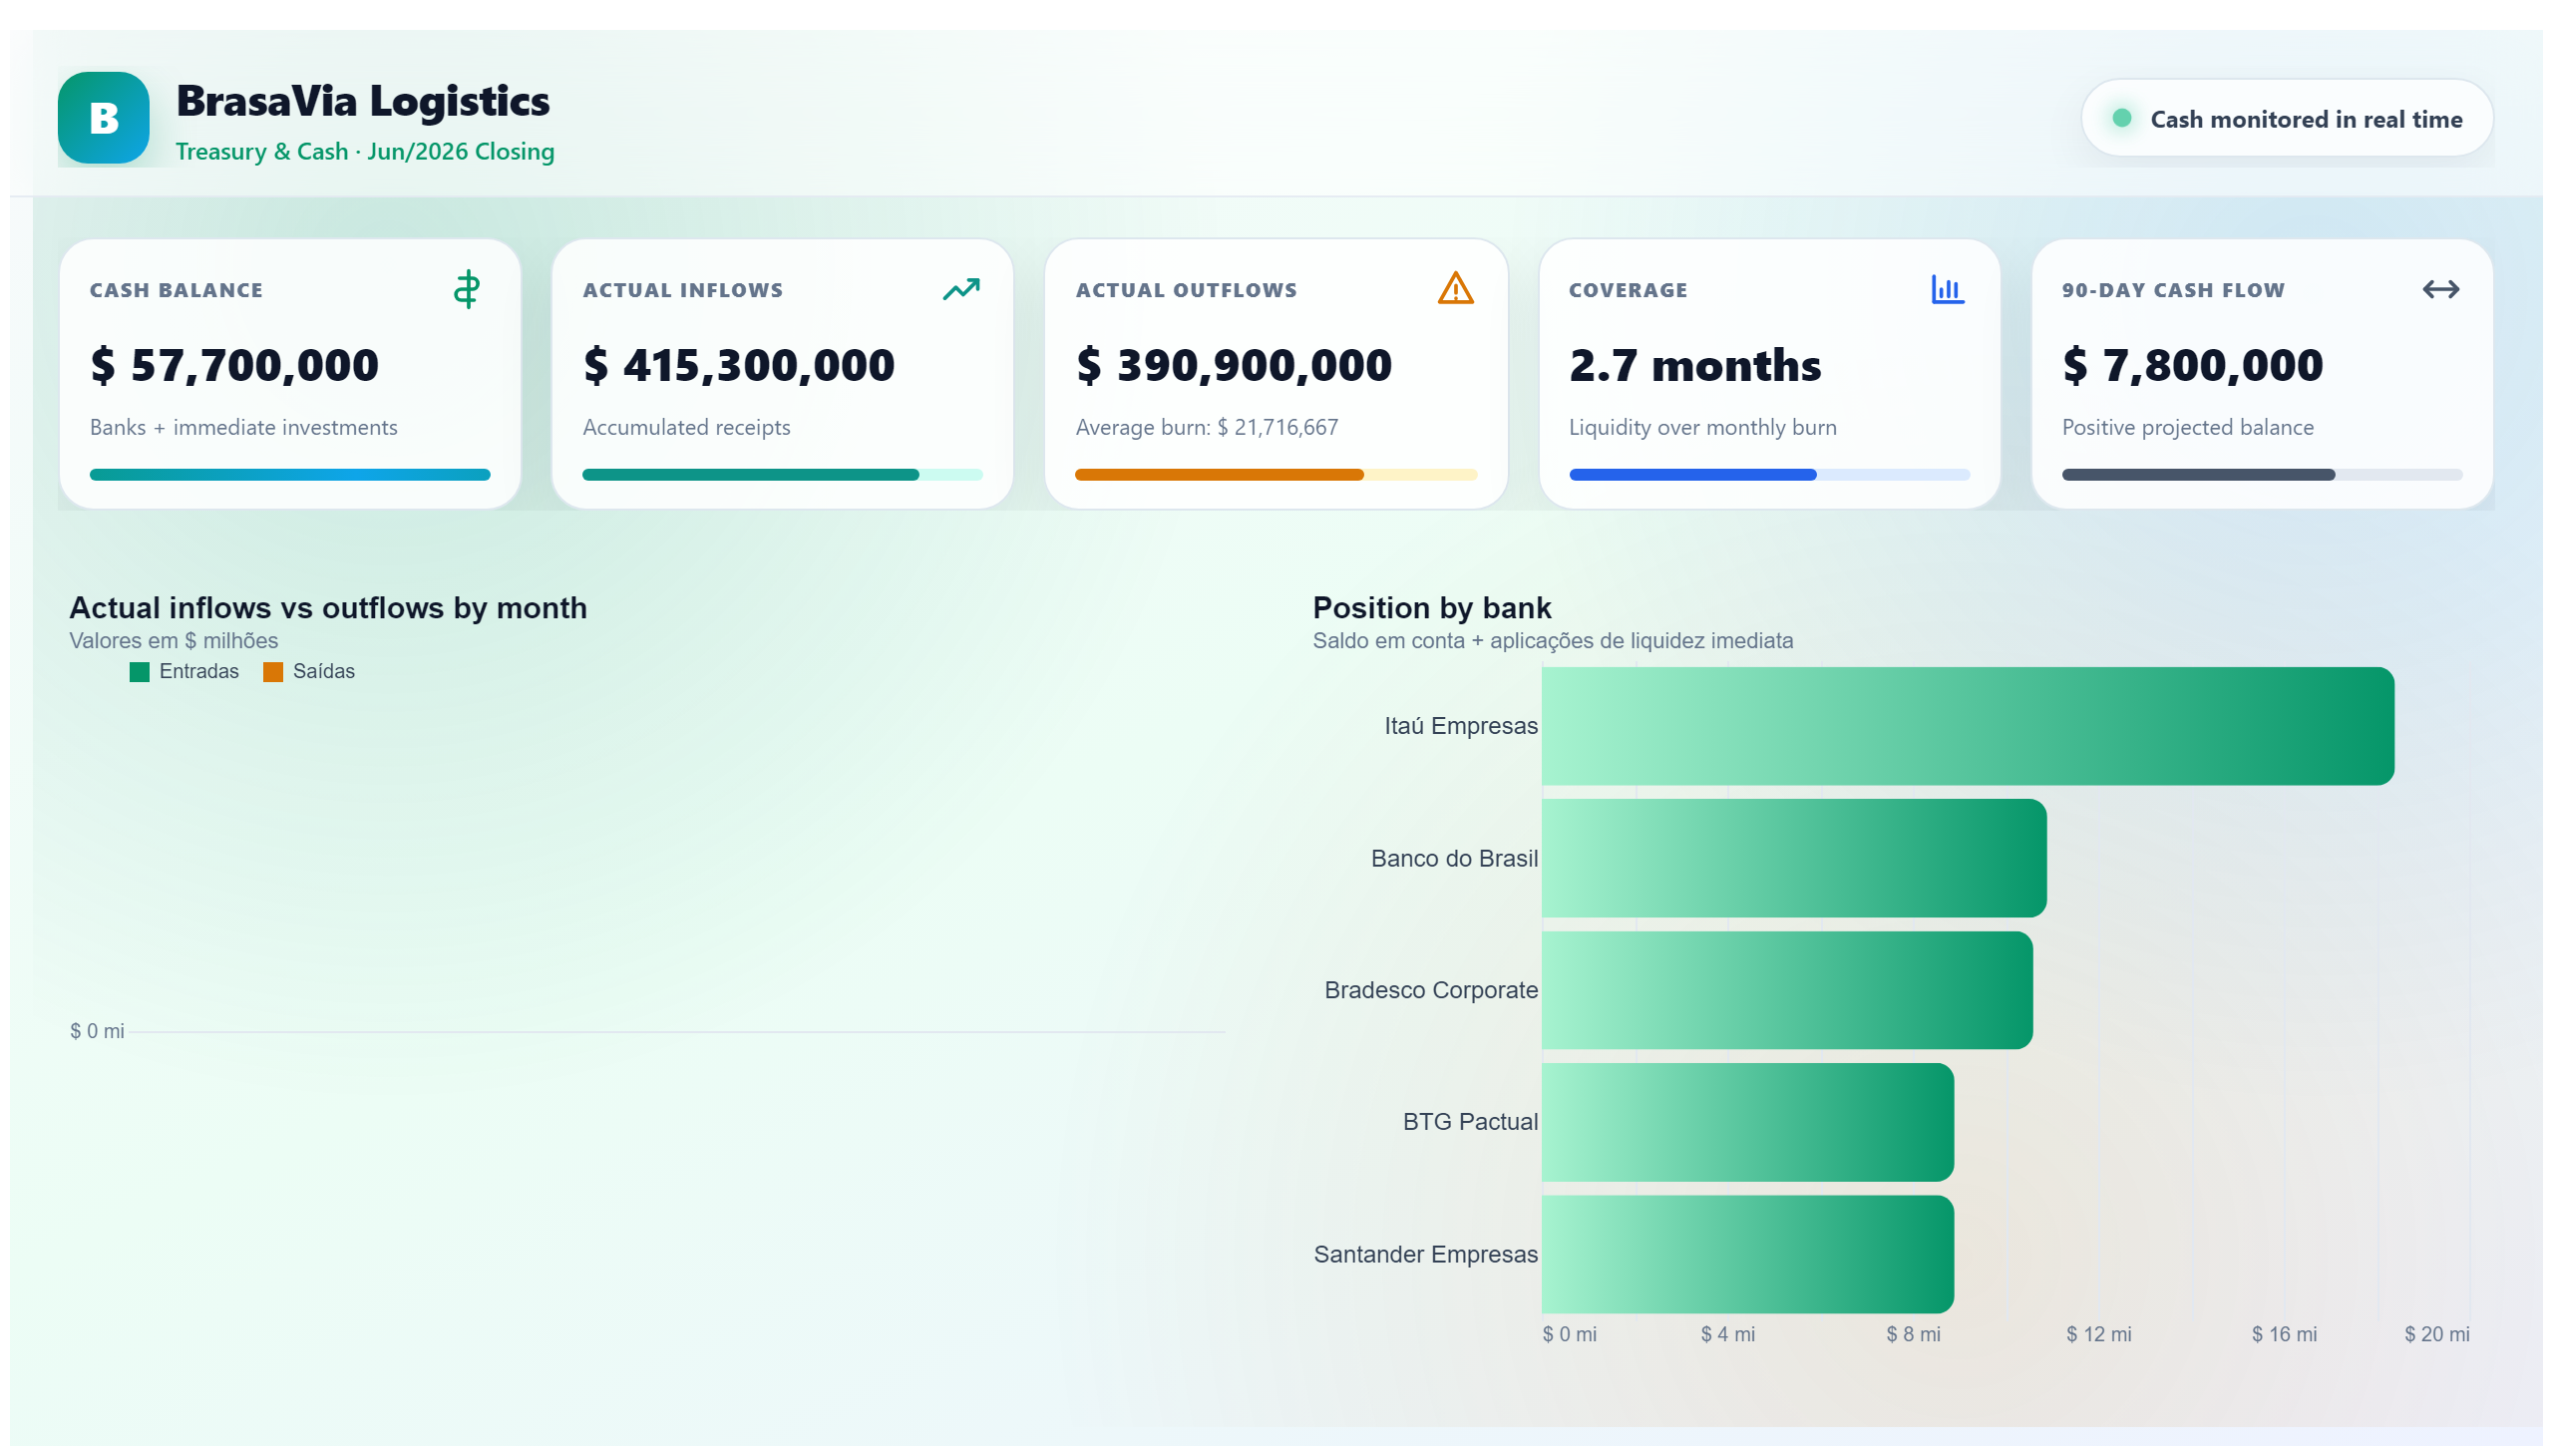
The American Bank dashboard offers a comprehensive overview of the bank's financial and operational performance. It consolidates key metrics and data points that help stakeholders understand the current state of the bank's business activities. Users can explore financial indicators such as revenue, expenses, and profitability alongside operational data, enabling a holistic view of the institution's health.
This dashboard is designed to answer critical business questions like: How is the bank performing financially over time? Which operational areas are driving costs or efficiencies? Are there trends that suggest opportunities or risks? By providing clear visualizations and data breakdowns, it supports decision-makers in identifying areas for improvement and strategic investment.
Ideal for financial analysts, operations managers, and executives within the bank, this report facilitates data-driven discussions and planning. It empowers users to monitor performance metrics regularly and align operational efforts with financial goals, ensuring the bank remains competitive and efficient in a dynamic market.
Frequently asked questions about this dashboard
What types of financial data are included in the American Bank dashboard?
The dashboard includes key financial metrics such as revenue, expenses, and profitability to provide a clear picture of the bank's financial health.
How does the dashboard support operational decision-making?
It presents operational data alongside financial metrics, allowing users to identify cost drivers and efficiency opportunities within the bank's processes.
Who is the primary audience for this dashboard?
The dashboard is intended for financial analysts, operations managers, and executives who need to monitor and improve the bank's financial and operational performance.
Want a dashboard like this with your data?
We build a custom version for your business — US$ 50 per page, delivered within 7 calendar days.
Finance Power BI templates
Complete projects built by the Excelverton factory: view them live with a free account and download the PBIP as a channel subscriber (1/month) or Pro subscriber (unlimited).
Create your free account
Save favorites, build collections and use the AI assistant — at no cost.