Accident Dashboard BI
This accident dashboard provides detailed data on incidents, helping to identify risk areas. It is crucial for continuous safety improvement.
Create a free account
Save your favorite dashboards, get new templates by area and ask the AI assistant — for free.
About the Accident Dashboard BI dashboard
This is a free Power BI dashboard called Accident Dashboard BI, in the RH domain. Explore KPIs, interactive visualizations and get inspired for your own data and business intelligence projects.
This accident dashboard provides detailed data on incidents, helping to identify risk areas. It is crucial for continuous safety improvement.
Dashboard analysis
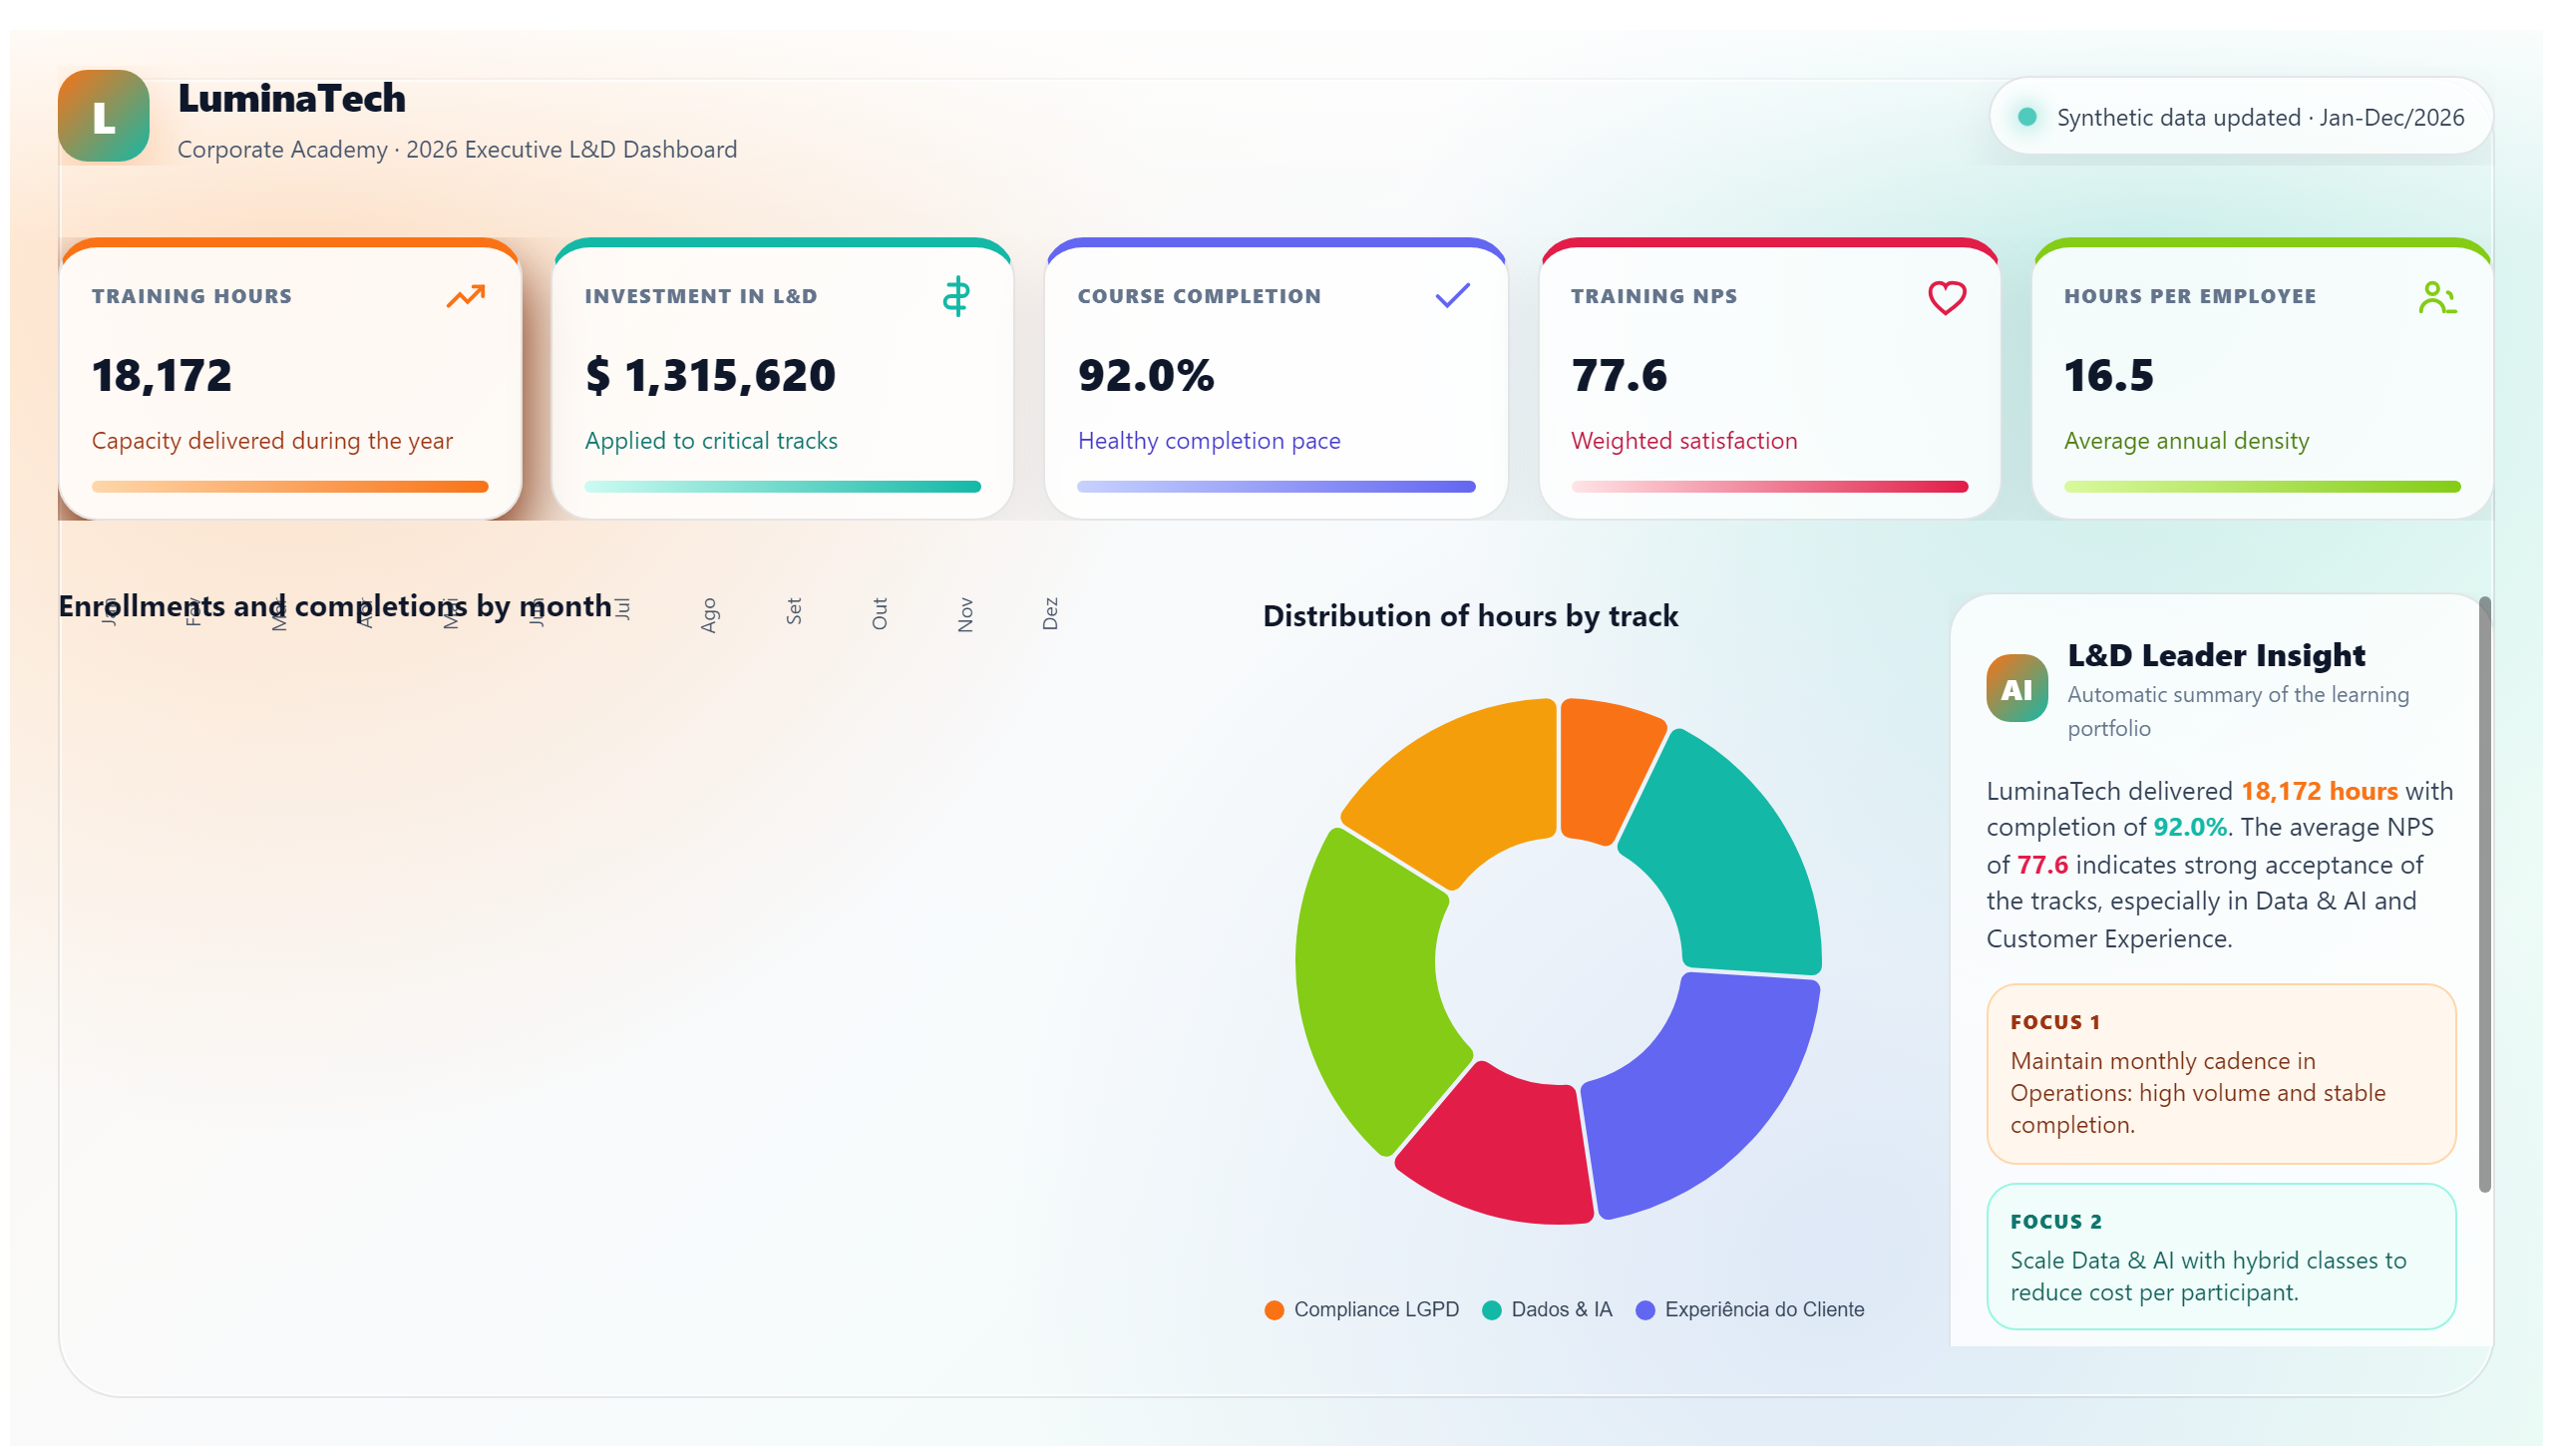
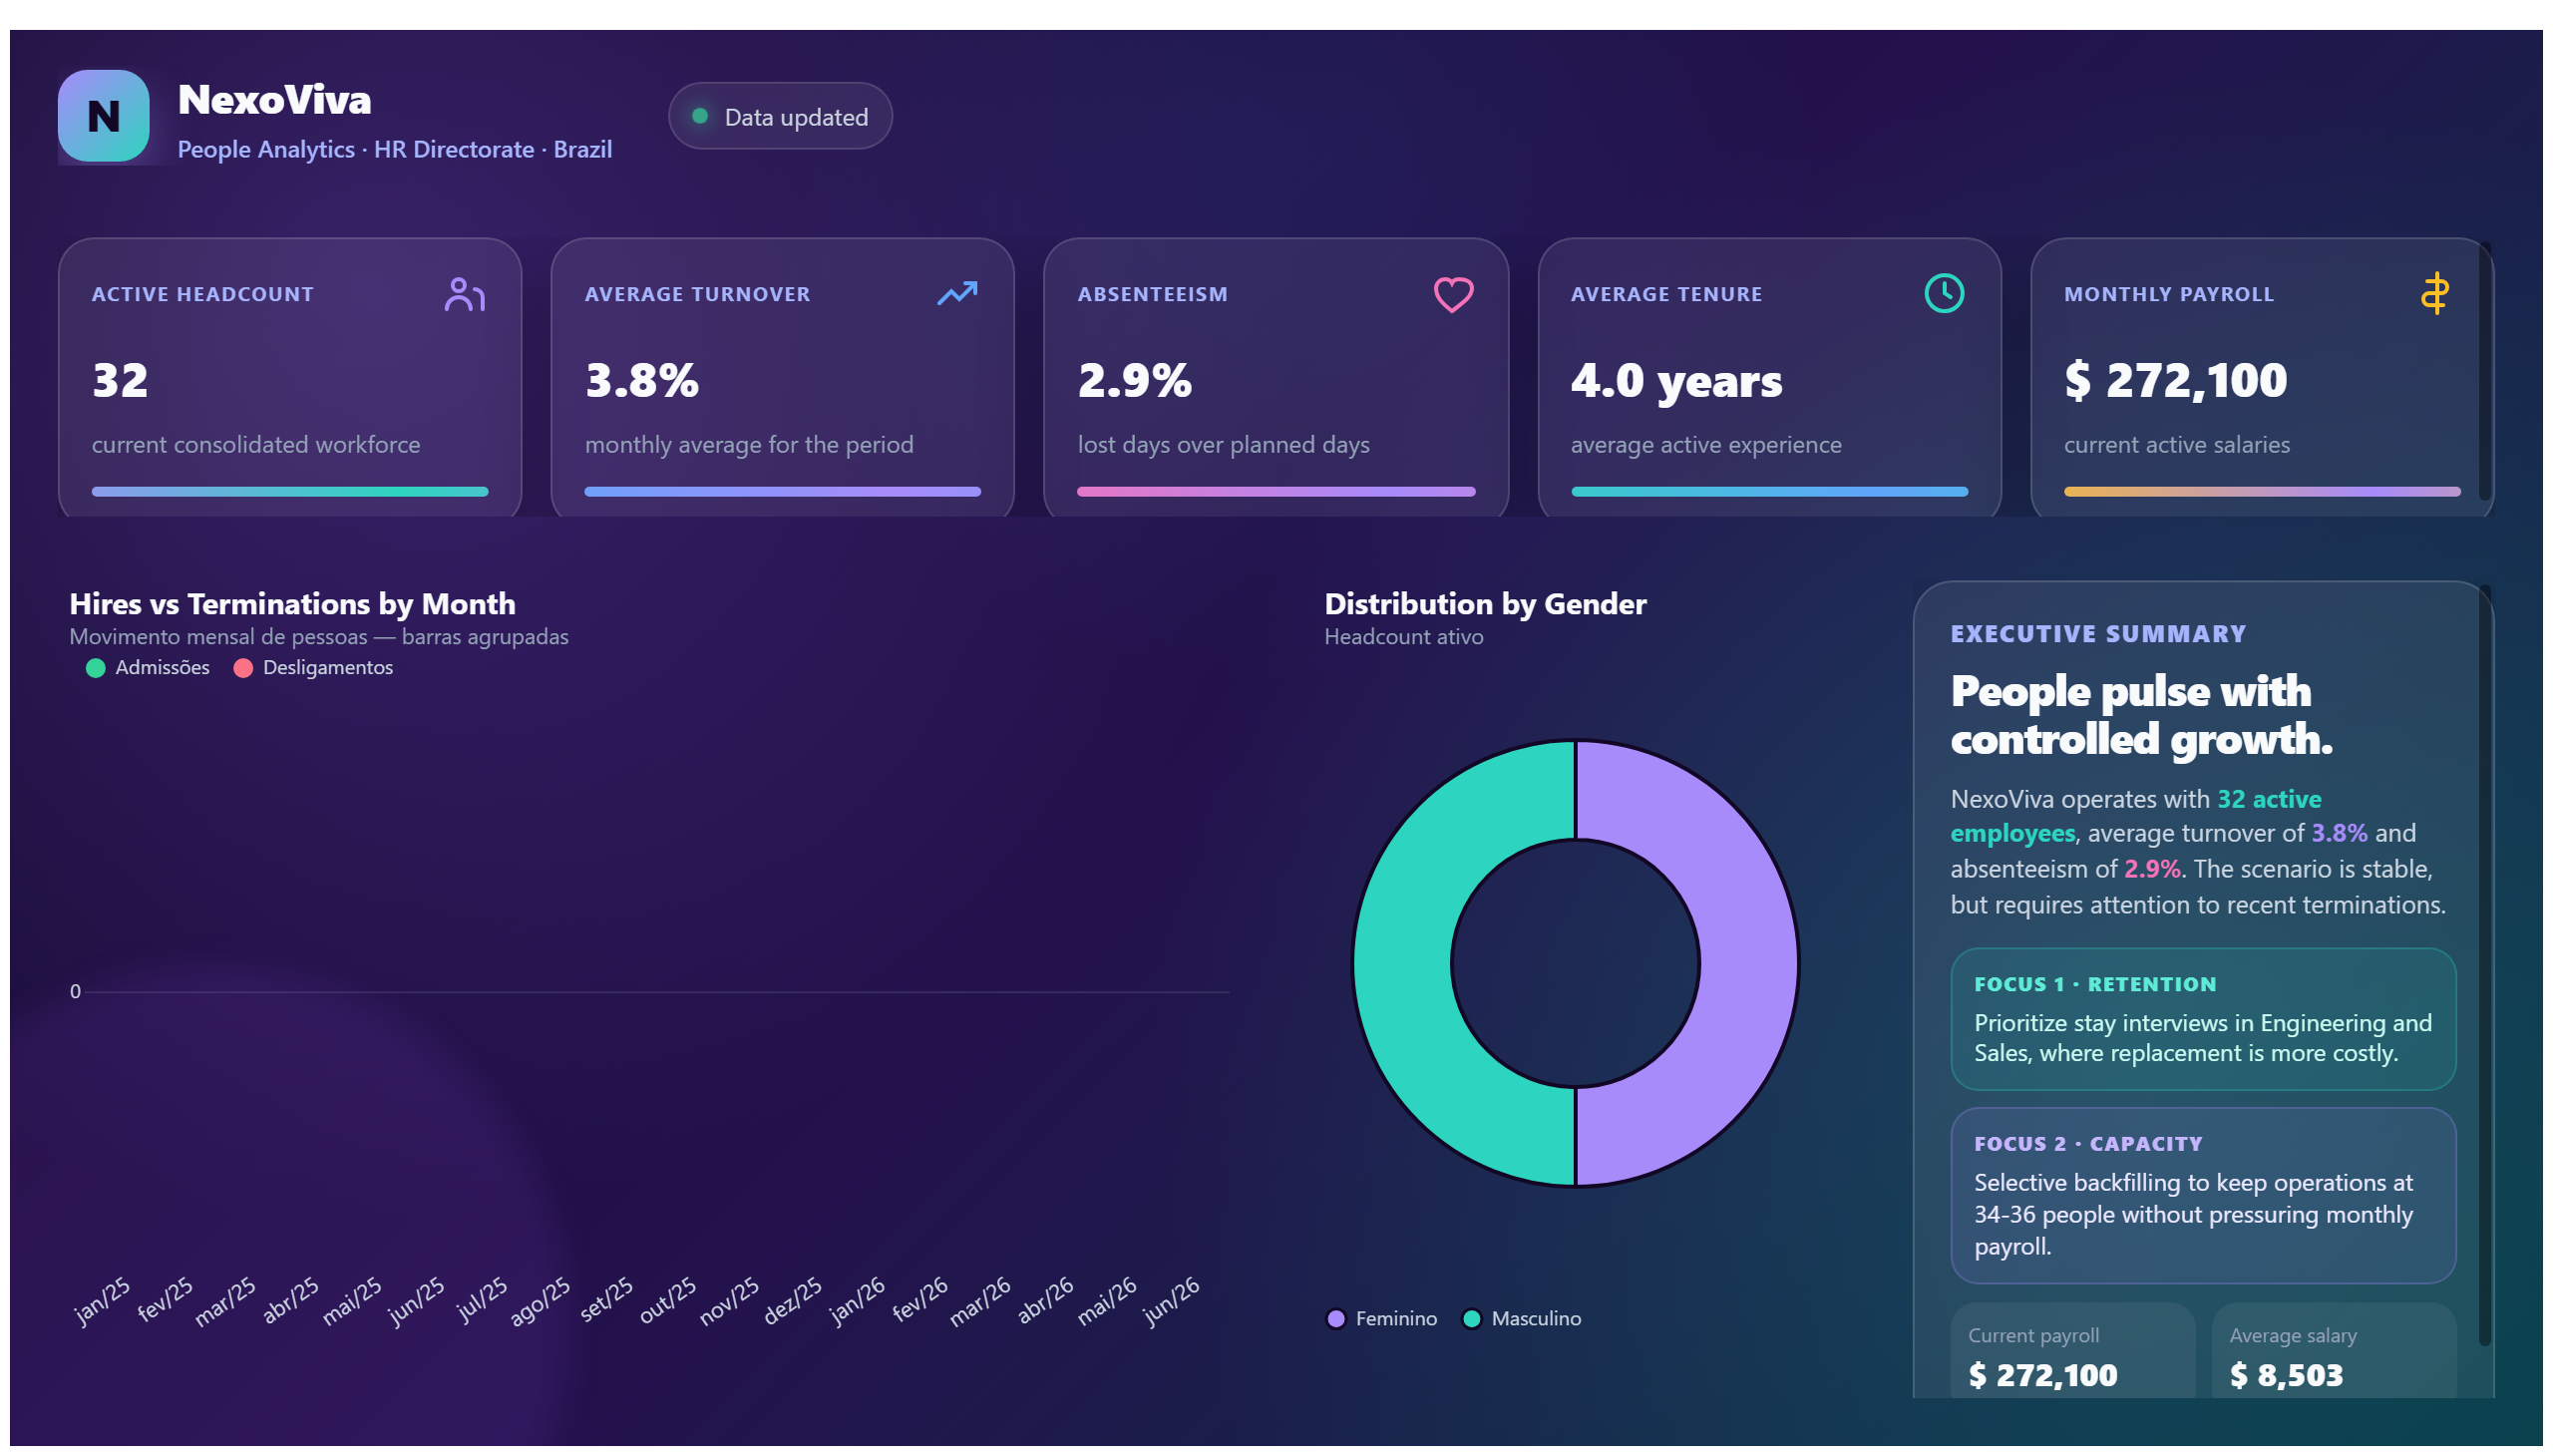
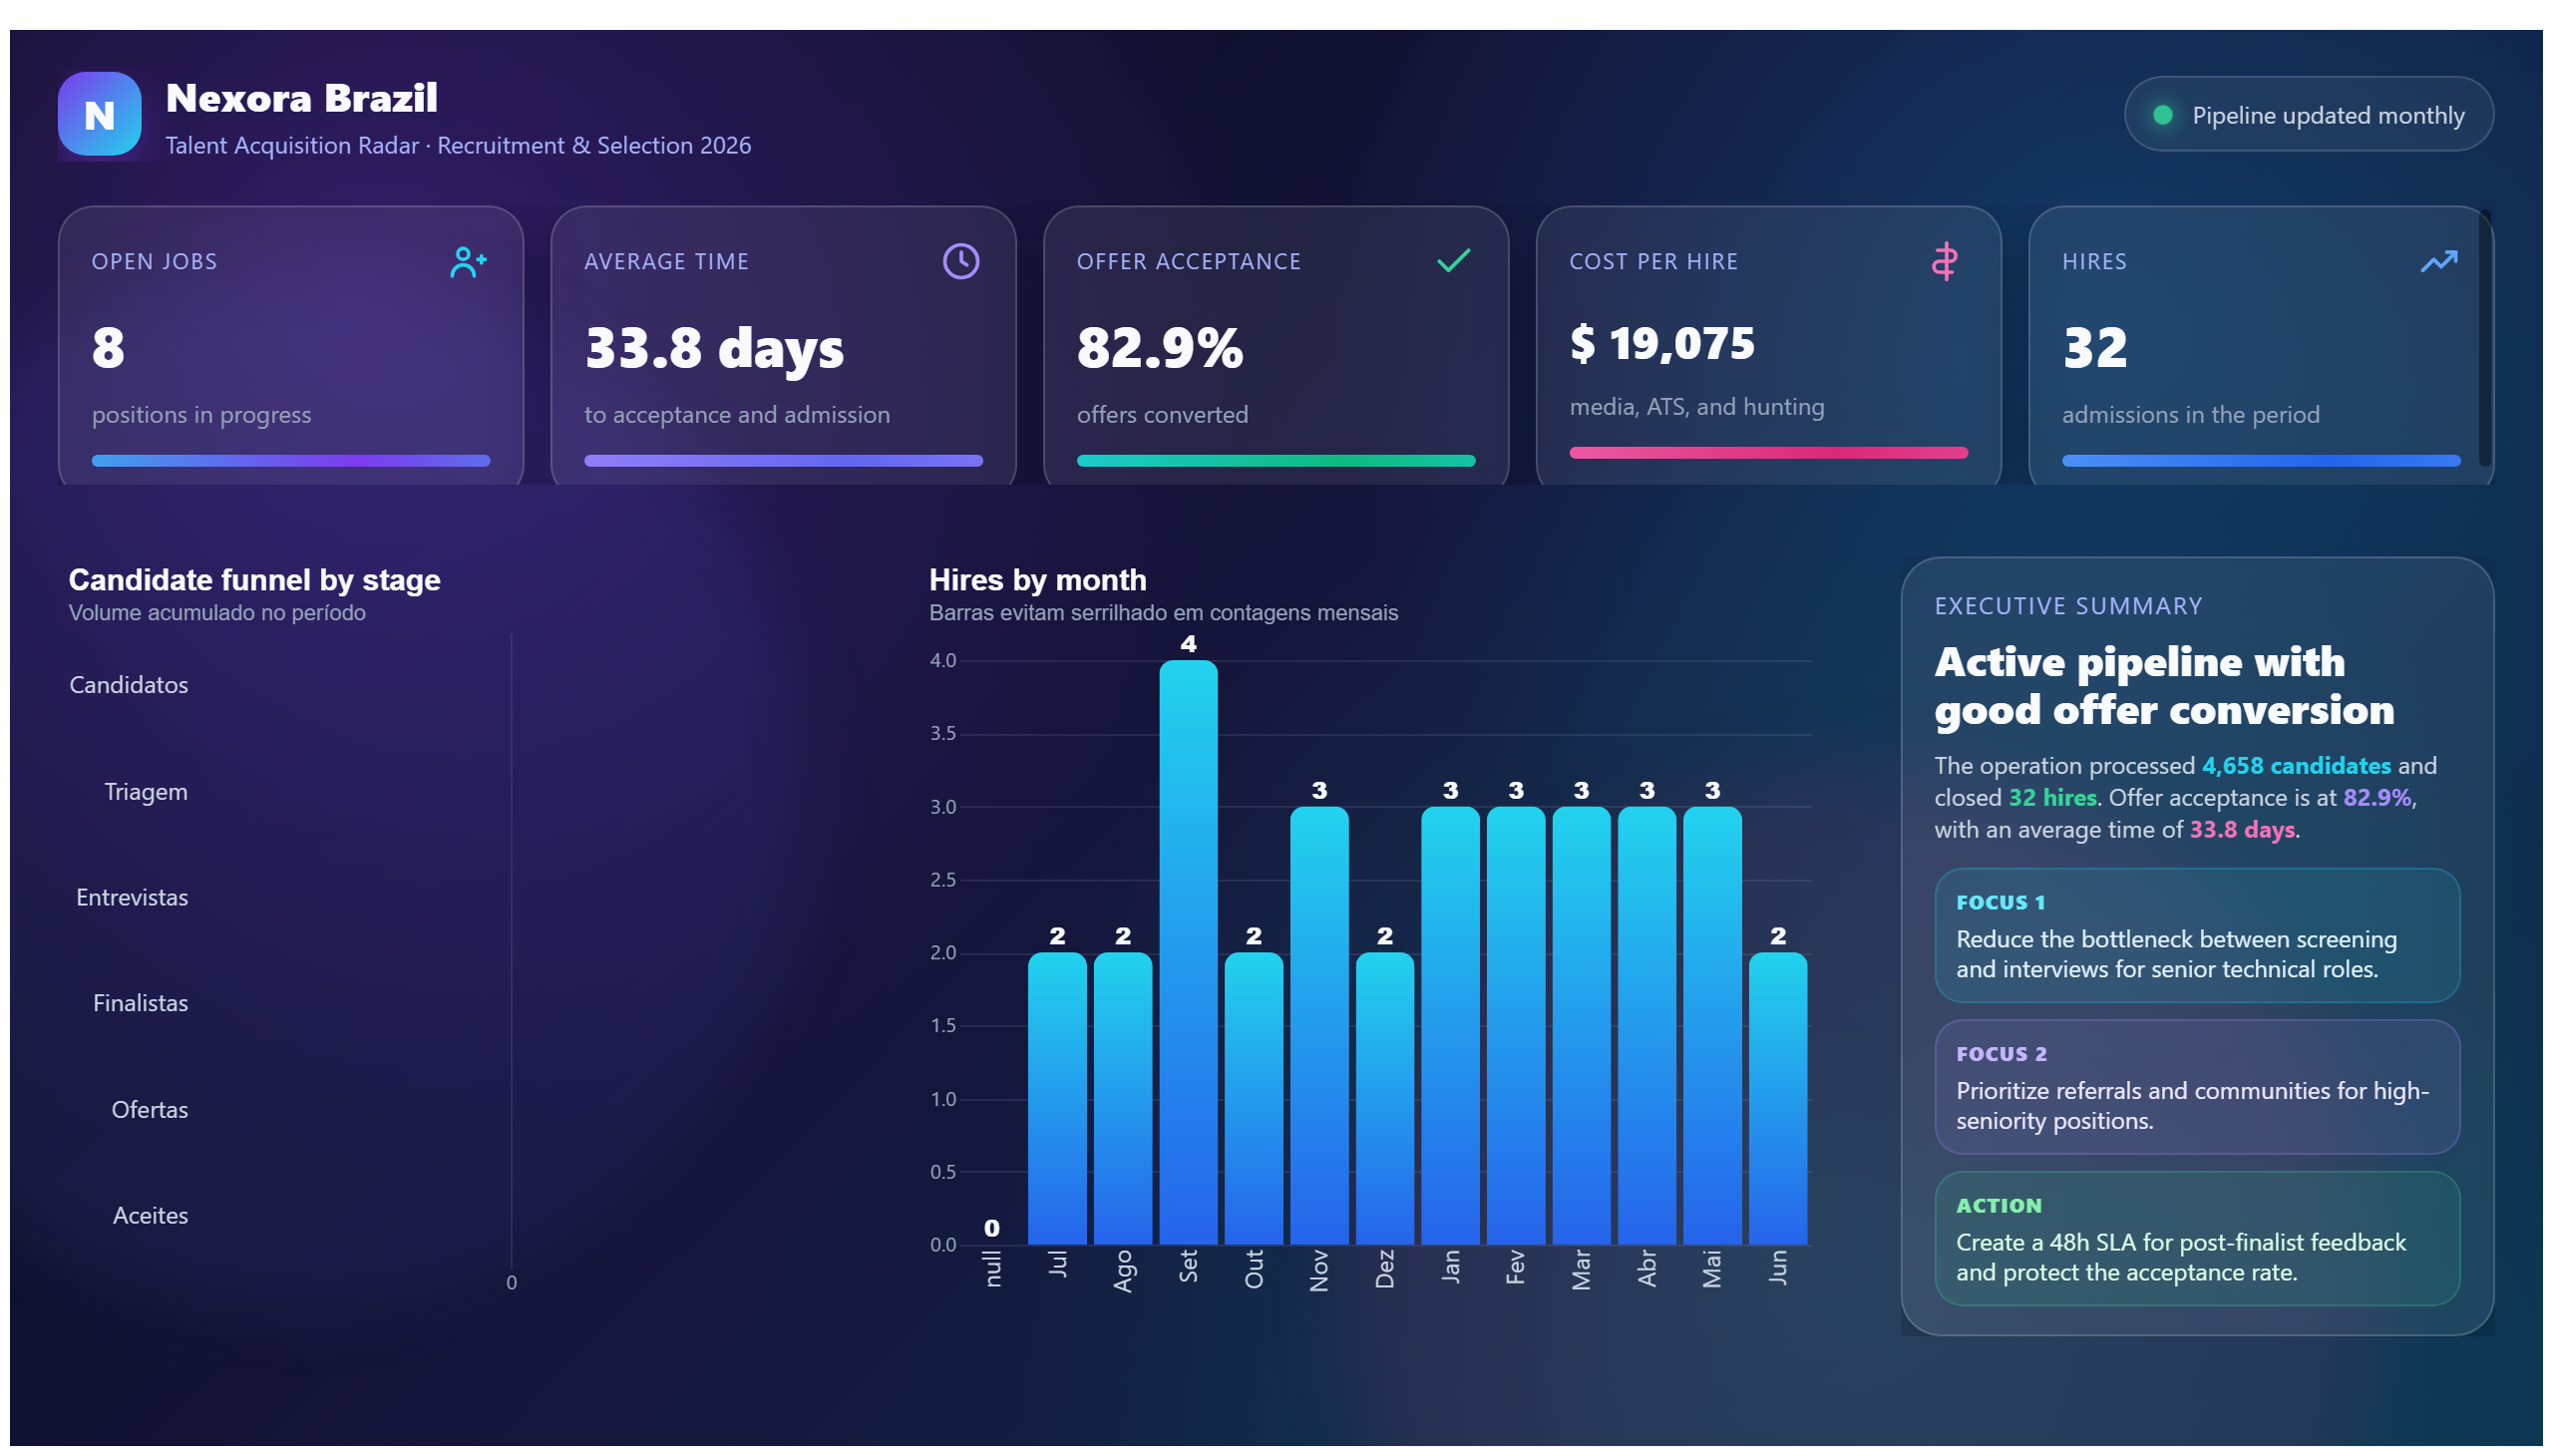
The Accident Dashboard BI offers a comprehensive view of incident data, enabling organizations to identify high-risk areas effectively. By presenting detailed information on accidents, this dashboard supports human resources and safety teams in understanding the patterns and causes of workplace incidents. It highlights key metrics such as the frequency, location, and severity of accidents, which are essential for targeted interventions.
This dashboard answers critical business questions like: Where are the most frequent accident hotspots? What types of incidents occur most often? How do accident trends evolve over time? By addressing these questions, the dashboard helps decision-makers prioritize safety measures and allocate resources efficiently to reduce workplace hazards.
Designed primarily for HR professionals and safety managers, the Accident Dashboard BI serves as a vital tool for continuous safety improvement. It empowers these stakeholders to monitor safety performance, comply with regulations, and foster a safer work environment through data-driven insights.
Frequently asked questions about this dashboard
What types of accident data are displayed in the dashboard?
The dashboard provides detailed information on incident frequency, locations, and severity levels to help identify risk areas.
Who is the primary audience for this dashboard?
The dashboard is mainly intended for HR professionals and safety managers responsible for workplace safety and risk management.
How can this dashboard help improve workplace safety?
By highlighting accident patterns and trends, it enables targeted safety interventions and resource allocation to reduce incidents.
Want a dashboard like this with your data?
We build a custom version for your business — US$ 50 per page, delivered within 7 calendar days.
HR Power BI templates
Complete projects built by the Excelverton factory: view them live with a free account and download the PBIP as a channel subscriber (1/month) or Pro subscriber (unlimited).
Create your free account
Save favorites, build collections and use the AI assistant — at no cost.