Ajith_Walmart Super store_Power Bi
Report on Walmart Superstore, possibly analyzing sales and operations.
Create a free account
Save your favorite dashboards, get new templates by area and ask the AI assistant — for free.
About the Ajith_Walmart Super store_Power Bi dashboard
This is a free Power BI dashboard called Ajith_Walmart Super store_Power Bi, in the Marketing domain. Explore KPIs, interactive visualizations and get inspired for your own data and business intelligence projects.
Report on Walmart Superstore, possibly analyzing sales and operations.
Dashboard analysis
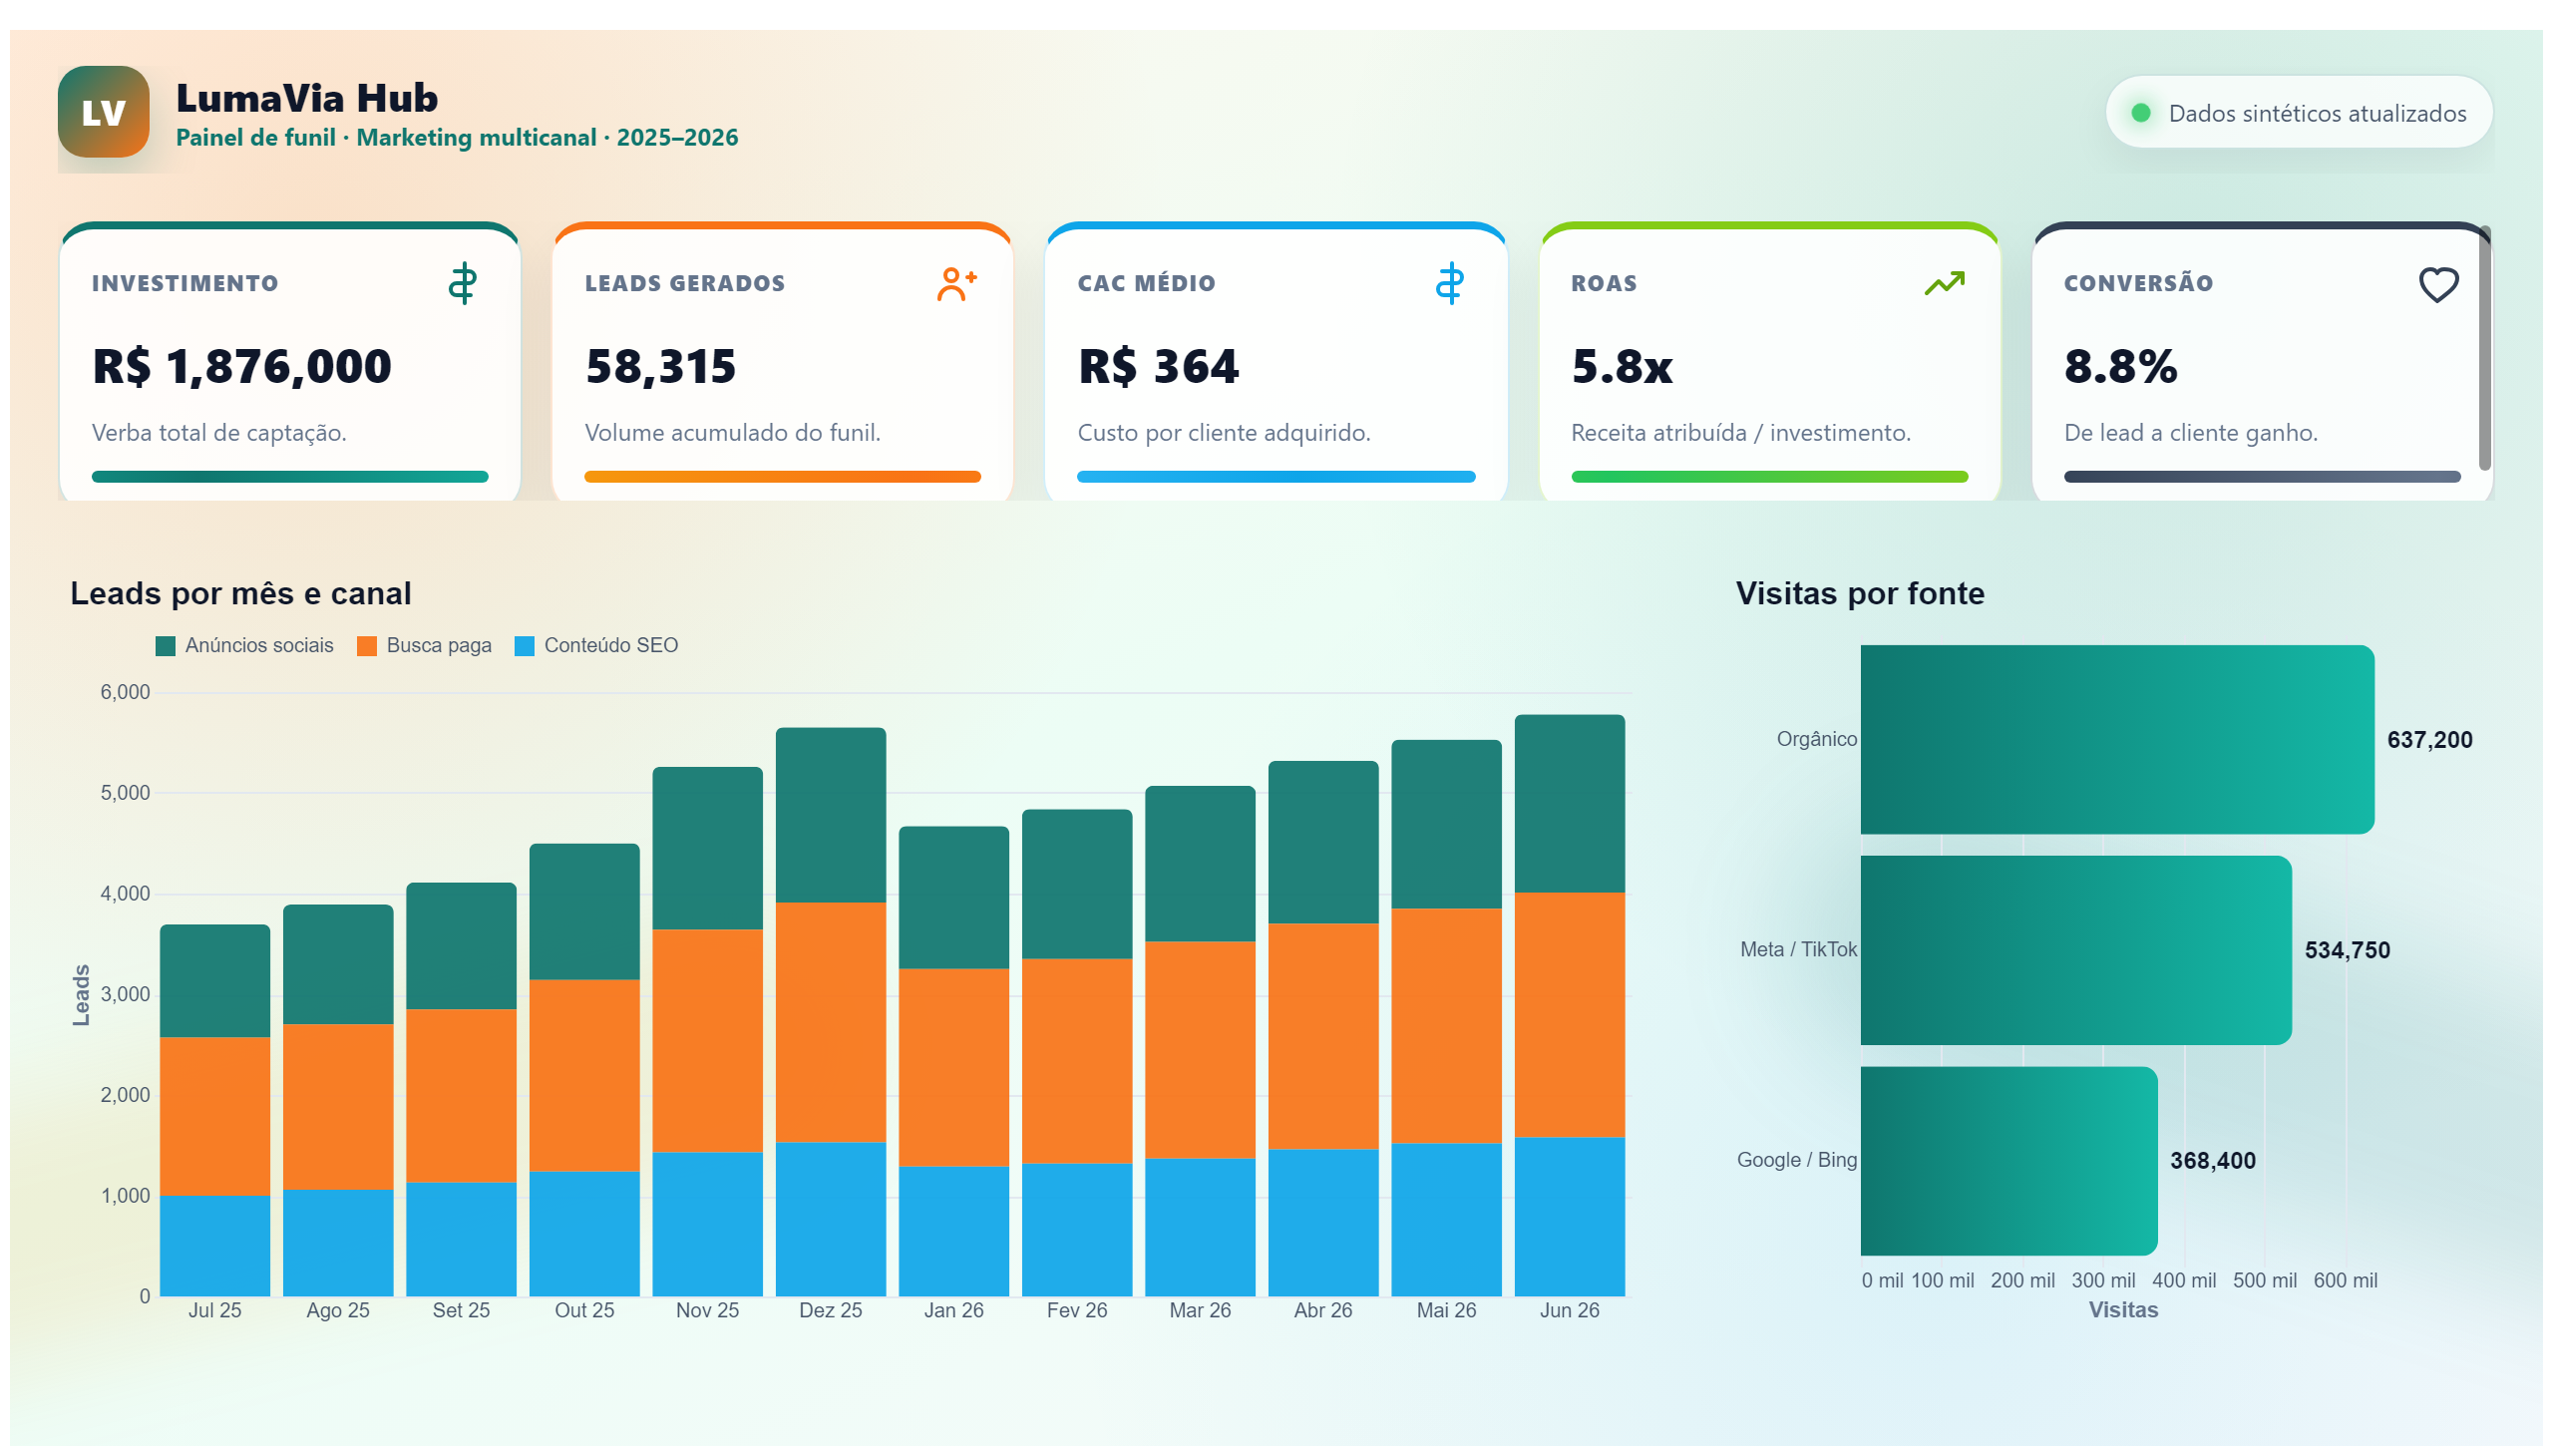
The Ajith_Walmart Super store_Power Bi dashboard provides a comprehensive overview of Walmart Superstore's sales and operational performance. It consolidates key metrics related to marketing, sales, and operations, enabling users to track revenue trends, product performance, and operational efficiency across different regions and time periods. This dashboard is designed to help business stakeholders understand how various factors impact the store's overall performance.
By analyzing sales data and operational metrics, the dashboard answers critical business questions such as: Which product categories are driving the most revenue? How are sales distributed across different regions? What operational factors are influencing sales performance? These insights support decision-making for marketing strategies, inventory management, and operational improvements.
This dashboard is ideal for marketing managers, sales analysts, and operations teams within Walmart or similar retail organizations who need to monitor store performance and optimize business processes. It empowers them to identify growth opportunities, address challenges, and align their strategies with actual business outcomes.
Frequently asked questions about this dashboard
What key performance indicators (KPIs) does the dashboard highlight?
The dashboard highlights KPIs related to sales revenue, product category performance, regional sales distribution, and operational metrics that affect store efficiency.
Can the dashboard help identify top-performing product categories?
Yes, it provides detailed sales analysis by product categories, enabling users to identify which categories contribute most to revenue.
Who is the primary audience for this dashboard?
The primary audience includes marketing managers, sales analysts, and operations teams focused on improving Walmart Superstore's performance.
Want a dashboard like this with your data?
We build a custom version for your business — US$ 50 per page, delivered within 7 calendar days.
Marketing Power BI templates
Complete projects built by the Excelverton factory: view them live with a free account and download the PBIP as a channel subscriber (1/month) or Pro subscriber (unlimited).

Create your free account
Save favorites, build collections and use the AI assistant — at no cost.