Hierarchies - Lecture
This report may address hierarchies in an educational context, possibly for performance analysis.
Create a free account
Save your favorite dashboards, get new templates by area and ask the AI assistant — for free.
About the Hierarchies - Lecture dashboard
This is a free Power BI dashboard called Hierarchies - Lecture, in the Educação domain. Explore KPIs, interactive visualizations and get inspired for your own data and business intelligence projects.
This report may address hierarchies in an educational context, possibly for performance analysis.
Dashboard analysis
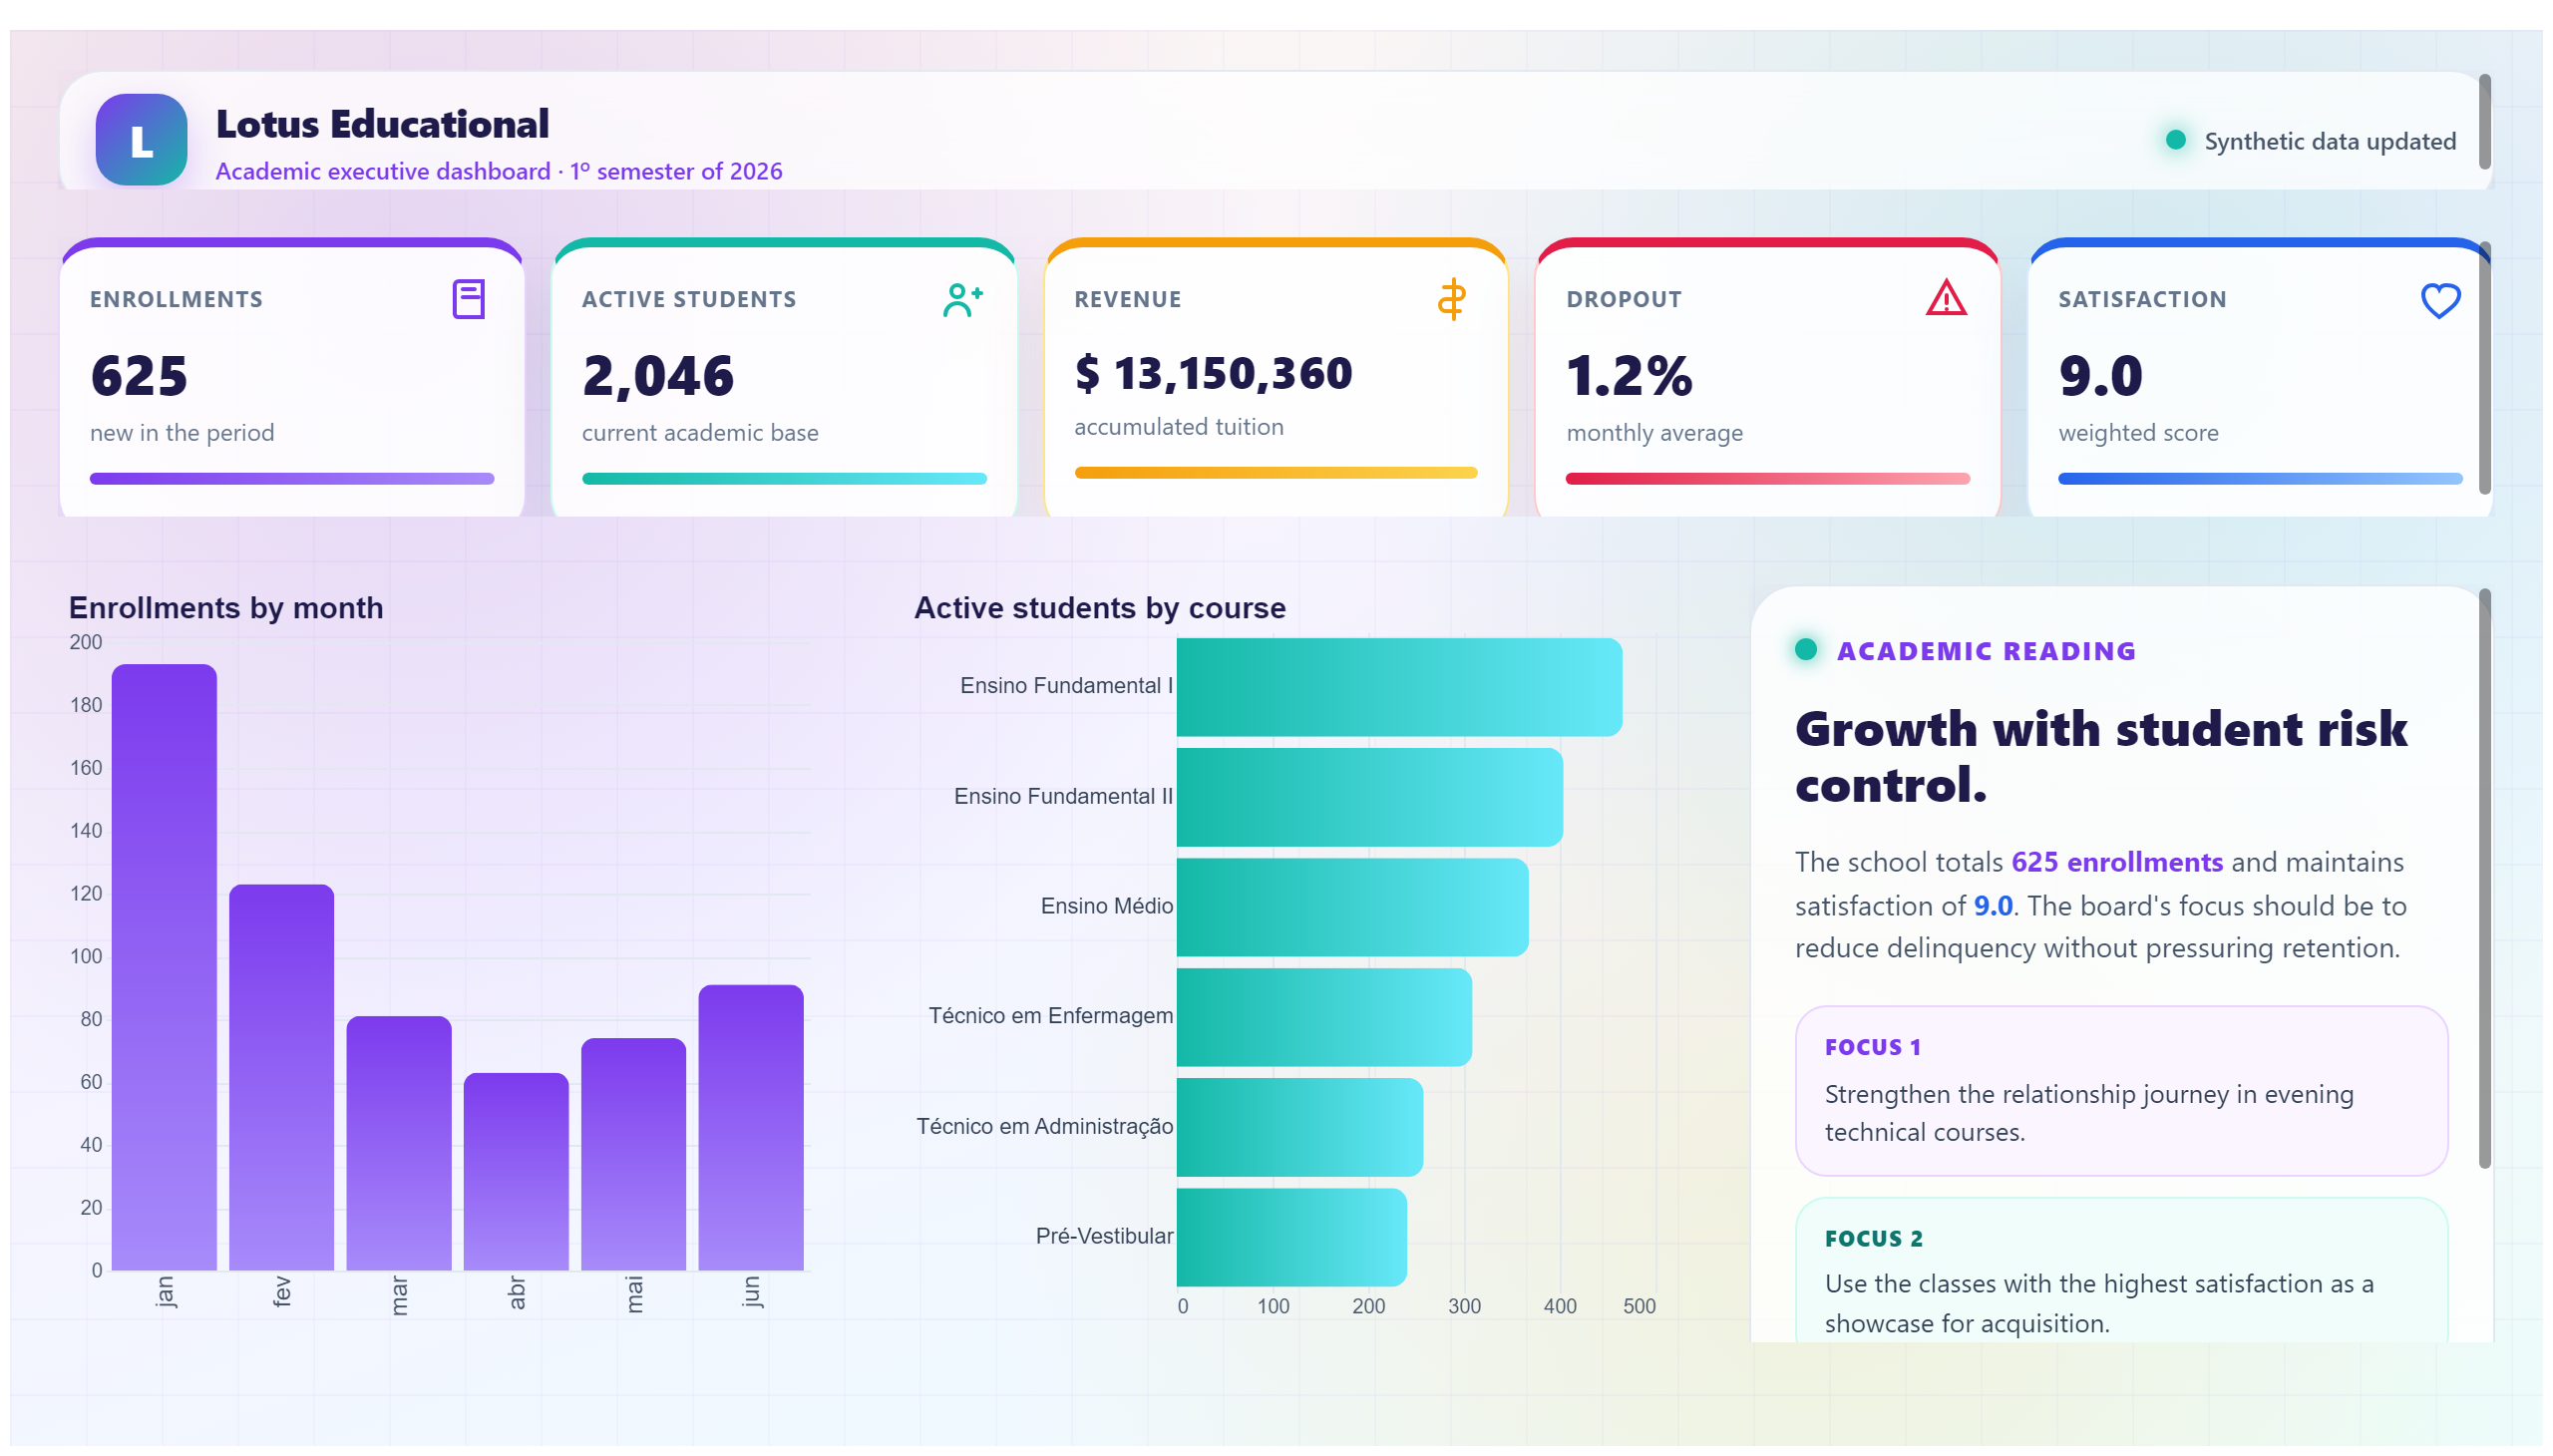
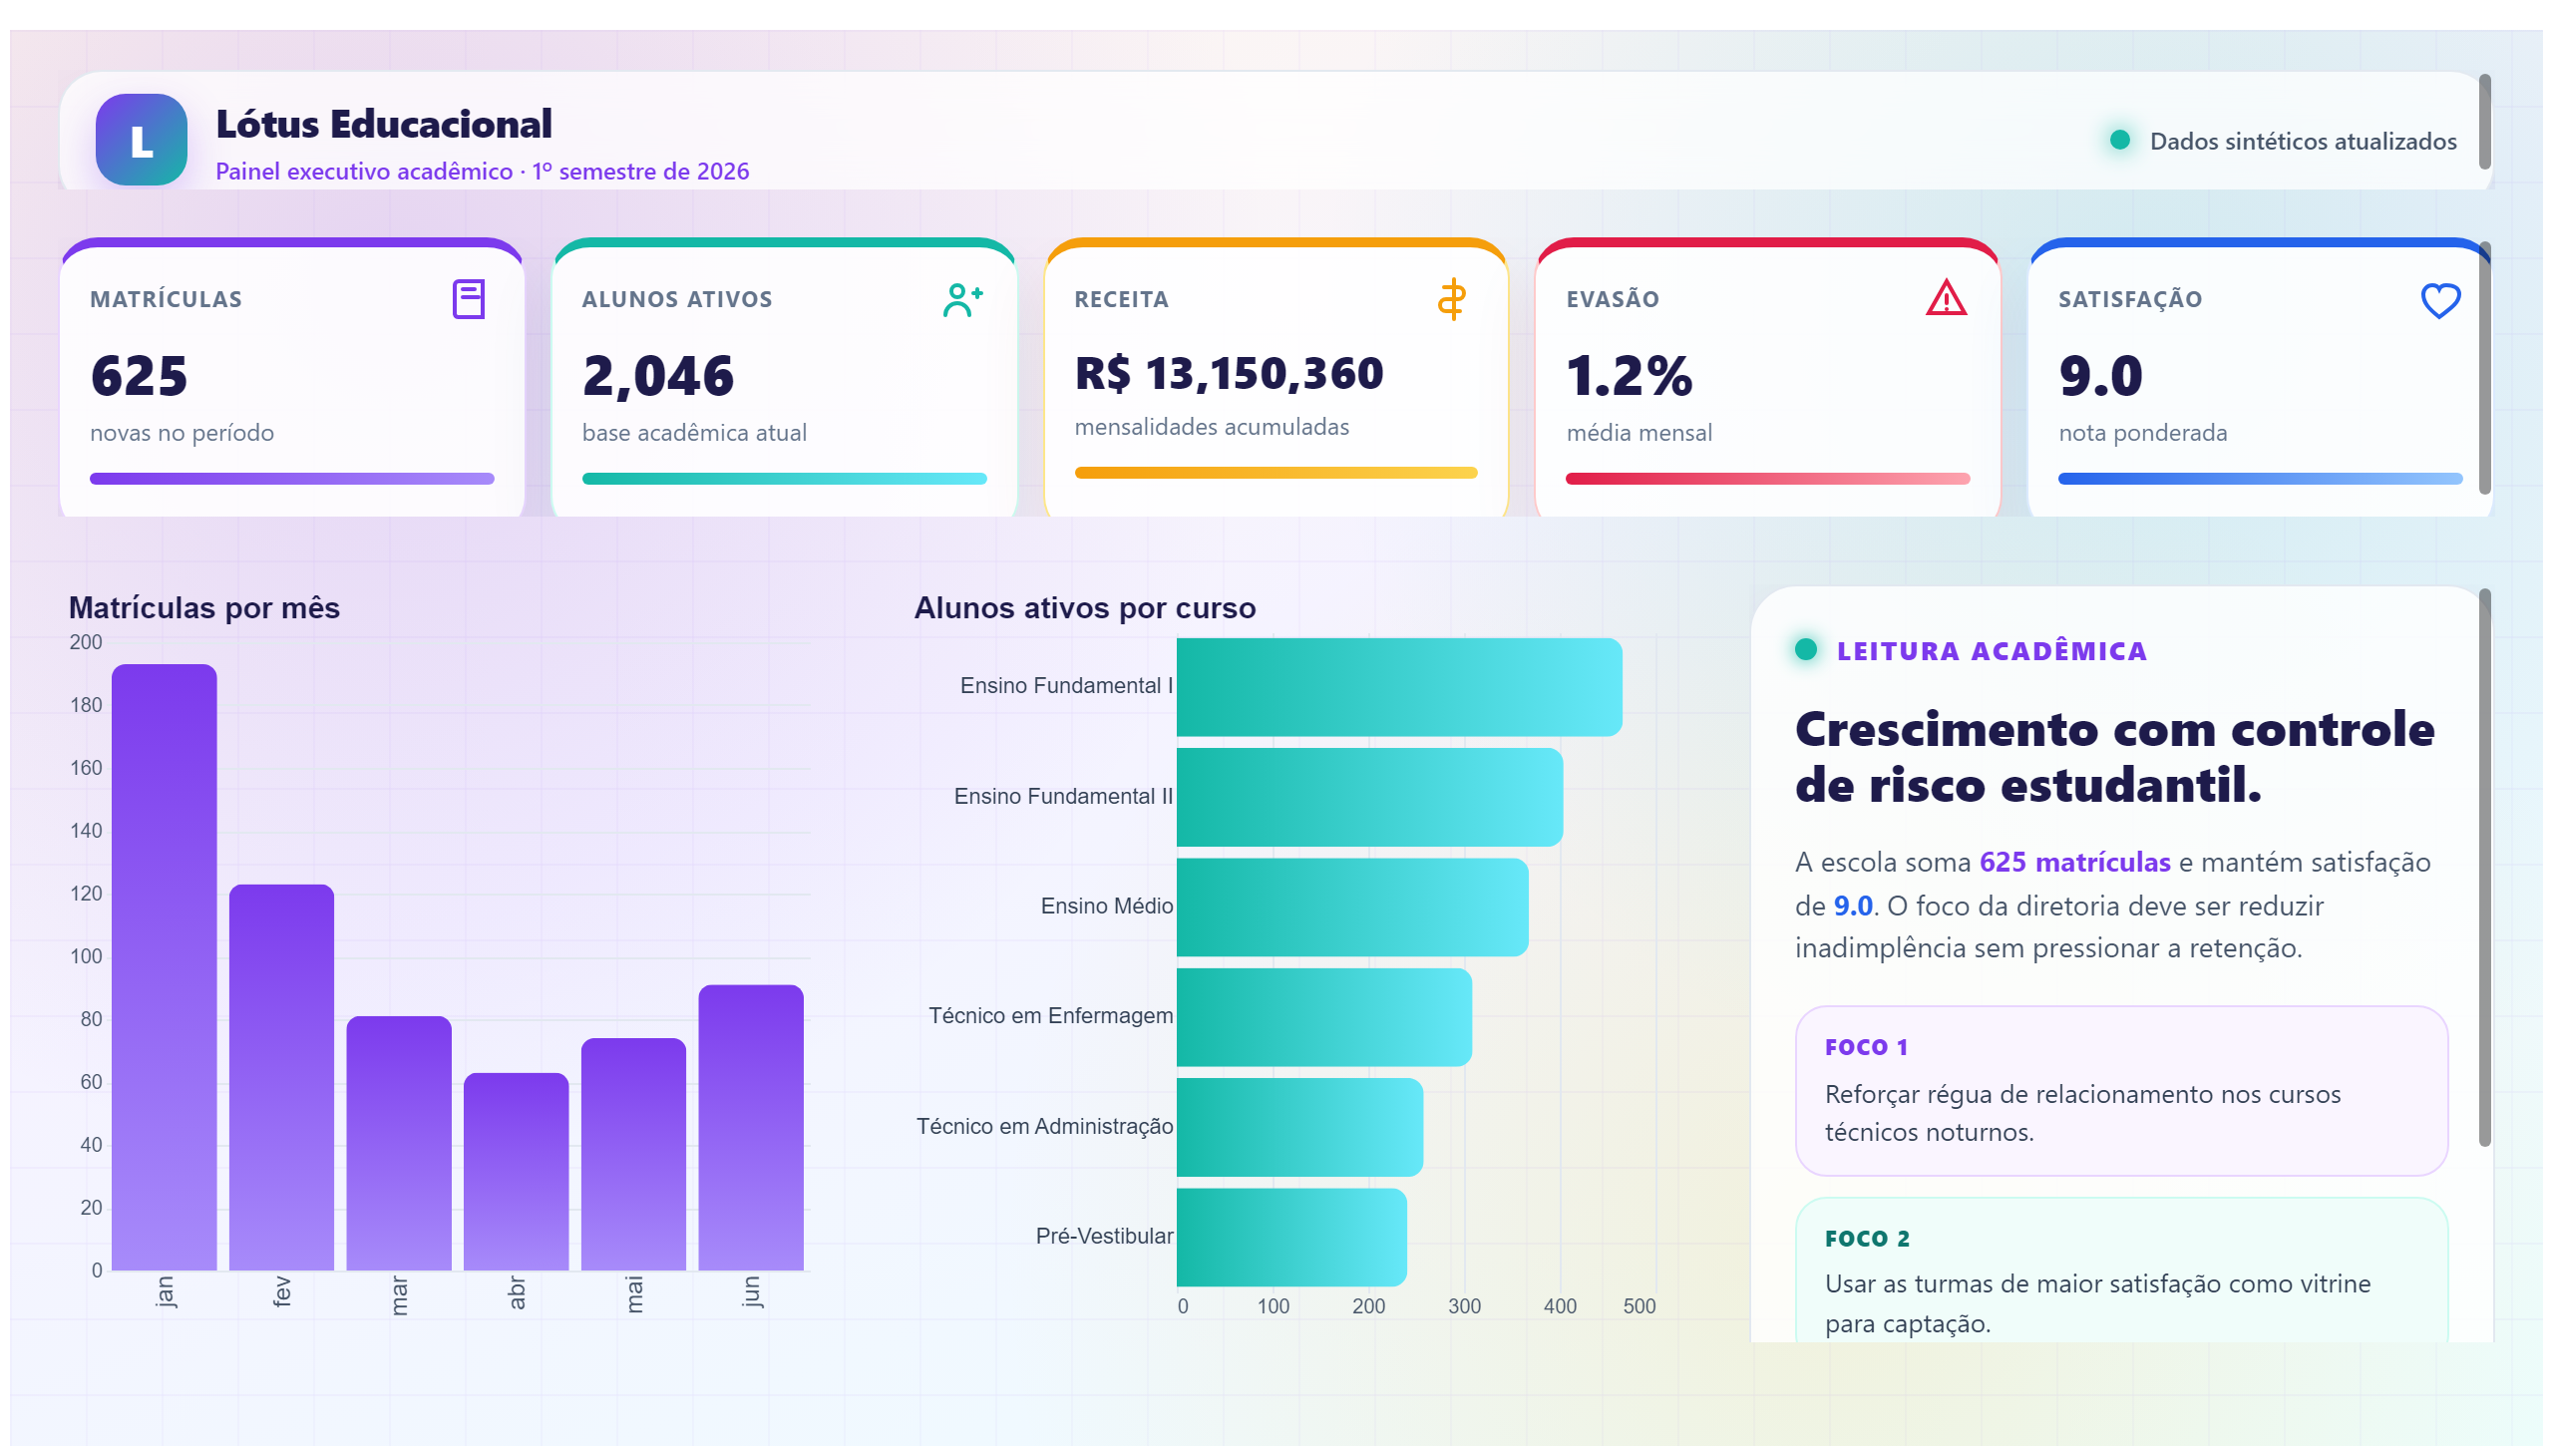
This dashboard titled Hierarchies - Lecture focuses on educational hierarchies, providing insights into the structure and performance within an academic context. It likely visualizes data related to lectures, courses, or departments organized in hierarchical levels, enabling users to analyze performance metrics across different layers of the educational system.
By exploring this report, educators and administrators can answer key business questions such as: How does student performance vary across different lecture levels or departments? Are there identifiable trends or gaps in learning outcomes within specific hierarchical segments? This understanding supports targeted interventions and resource allocation to improve educational quality.
Designed primarily for education professionals, including school administrators, academic coordinators, and data analysts, this dashboard facilitates data-driven decision-making. It empowers users to drill down through hierarchical data, uncovering detailed insights that inform strategic planning and enhance overall educational effectiveness.
Frequently asked questions about this dashboard
What types of hierarchies are represented in this dashboard?
The dashboard represents educational hierarchies such as lectures organized by courses, departments, or academic levels.
Who can benefit most from using this report?
School administrators, academic coordinators, and education data analysts can use this report to monitor and improve lecture performance.
What key questions does this dashboard help answer?
It helps answer questions about performance variations across hierarchical levels and identifies areas needing academic improvement.
Want a dashboard like this with your data?
We build a custom version for your business — US$ 50 per page, delivered within 7 calendar days.
Education Power BI templates
Complete projects built by the Excelverton factory: view them live with a free account and download the PBIP as a channel subscriber (1/month) or Pro subscriber (unlimited).
Create your free account
Save favorites, build collections and use the AI assistant — at no cost.