Airbnb Data Analysis
Airbnb data analysis may include information on property performance and market trends.
Create a free account
Save your favorite dashboards, get new templates by area and ask the AI assistant — for free.
About the Airbnb Data Analysis dashboard
This is a free Power BI dashboard called Airbnb Data Analysis, in the Marketing domain. Explore KPIs, interactive visualizations and get inspired for your own data and business intelligence projects.
Airbnb data analysis may include information on property performance and market trends.
Dashboard analysis
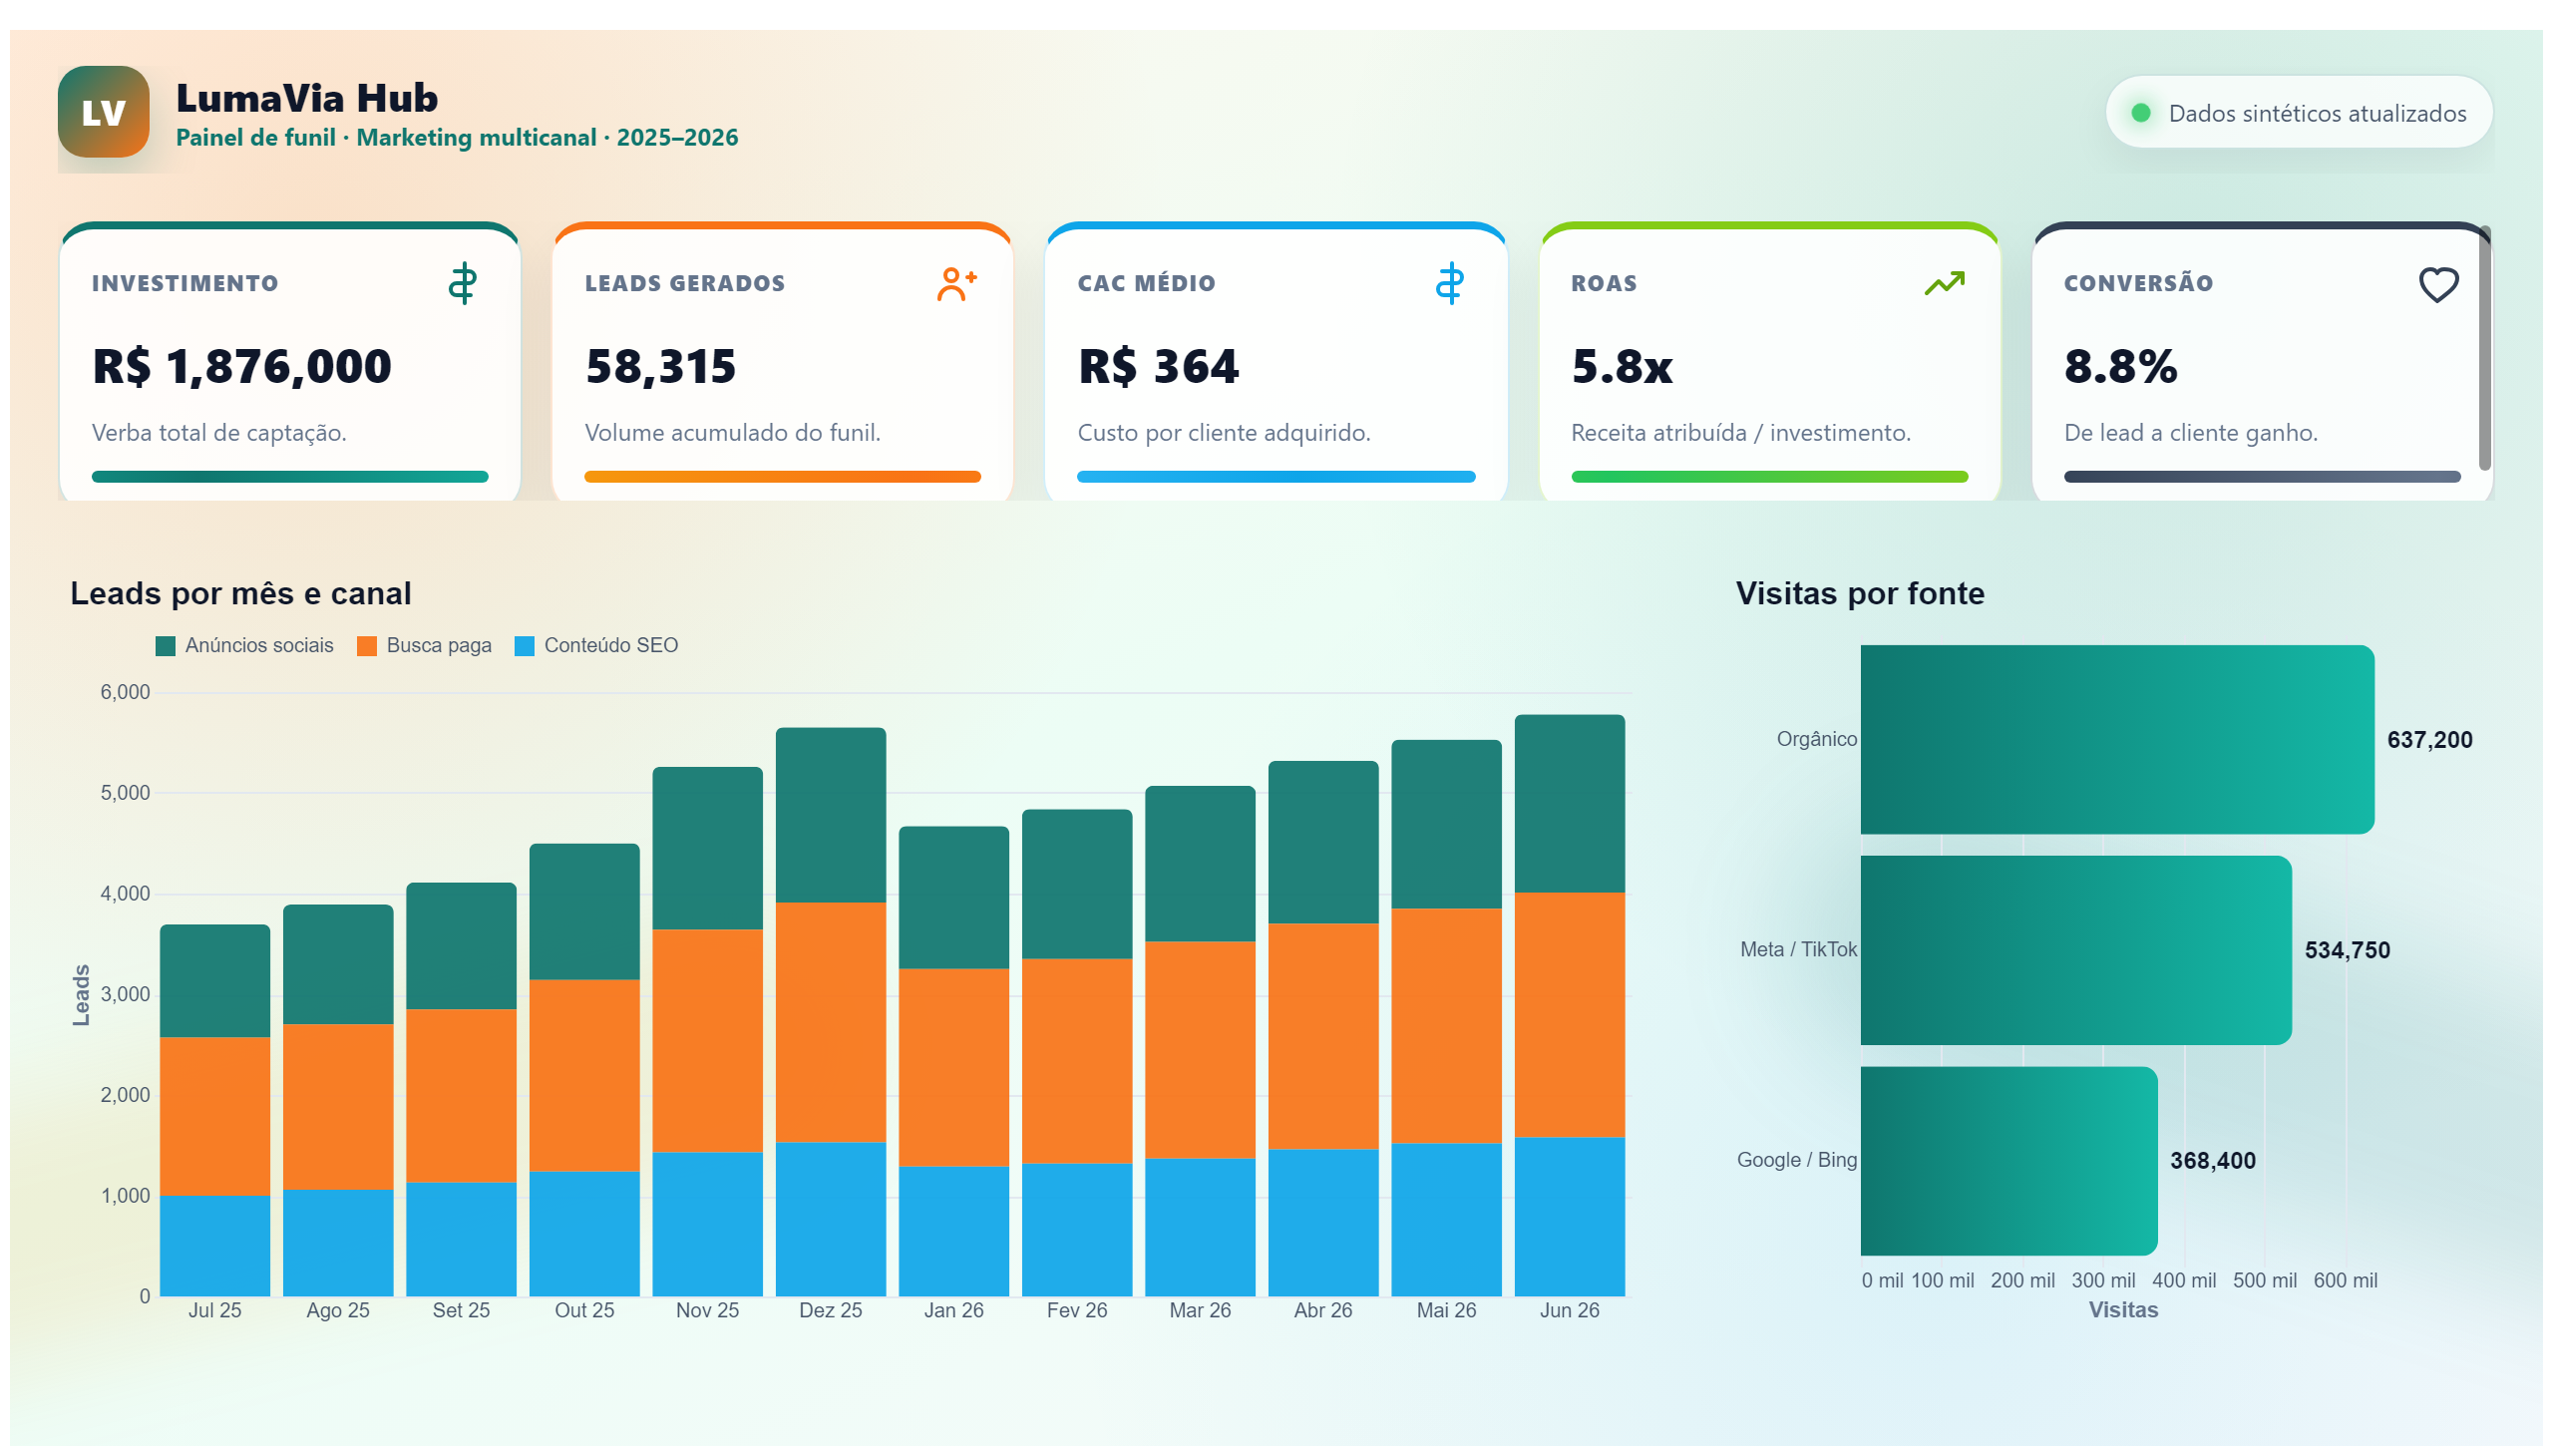
This Airbnb Data Analysis dashboard provides a comprehensive overview of property performance and market trends within the Airbnb ecosystem. It enables users to track key metrics such as occupancy rates, average daily rates, and revenue generation across different listings and regions. By visualizing these data points, stakeholders can identify which properties are performing well and which may require strategic adjustments.
The dashboard answers critical business questions such as: Which listings generate the highest revenue? How do occupancy rates vary by location or season? What market trends are emerging that could impact pricing strategies? These insights help hosts, property managers, and marketing professionals optimize their offerings and tailor marketing campaigns to maximize profitability.
Designed primarily for marketing teams and analysts, this dashboard supports data-driven decision-making by consolidating relevant Airbnb data into an accessible and interactive format. It empowers users to monitor performance continuously and adapt to evolving market conditions effectively.
Frequently asked questions about this dashboard
What key performance indicators does this dashboard track?
The dashboard tracks occupancy rates, average daily rates, and revenue generated by Airbnb properties.
How can this dashboard help improve marketing strategies?
By identifying high-performing listings and market trends, the dashboard helps marketing teams tailor campaigns to target profitable segments and optimize pricing.
Who is the primary audience for this dashboard?
The dashboard is designed for marketing professionals, property managers, and analysts involved in Airbnb property performance and market analysis.
Want a dashboard like this with your data?
We build a custom version for your business — US$ 50 per page, delivered within 7 calendar days.
Marketing Power BI templates
Complete projects built by the Excelverton factory: view them live with a free account and download the PBIP as a channel subscriber (1/month) or Pro subscriber (unlimited).

Create your free account
Save favorites, build collections and use the AI assistant — at no cost.