Tech course analysis
This report analyzes technical courses, possibly evaluating effectiveness and career impact for participants.
Create a free account
Save your favorite dashboards, get new templates by area and ask the AI assistant — for free.
About the Tech course analysis dashboard
This is a free Power BI dashboard called Tech course analysis, in the RH domain. Explore KPIs, interactive visualizations and get inspired for your own data and business intelligence projects.
This report analyzes technical courses, possibly evaluating effectiveness and career impact for participants.
Dashboard analysis
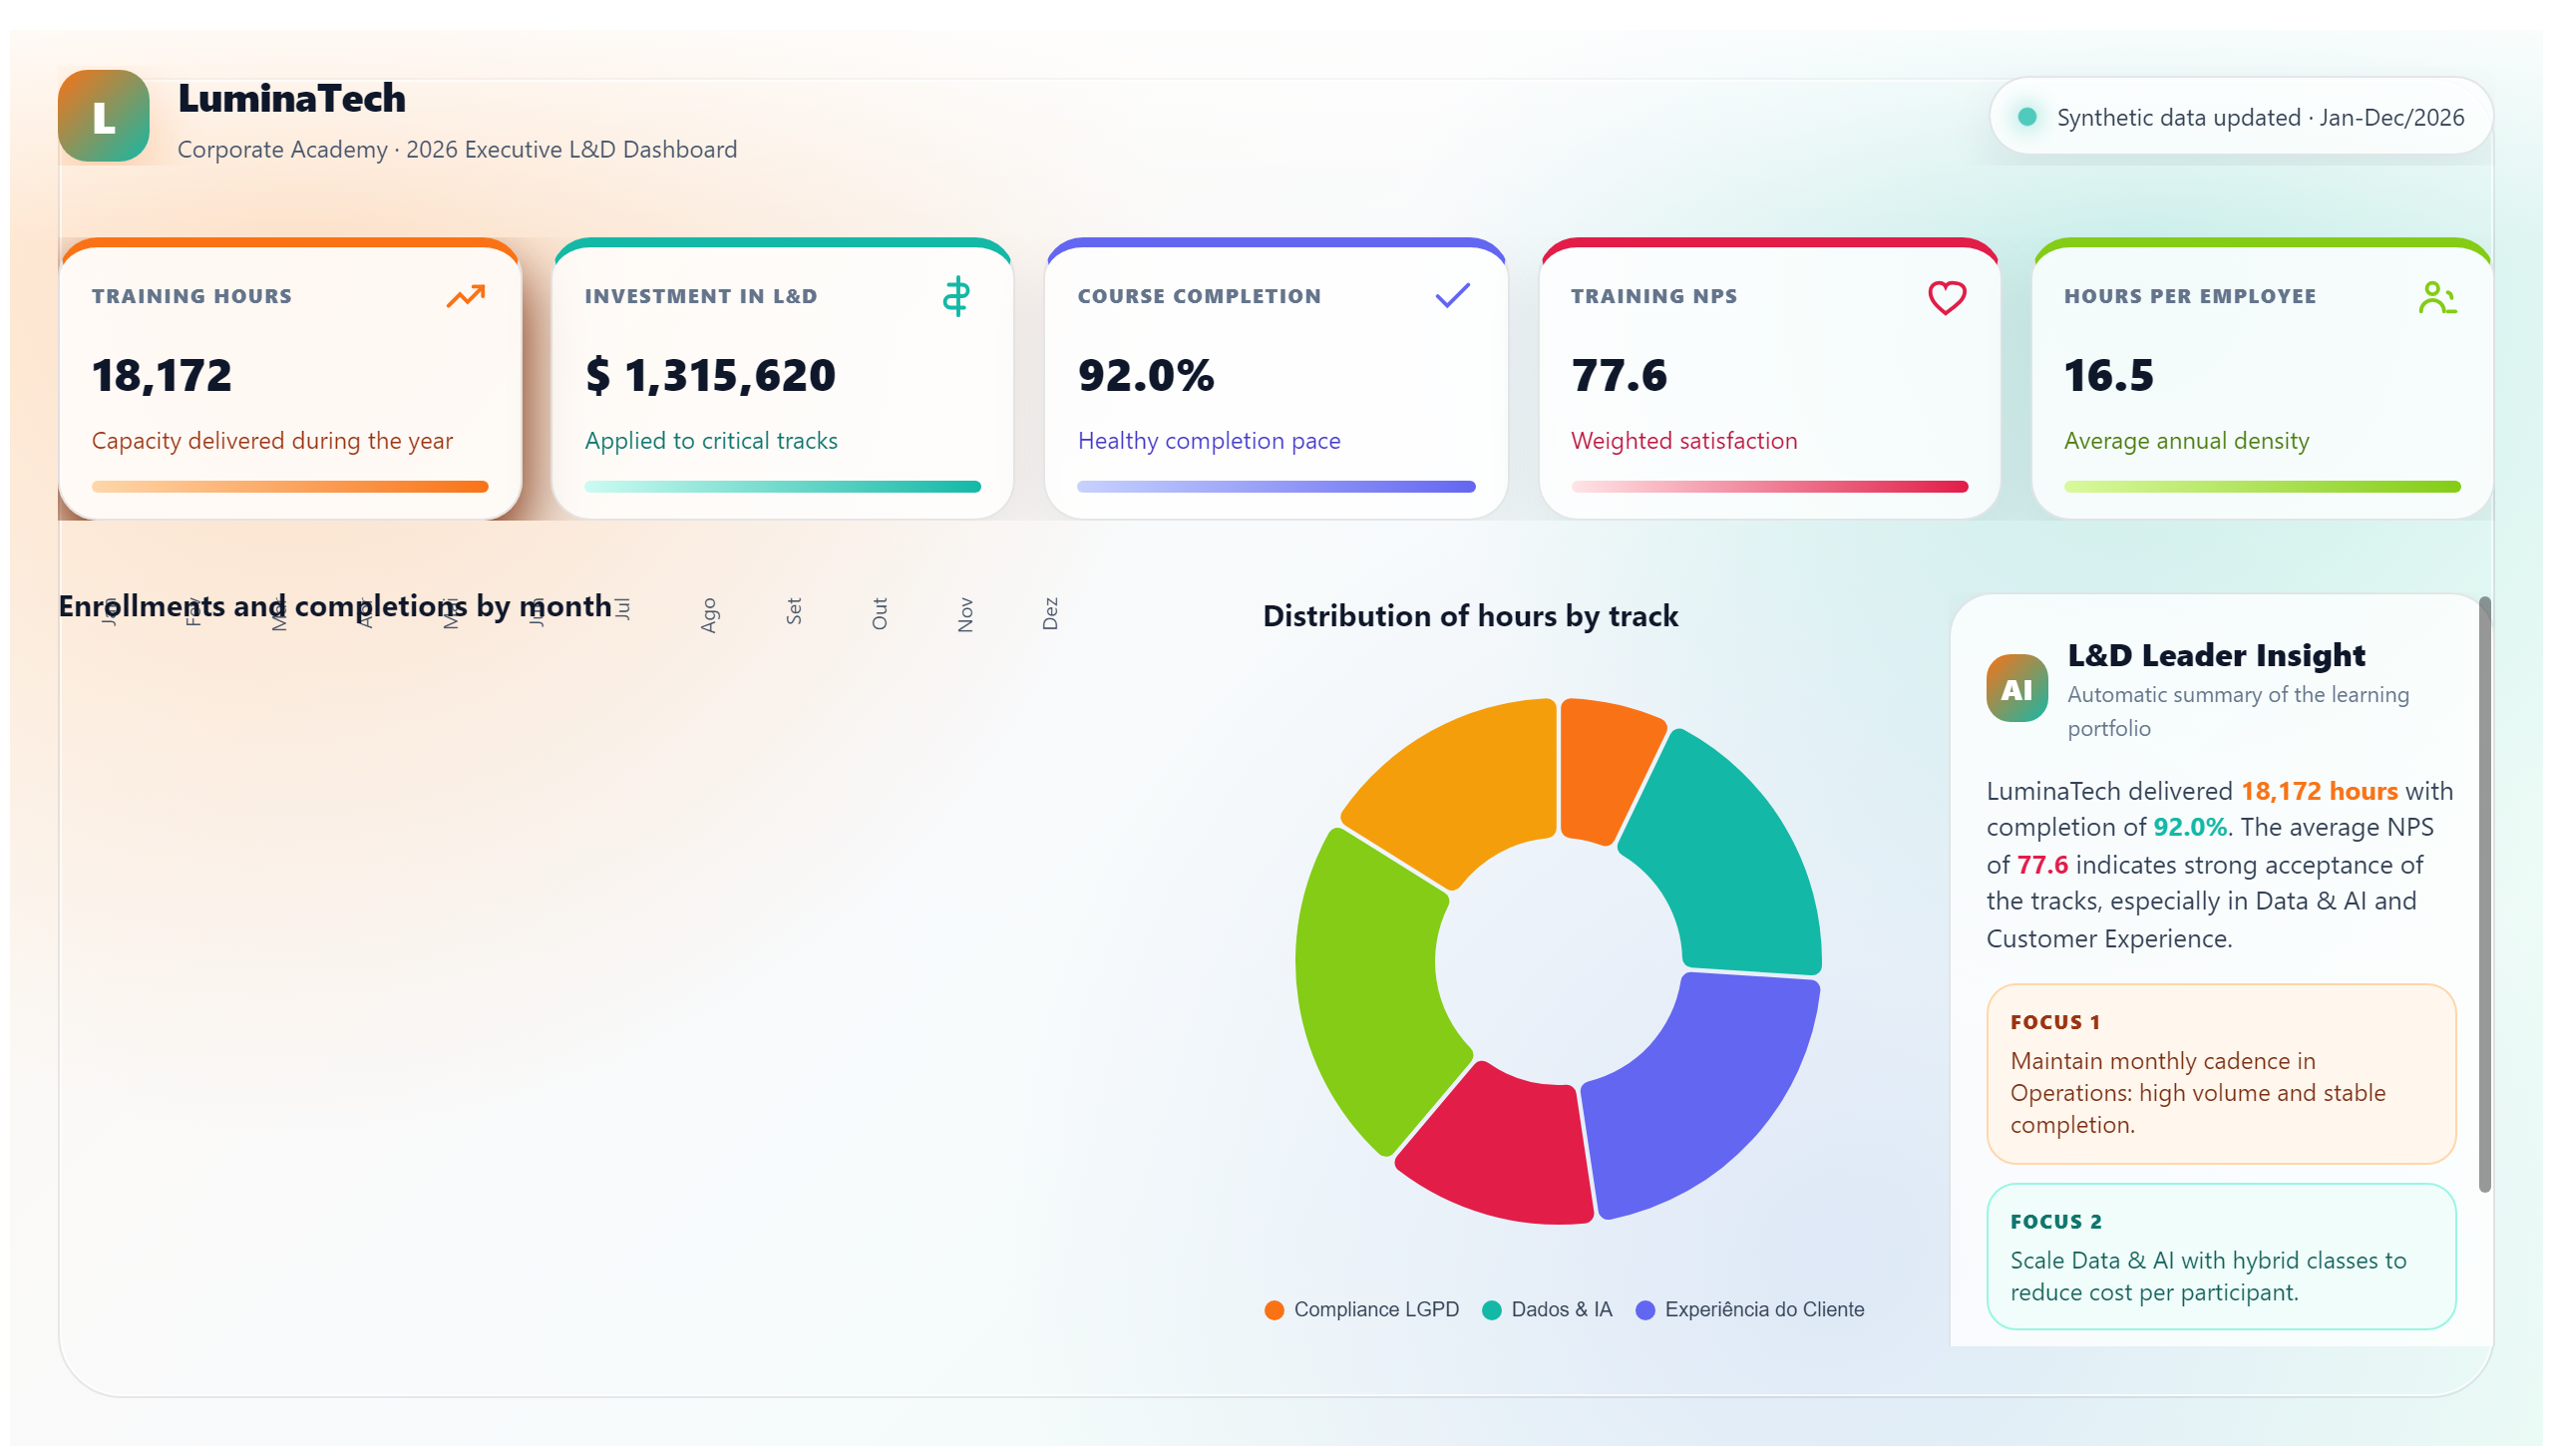
Tech Course Analysis dashboard provides a comprehensive overview of technical courses, focusing on evaluating their effectiveness and impact on participants' career development. It offers insights into course performance, participant progress, and key outcomes that help HR professionals and talent development teams understand how these courses contribute to skill enhancement and workforce readiness.
The dashboard addresses critical business questions such as: Which technical courses yield the best career advancements? How do participants' skills improve after course completion? What is the overall return on investment for these training programs? By visualizing data related to course completion rates, participant feedback, and career progression metrics, it enables decision-makers to optimize training strategies and allocate resources effectively.
This tool is particularly valuable for HR managers, learning and development specialists, and data analysts focused on education and talent development. It supports data-driven decisions to enhance employee skills, improve training programs, and ultimately boost organizational performance.
Frequently asked questions about this dashboard
What key metrics does the Tech Course Analysis dashboard track?
It tracks metrics such as course completion rates, participant skill improvements, career advancement statistics, and overall effectiveness of technical courses.
Who is the primary audience for this dashboard?
The dashboard is designed for HR professionals, talent development teams, and data analysts involved in education and workforce development.
How does this dashboard help improve training programs?
By analyzing participant outcomes and course effectiveness, it provides insights that enable optimization of course content, resource allocation, and training strategies.
Want a dashboard like this with your data?
We build a custom version for your business — US$ 50 per page, delivered within 7 calendar days.
HR Power BI templates
Complete projects built by the Excelverton factory: view them live with a free account and download the PBIP as a channel subscriber (1/month) or Pro subscriber (unlimited).
Create your free account
Save favorites, build collections and use the AI assistant — at no cost.