Zero DRE Dashboard
DRE dashboard that analyzes the company's income statement.
Create a free account
Save your favorite dashboards, get new templates by area and ask the AI assistant — for free.
About the Zero DRE Dashboard dashboard
This is a free Power BI dashboard called Zero DRE Dashboard, in the Financeiro domain. Explore KPIs, interactive visualizations and get inspired for your own data and business intelligence projects.
DRE dashboard that analyzes the company's income statement.
Dashboard analysis
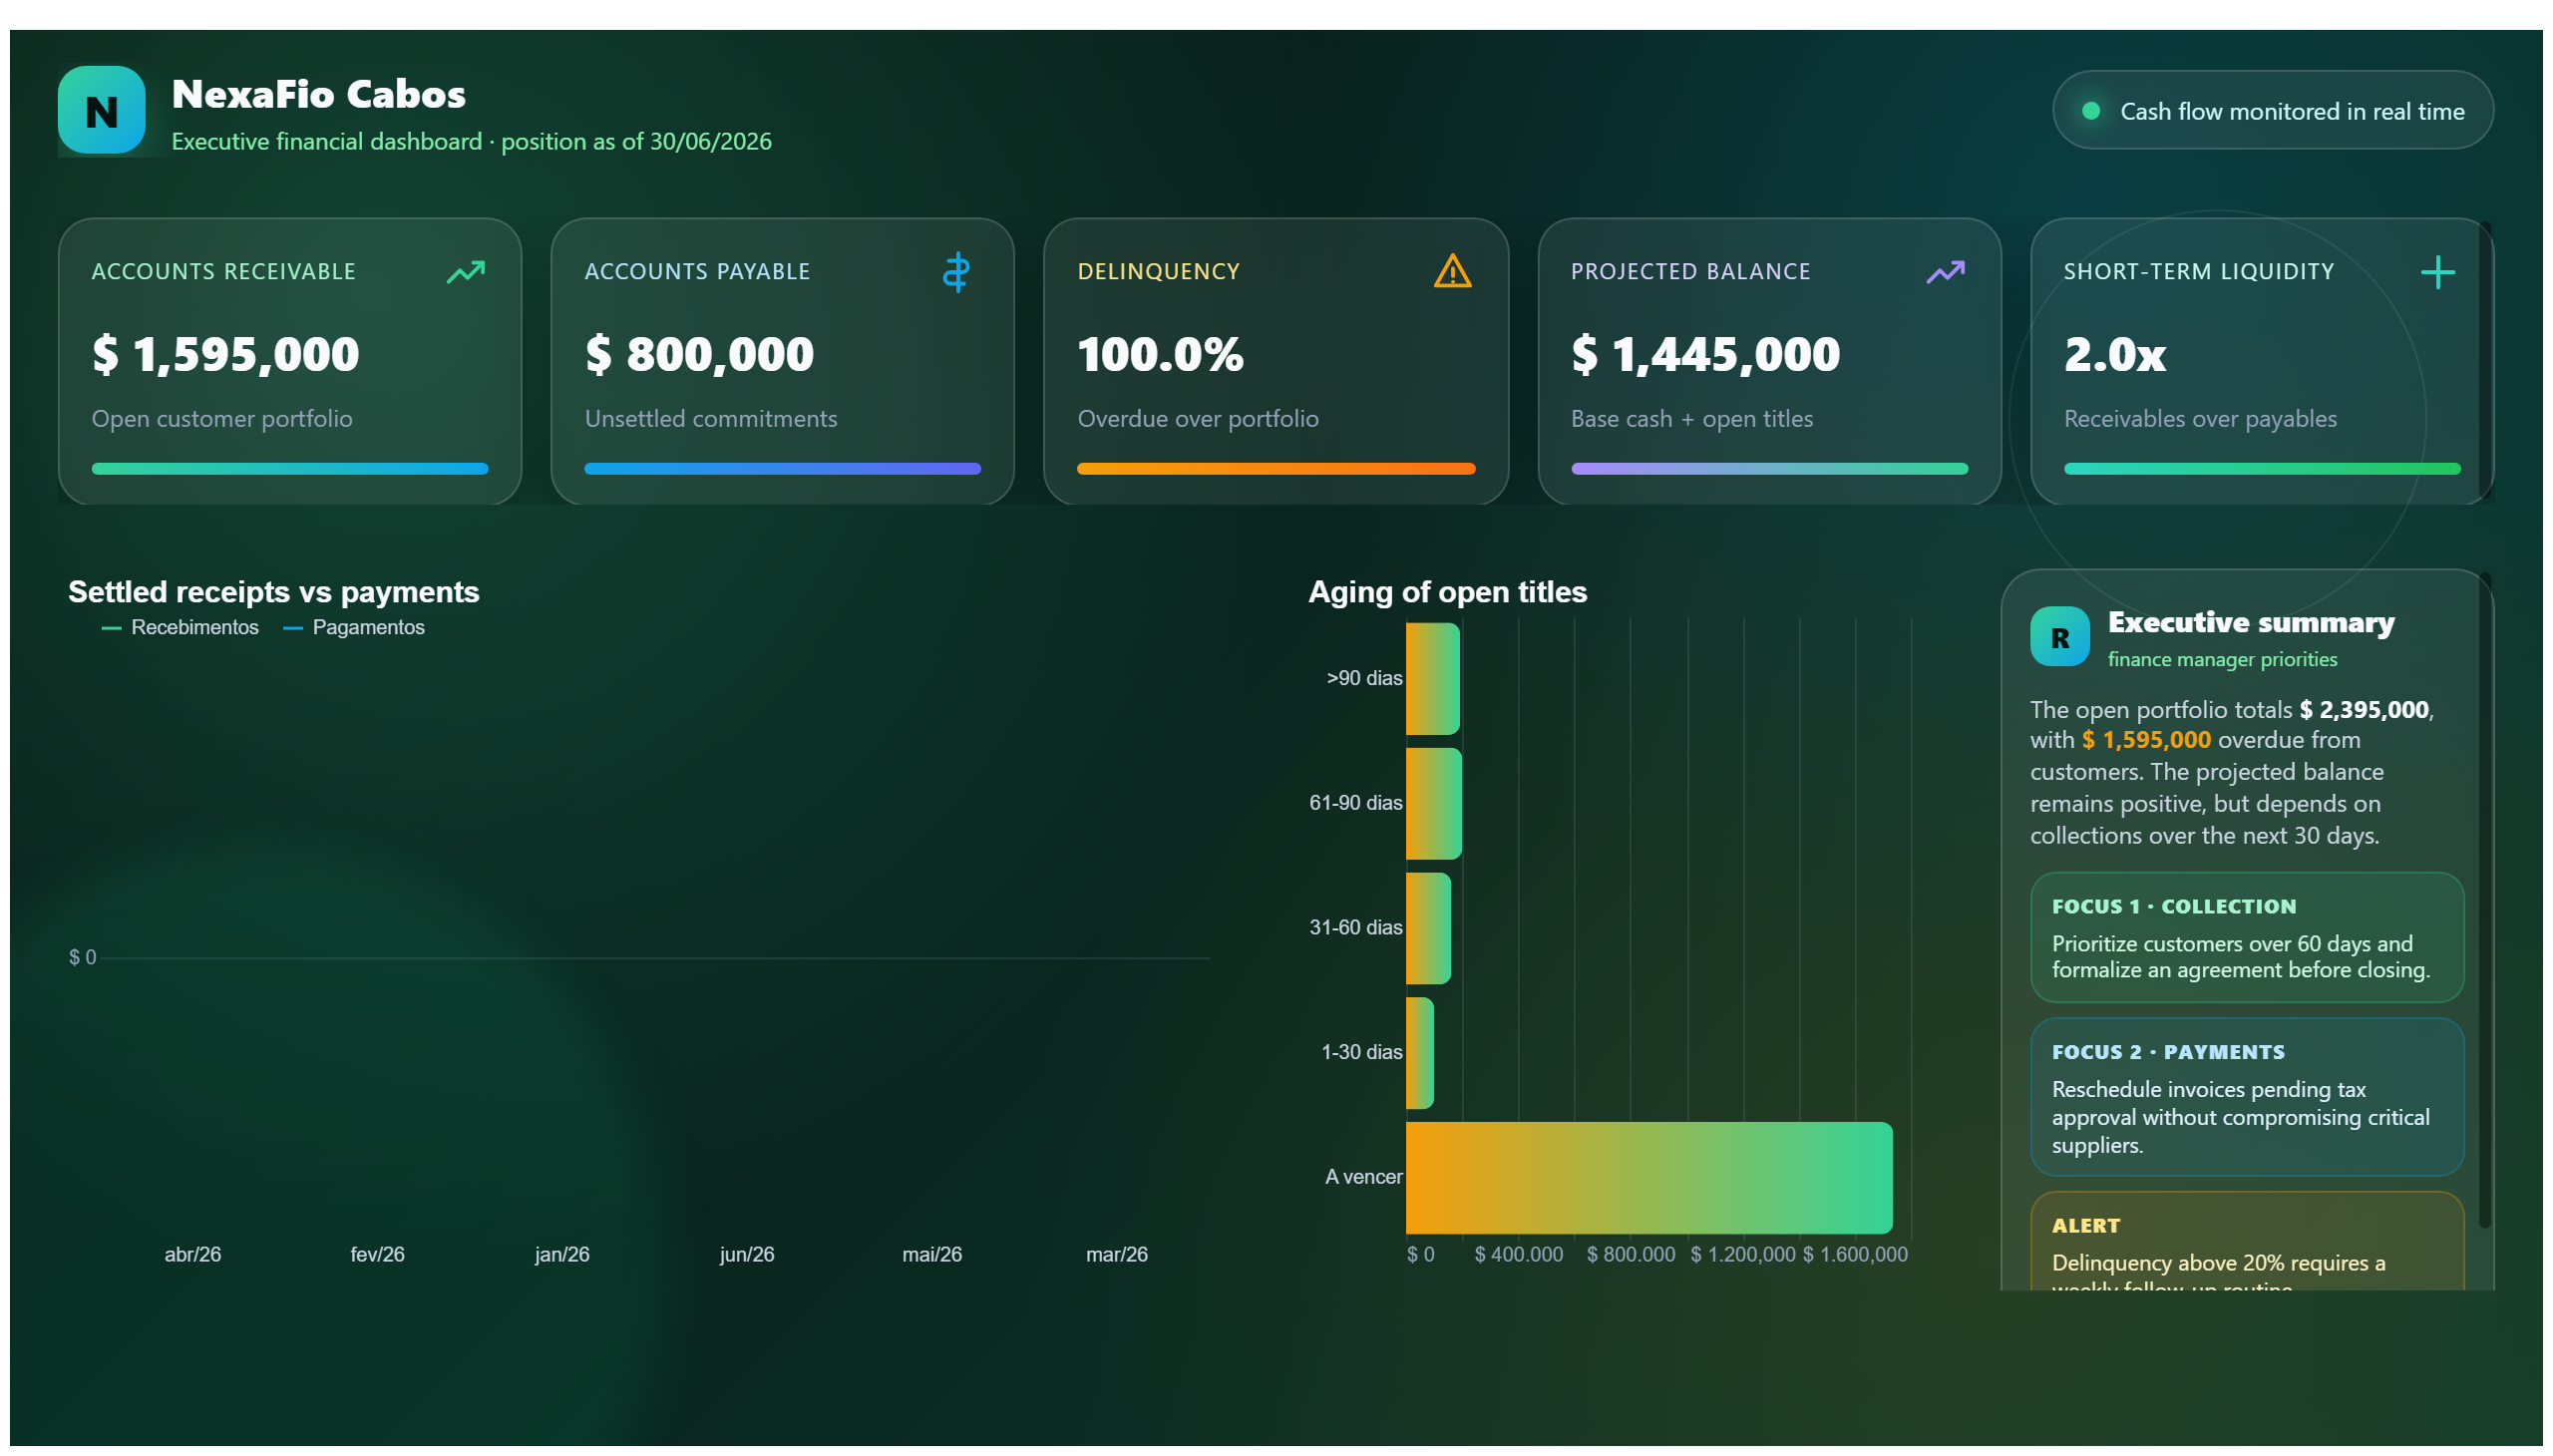
The Dashboard DRE zero provides a comprehensive analysis of a company's income statement, enabling users to gain clear insights into financial performance. It breaks down revenues, costs, and expenses, allowing stakeholders to understand the profitability and operational efficiency of the business. By visualizing key financial metrics, the dashboard helps identify trends and areas that require attention or improvement.
This dashboard answers critical business questions such as: How is the company performing financially over time? Which expense categories are impacting profitability the most? Are revenues growing in line with expectations? It is designed to support financial managers, analysts, and executives who need to monitor financial health and make informed decisions based on accurate and up-to-date data.
With its focus on the income statement, the Dashboard DRE zero is an essential tool for financial control and strategic planning, providing a clear and concise view of the company’s earnings and losses to drive better business outcomes.
Frequently asked questions about this dashboard
What specific financial metrics does the Dashboard DRE zero display?
The dashboard displays key income statement metrics including revenues, costs, expenses, and net profit, enabling detailed analysis of the company's financial results.
Who is the primary audience for this dashboard?
It is primarily designed for financial managers, analysts, and executives who need to track and analyze the company’s income statement for decision-making purposes.
How can this dashboard help improve business performance?
By highlighting trends and variances in revenues and expenses, the dashboard allows users to identify areas of financial strength and weakness, supporting more informed strategic and operational decisions.
Want a dashboard like this with your data?
We build a custom version for your business — US$ 50 per page, delivered within 7 calendar days.
Finance Power BI templates
Complete projects built by the Excelverton factory: view them live with a free account and download the PBIP as a channel subscriber (1/month) or Pro subscriber (unlimited).
Create your free account
Save favorites, build collections and use the AI assistant — at no cost.