HealthCare_Project-Dashboard
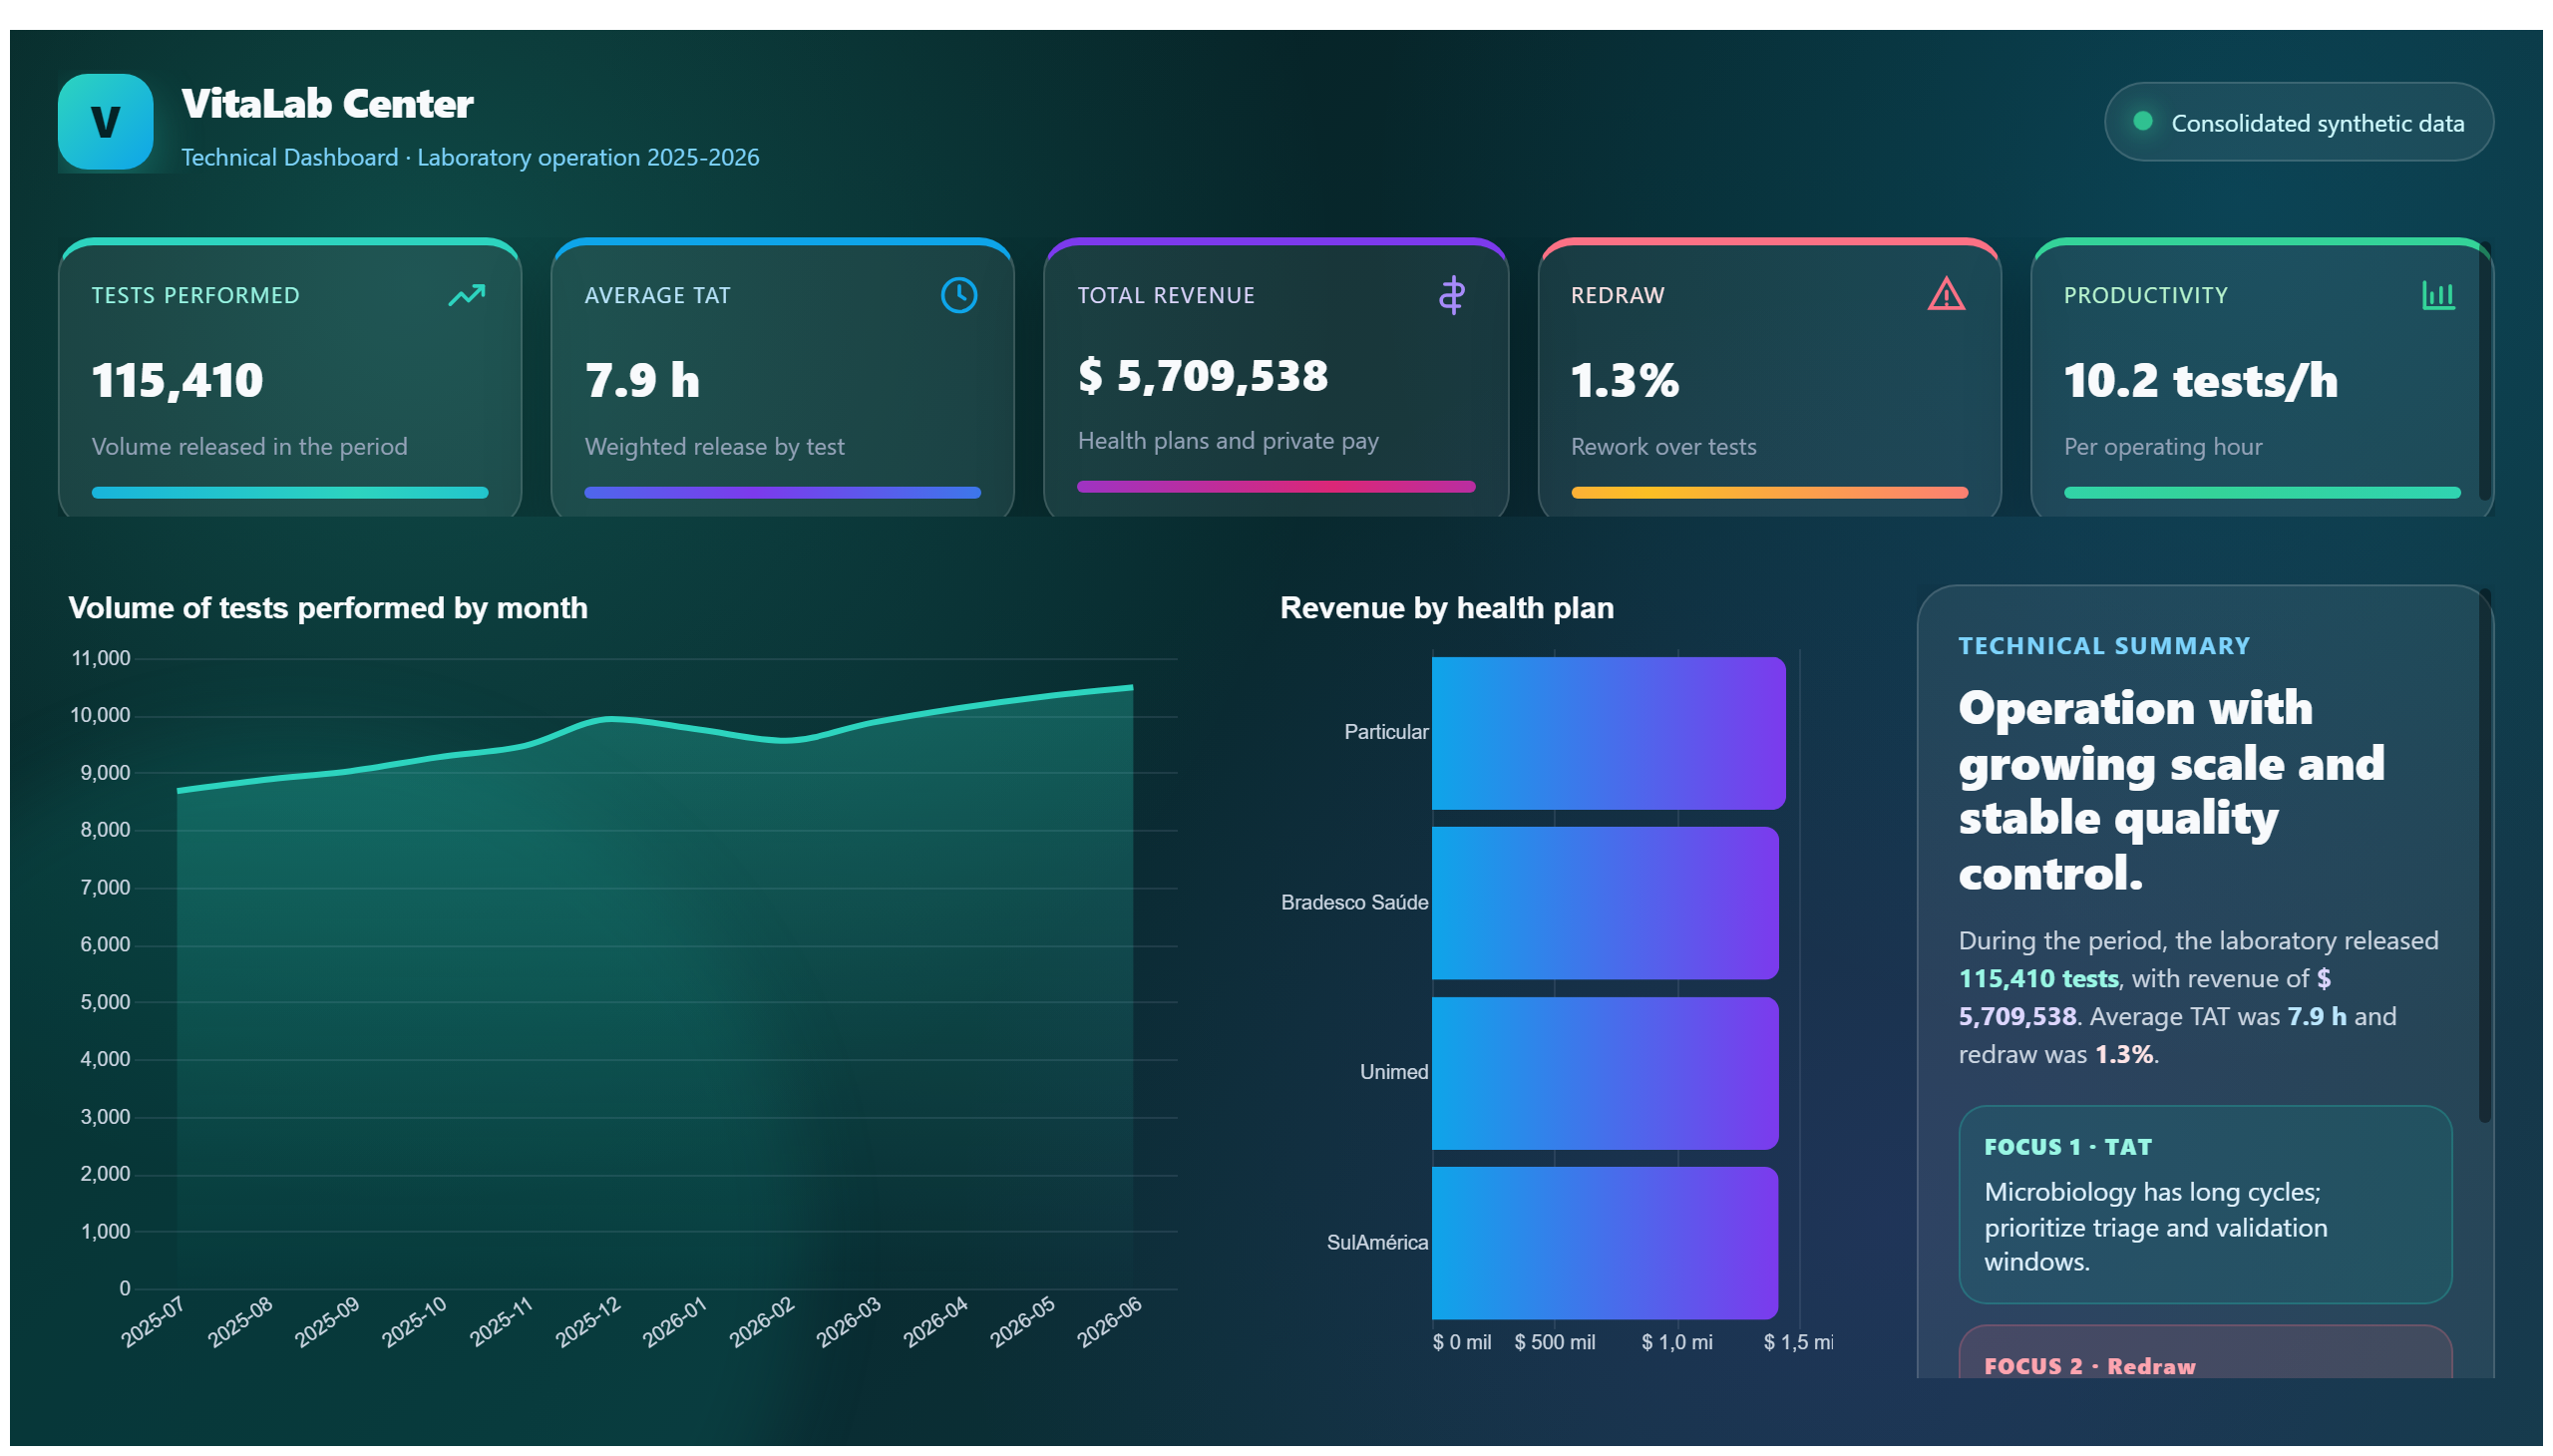
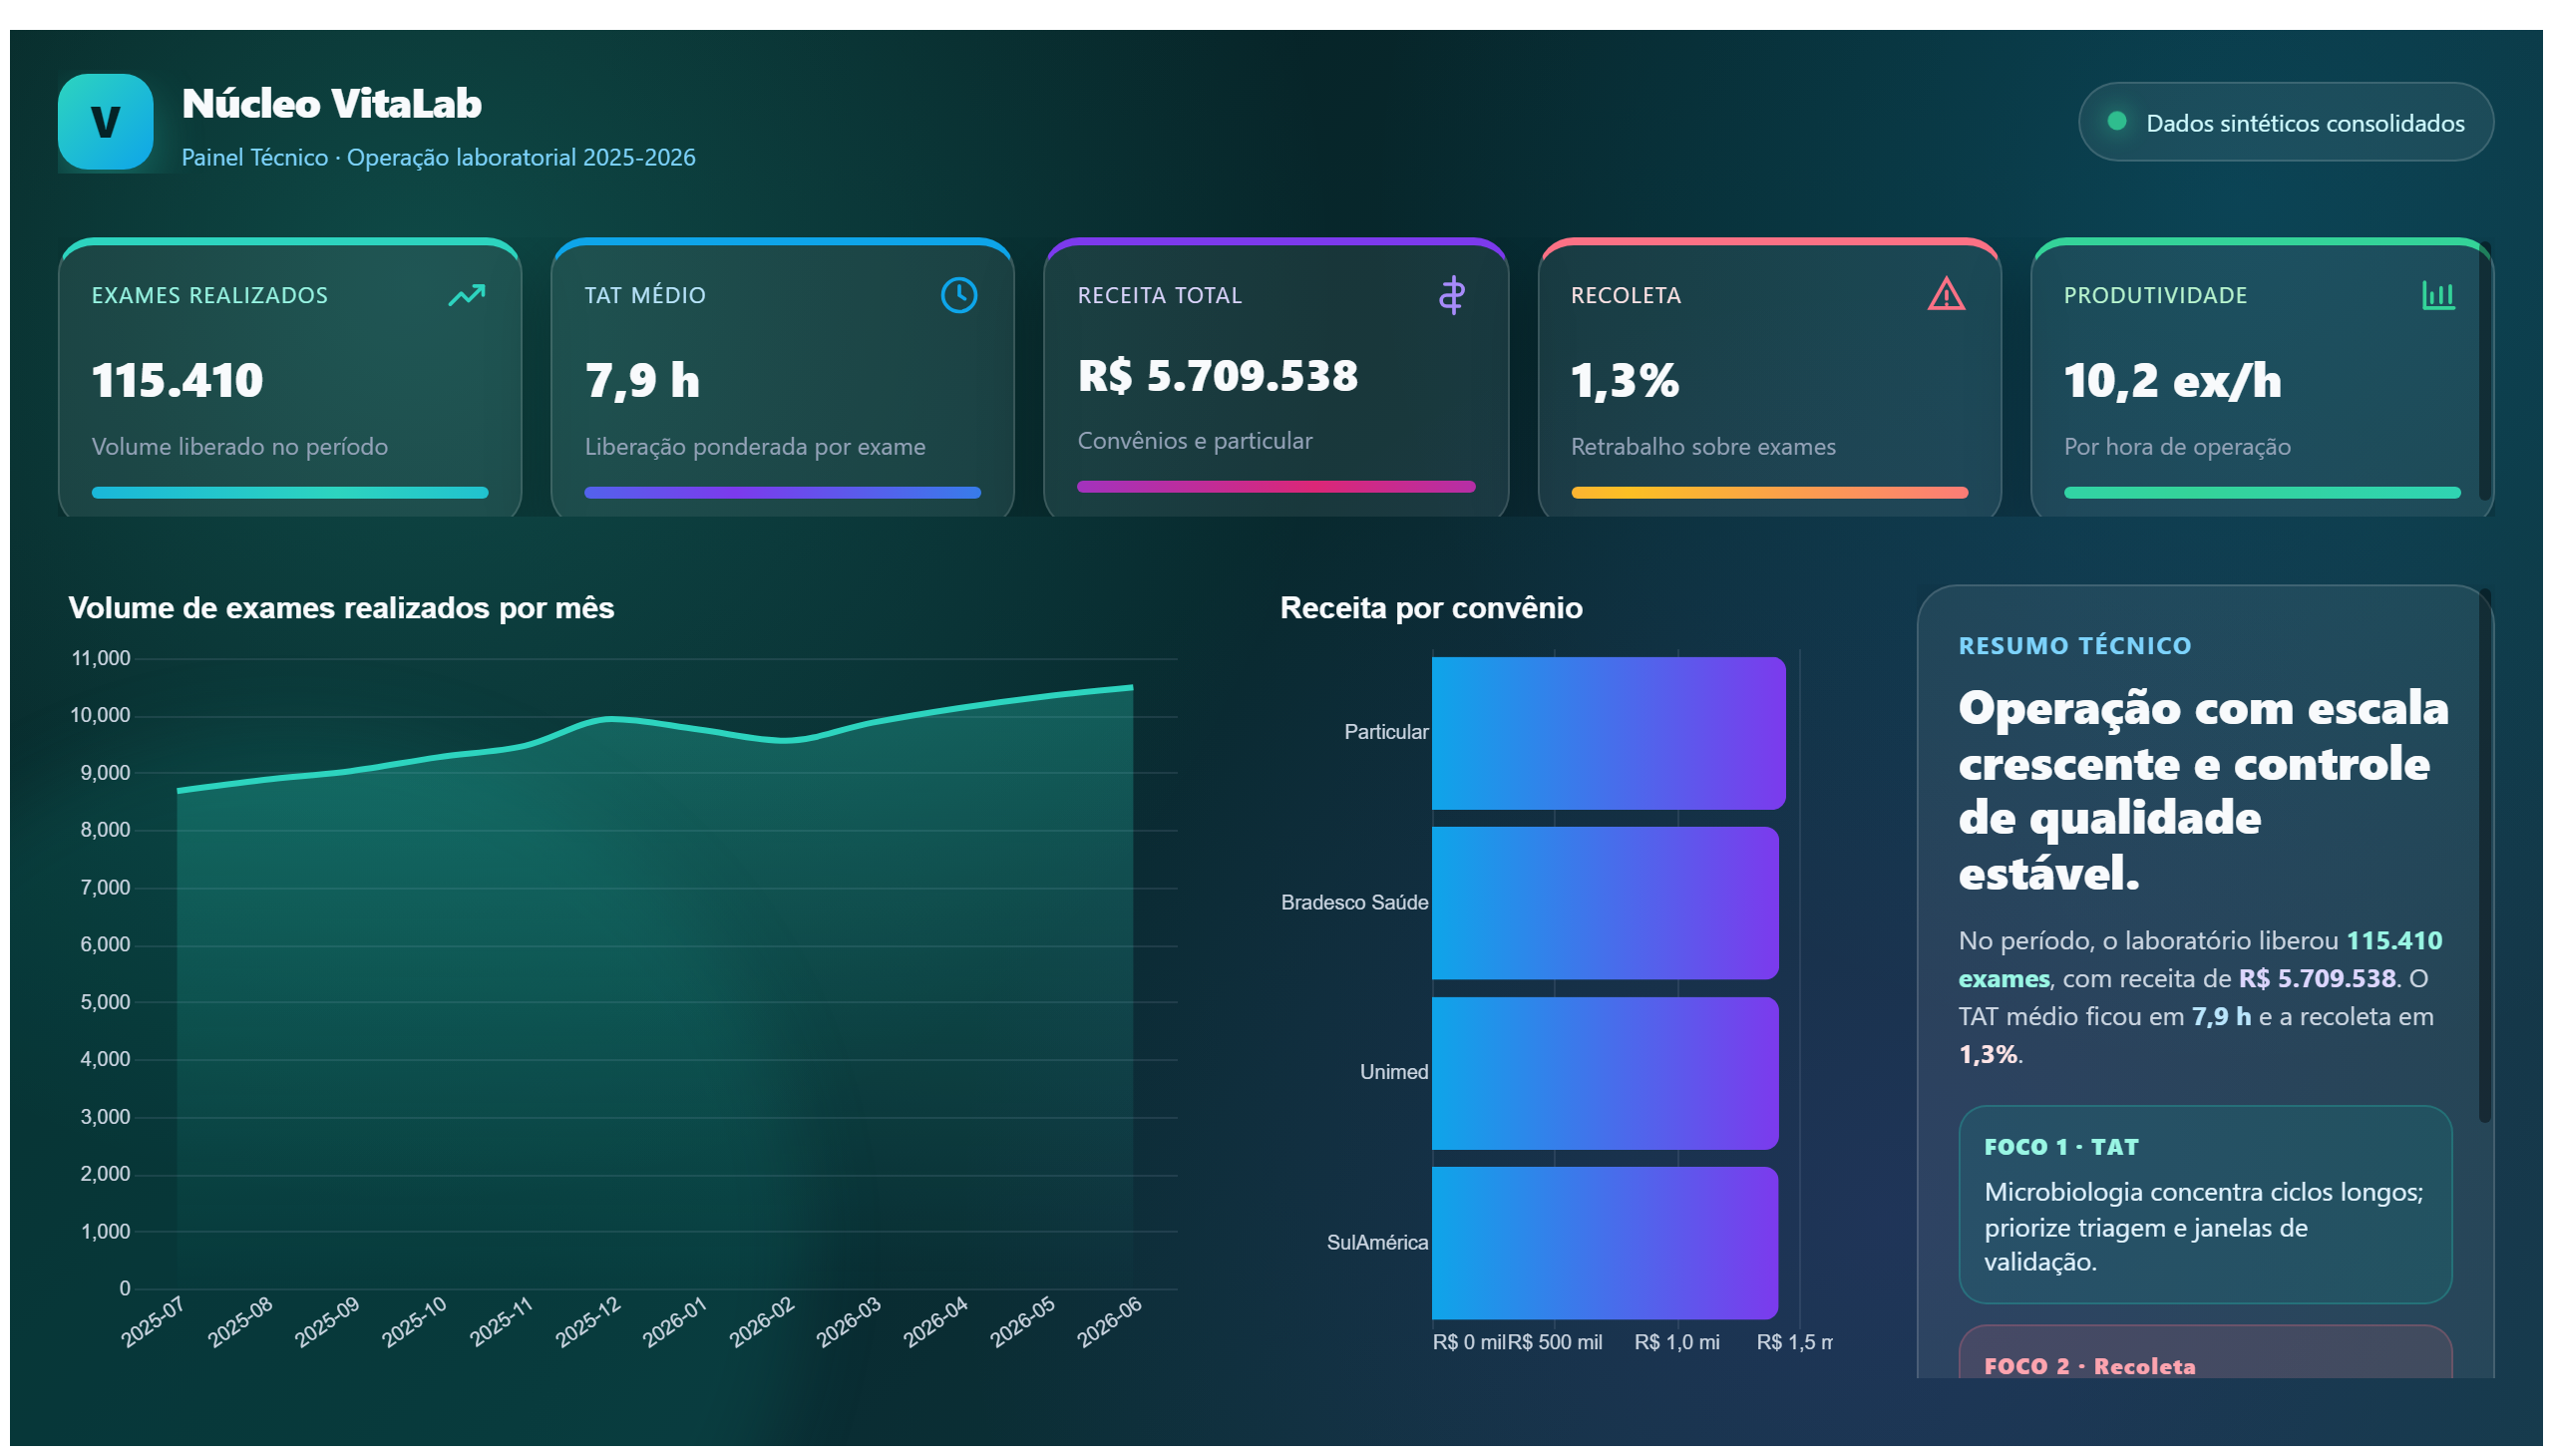
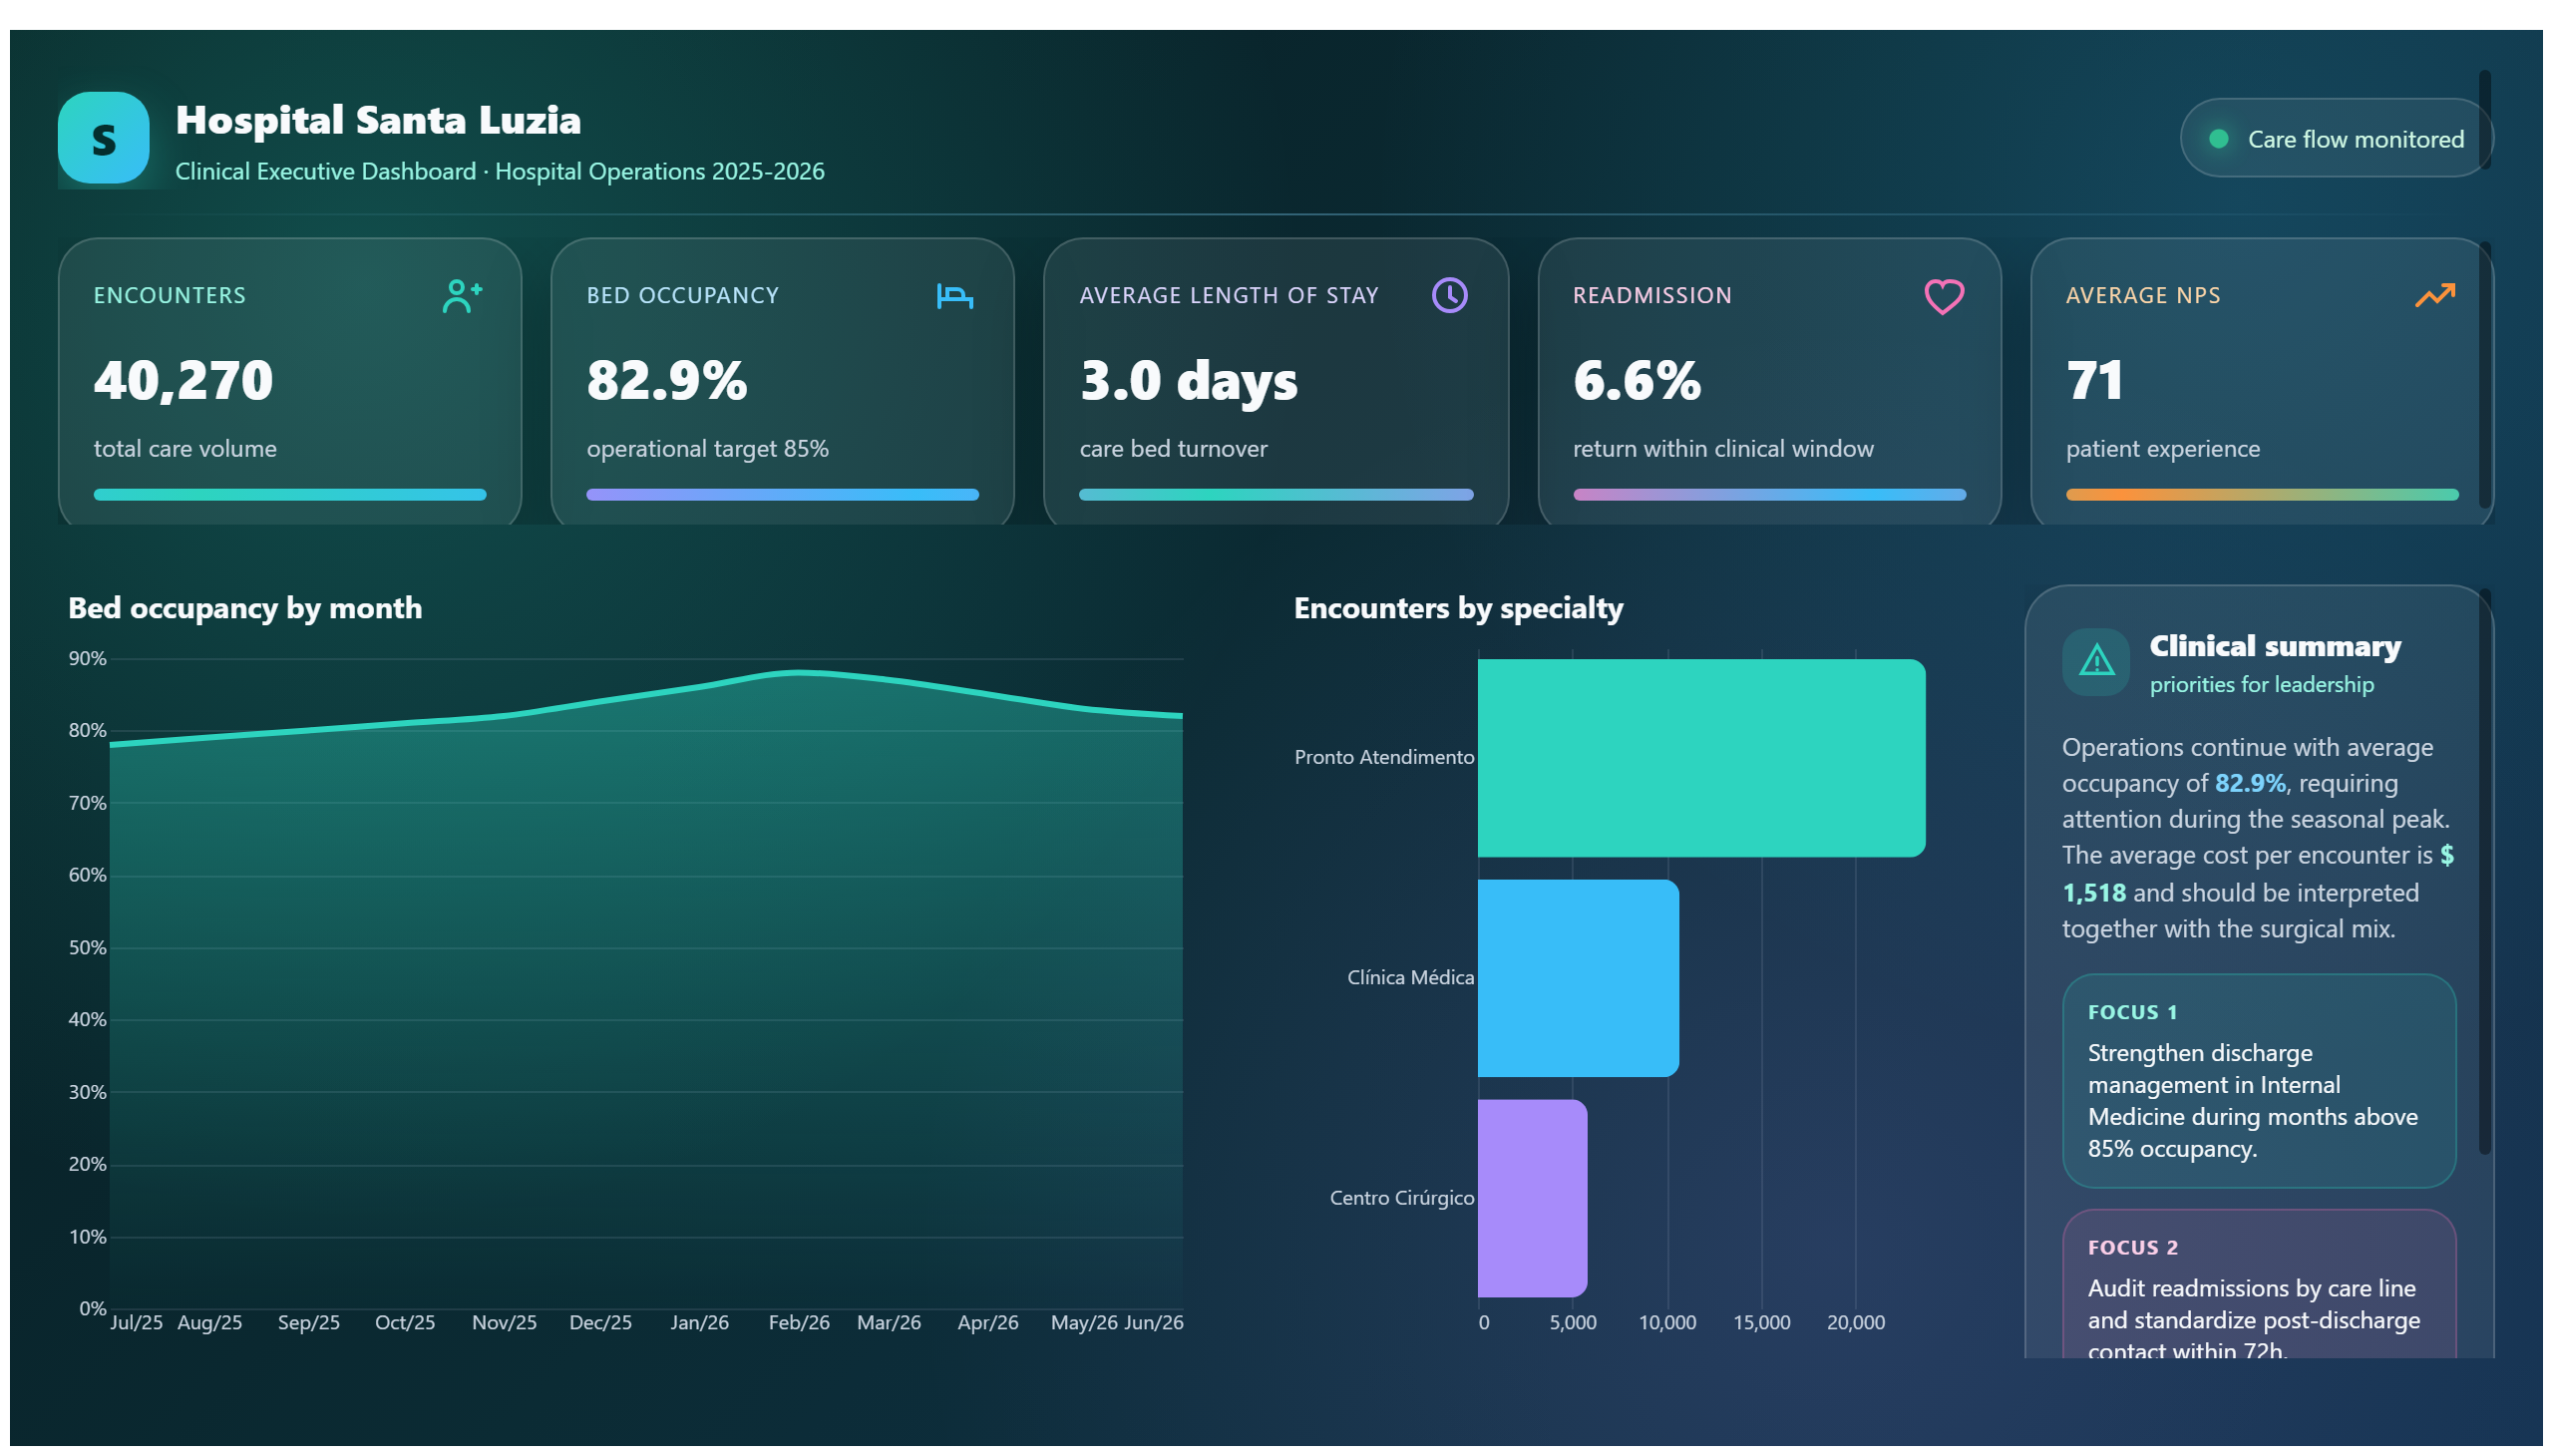
This health dashboard provides an overview of data from health-related projects.
This report presents healthcare data, addressing performance and quality indicators.
Save your favorite dashboards, get new templates by area and ask the AI assistant — for free.
This is a free Power BI dashboard called Health Care Report, in the Saúde domain. Explore KPIs, interactive visualizations and get inspired for your own data and business intelligence projects.
This report presents healthcare data, addressing performance and quality indicators.
The Health Care Report dashboard provides a comprehensive overview of health-related data, focusing on key performance and quality indicators. It enables healthcare professionals and administrators to monitor critical metrics such as patient outcomes, service efficiency, and overall care quality. By visualizing these indicators, the dashboard supports data-driven decision-making aimed at improving healthcare delivery.
This report answers essential business questions like: How well are healthcare services performing against established benchmarks? Which areas require quality improvements? What trends can be observed in patient care over time? The dashboard is designed for healthcare managers, quality assurance teams, and policy makers who need actionable insights to enhance operational effectiveness and patient satisfaction.
The dashboard covers performance and quality indicators related to patient outcomes and healthcare service efficiency.
Healthcare managers, quality assurance teams, and policy makers are the main users who benefit from the insights provided.
By highlighting key performance metrics and quality issues, the dashboard enables targeted interventions to enhance patient care and operational efficiency.
We build a custom version for your business — US$ 50 per page, delivered within 7 calendar days.
Explore more Power BI dashboards from the same domain to compare KPIs, layouts and analytics models.
This health dashboard provides an overview of data from health-related projects.
This health dashboard likely provides an overview of health and performance metrics.
This report presents a dataset about the coronavirus, possibly including statistics and trends.
This report presents data on health and wellness, possibly focusing on fitness metrics.
Complete projects built by the Excelverton factory: view them live and download the PBIP — 1 free downloads every 30 days with a free account, unlimited on Pro.
Save favorites, build collections and use the AI assistant — at no cost.