Business Impact Analysis project
Business impact analysis project addressing different scenarios and outcomes.
Create a free account
Save your favorite dashboards, get new templates by area and ask the AI assistant — for free.
About the Business Impact Analysis project dashboard
This is a free Power BI dashboard called Business Impact Analysis project, in the Financeiro domain. Explore KPIs, interactive visualizations and get inspired for your own data and business intelligence projects.
Business impact analysis project addressing different scenarios and outcomes.
Dashboard analysis
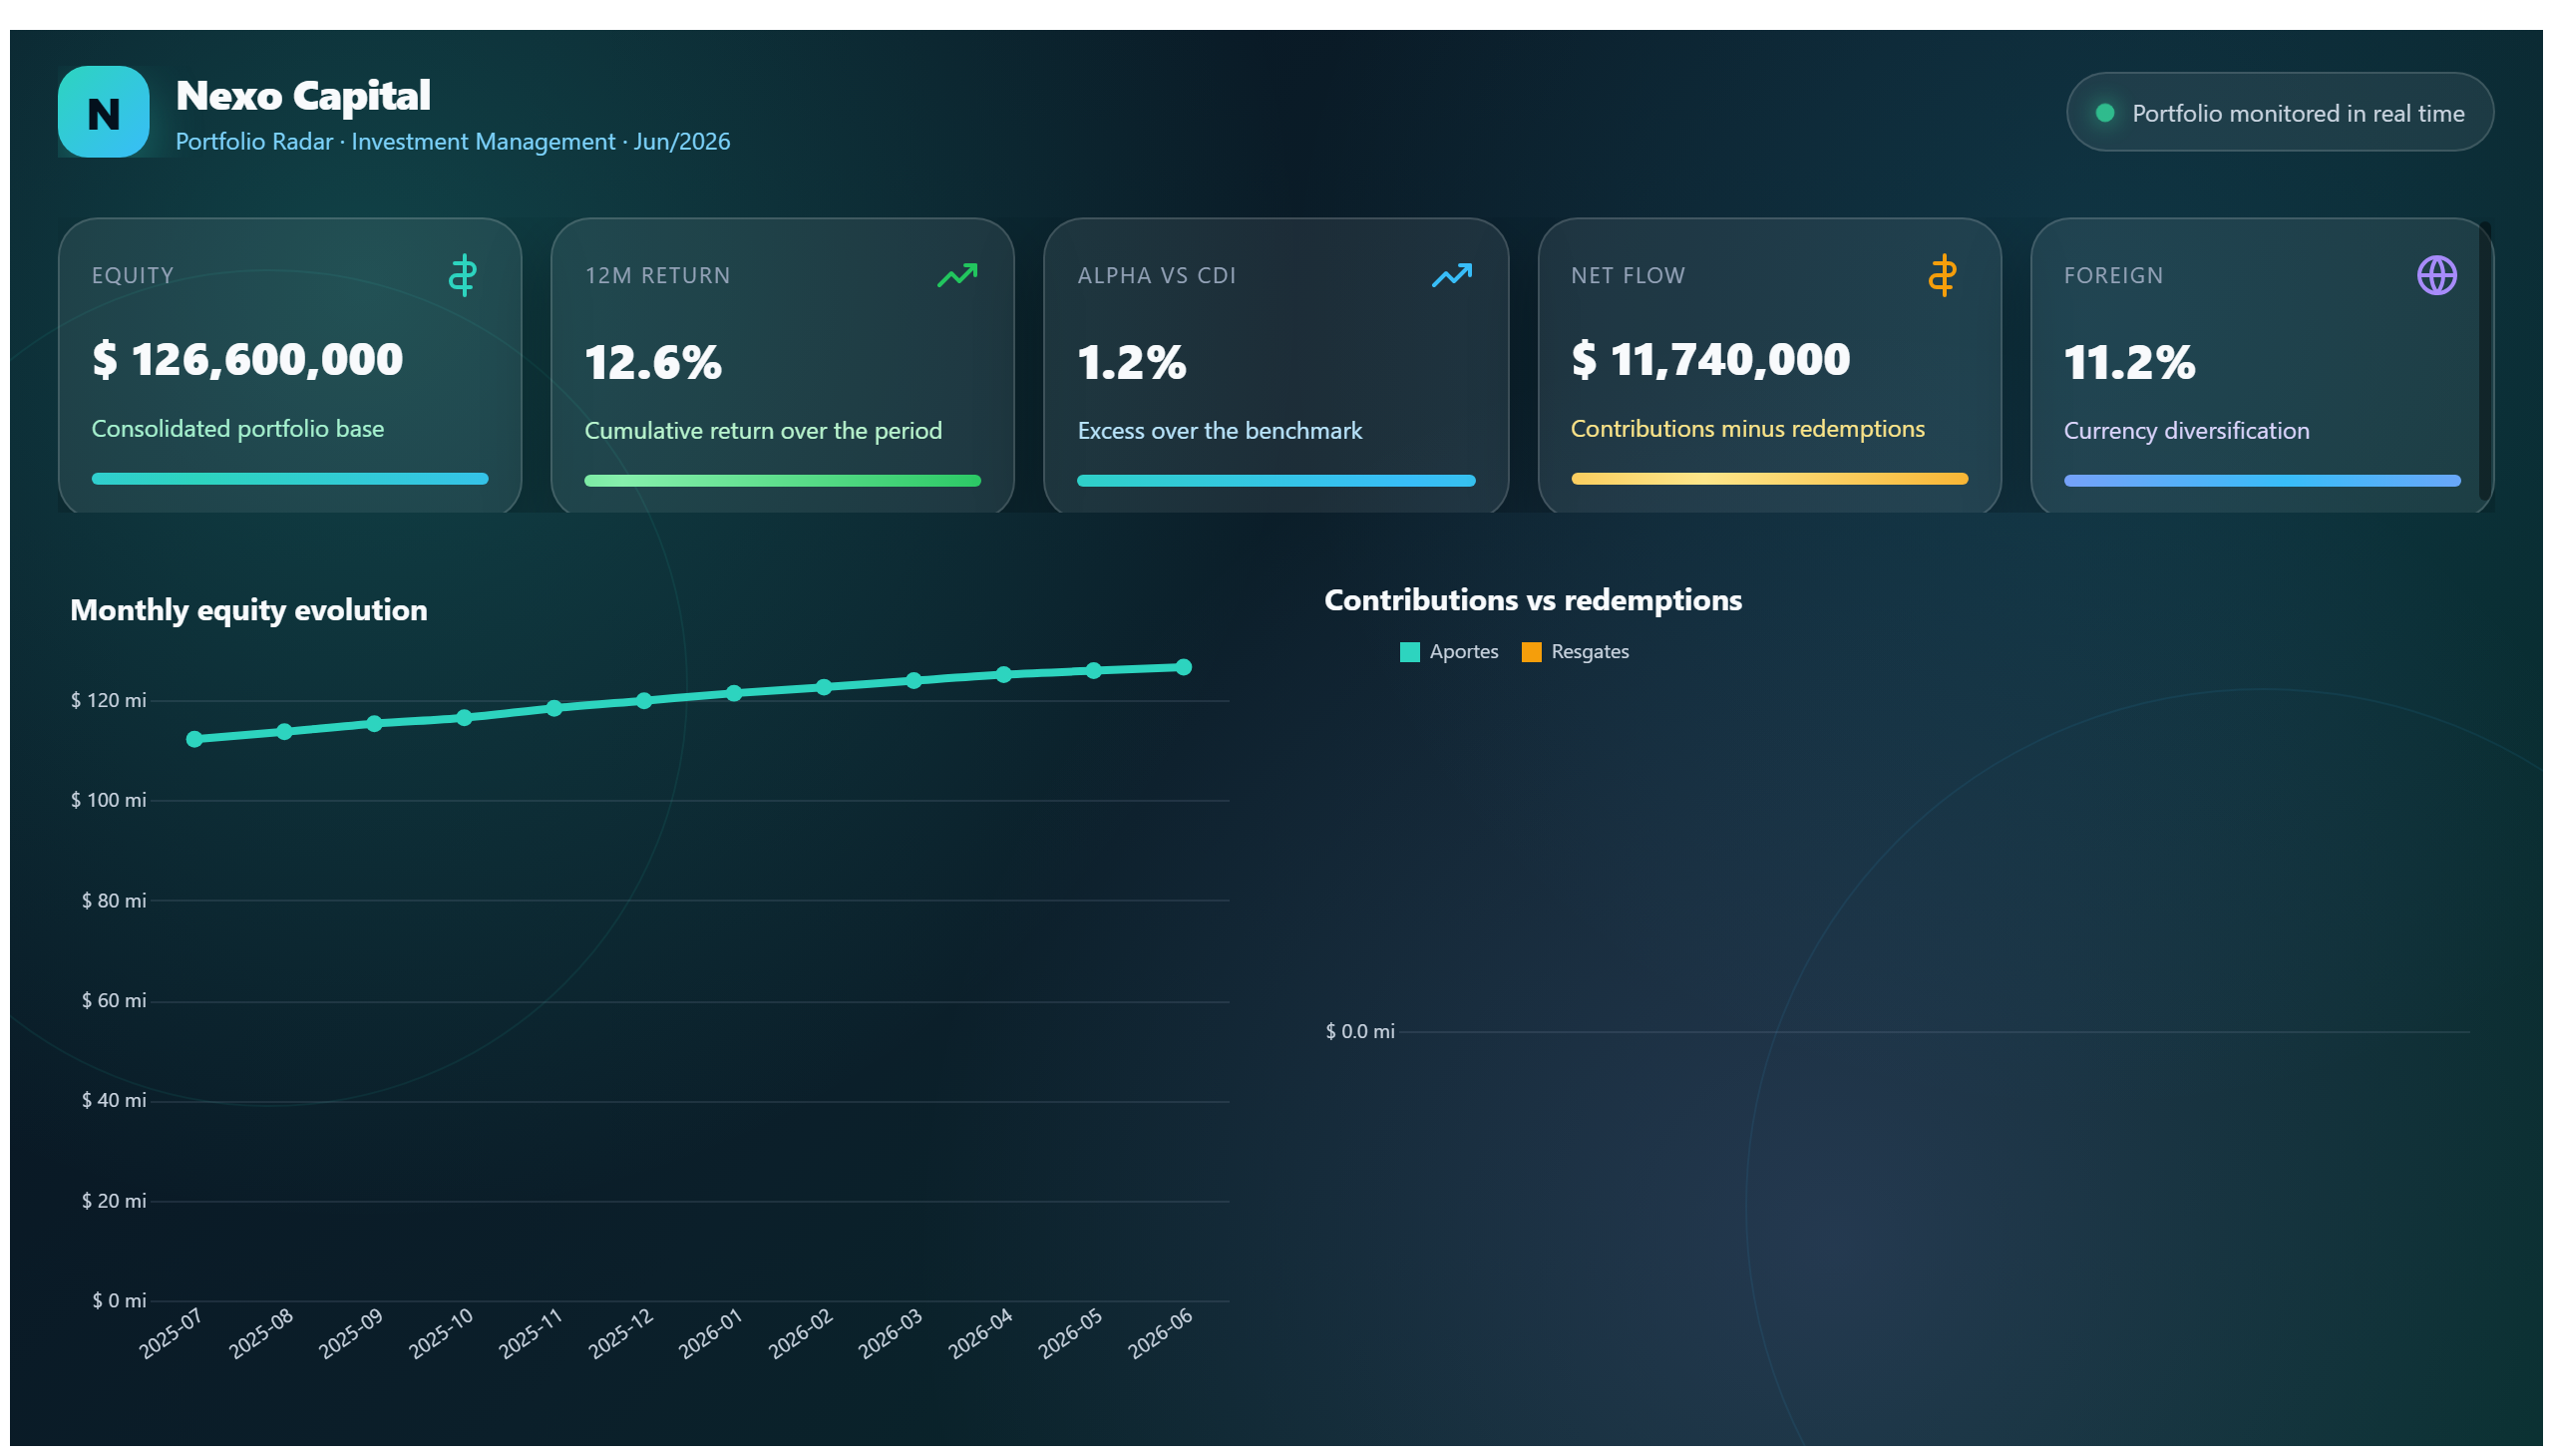
The Business Impact Analysis project dashboard provides a comprehensive overview of how various business scenarios affect financial outcomes. Designed for finance professionals and management teams, it enables users to explore different impact scenarios and understand their potential consequences on the organization's financial health. By visualizing key metrics and results, stakeholders can make informed decisions to mitigate risks and optimize strategies.
This dashboard answers critical business questions such as: What are the financial implications of specific operational disruptions? How do different scenarios affect cash flow, revenue, and expenses? Which areas of the business are most vulnerable to impact? By addressing these questions, the tool supports risk management and strategic planning efforts within the finance domain.
Overall, the dashboard serves as a vital resource for financial analysts, risk managers, and executives who need to assess and prepare for potential business impacts. Its clear presentation of data and scenario outcomes facilitates proactive decision-making and enhances organizational resilience.
Frequently asked questions about this dashboard
What types of scenarios can be analyzed in this dashboard?
The dashboard allows users to explore different business impact scenarios, including operational disruptions and financial changes, to assess their effects on key financial metrics.
Who is the primary audience for this dashboard?
It is primarily designed for finance professionals, risk managers, and executives involved in financial planning and business continuity management.
How does this dashboard support decision-making?
By presenting detailed analyses of various impact scenarios and their financial outcomes, it helps stakeholders identify vulnerabilities and make informed strategic decisions.
Want a dashboard like this with your data?
We build a custom version for your business — US$ 50 per page, delivered within 7 calendar days.
Finance Power BI templates
Complete projects built by the Excelverton factory: view them live with a free account and download the PBIP as a channel subscriber (1/month) or Pro subscriber (unlimited).
Create your free account
Save favorites, build collections and use the AI assistant — at no cost.