Sample-Financials
Financial statements report, possibly presenting financial data of a company.
Create a free account
Save your favorite dashboards, get new templates by area and ask the AI assistant — for free.
About the Sample-Financials dashboard
This is a free Power BI dashboard called Sample-Financials, in the Financeiro domain. Explore KPIs, interactive visualizations and get inspired for your own data and business intelligence projects.
Financial statements report, possibly presenting financial data of a company.
Dashboard analysis
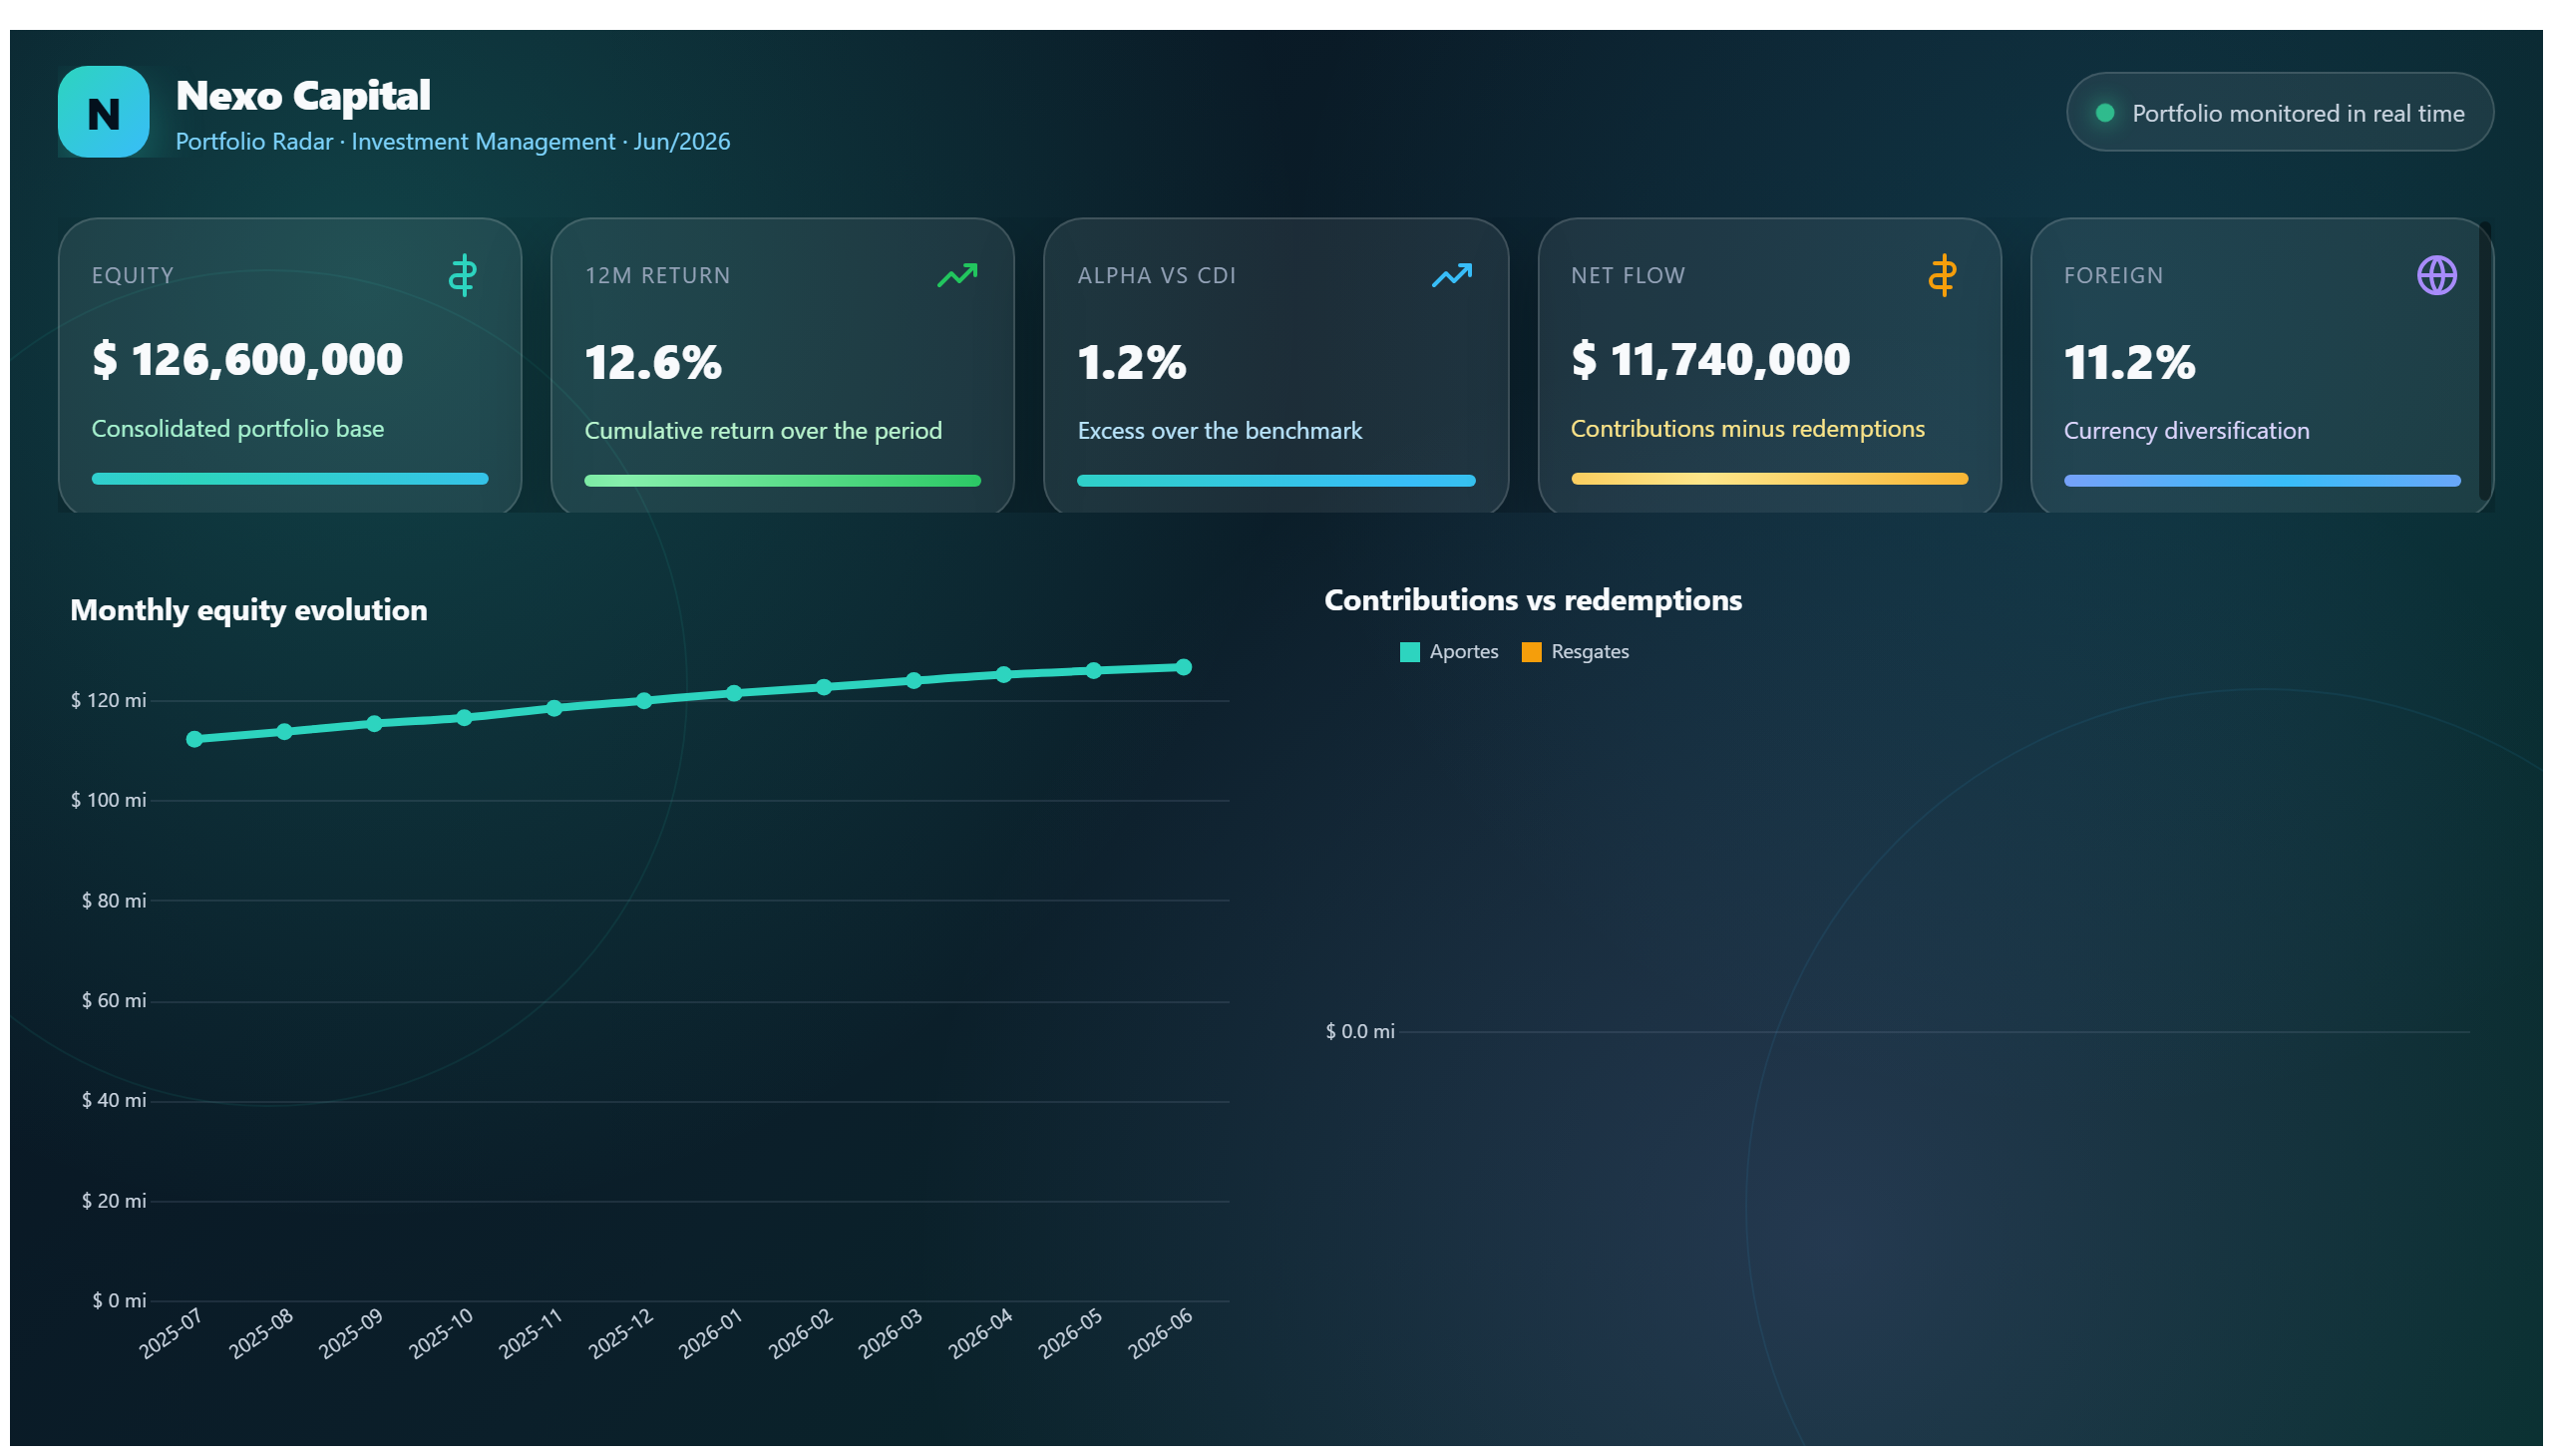
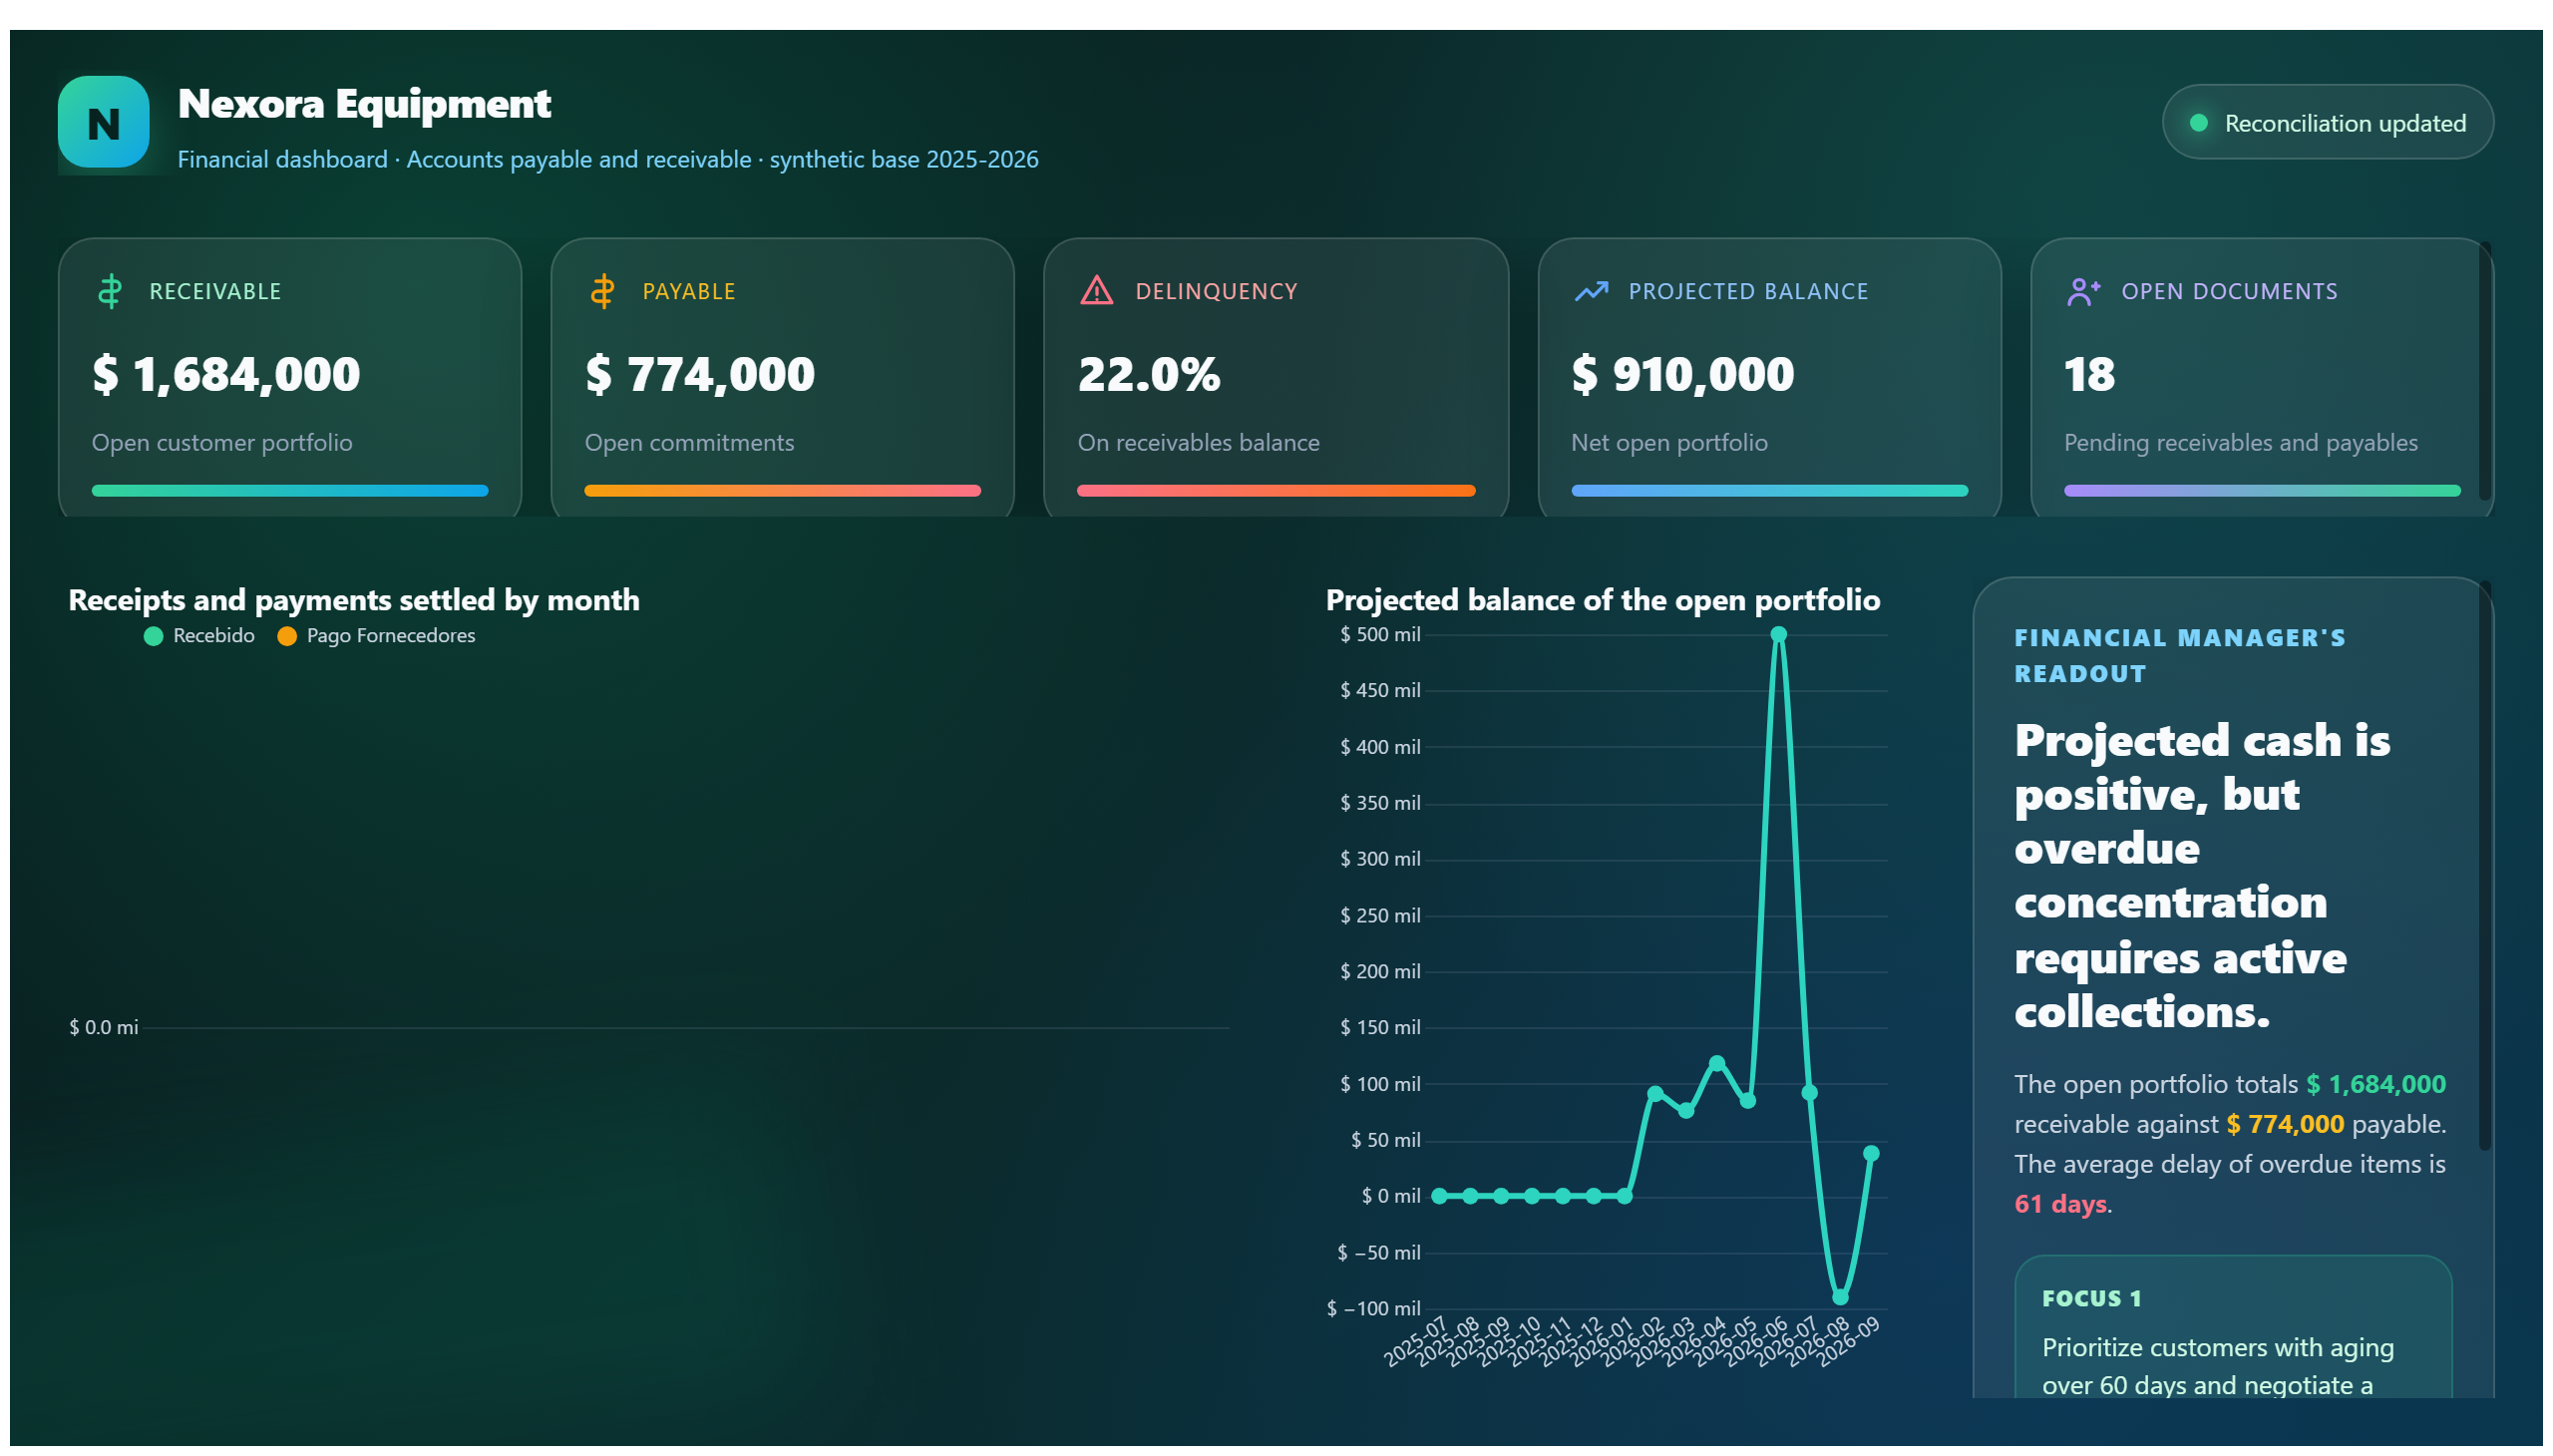
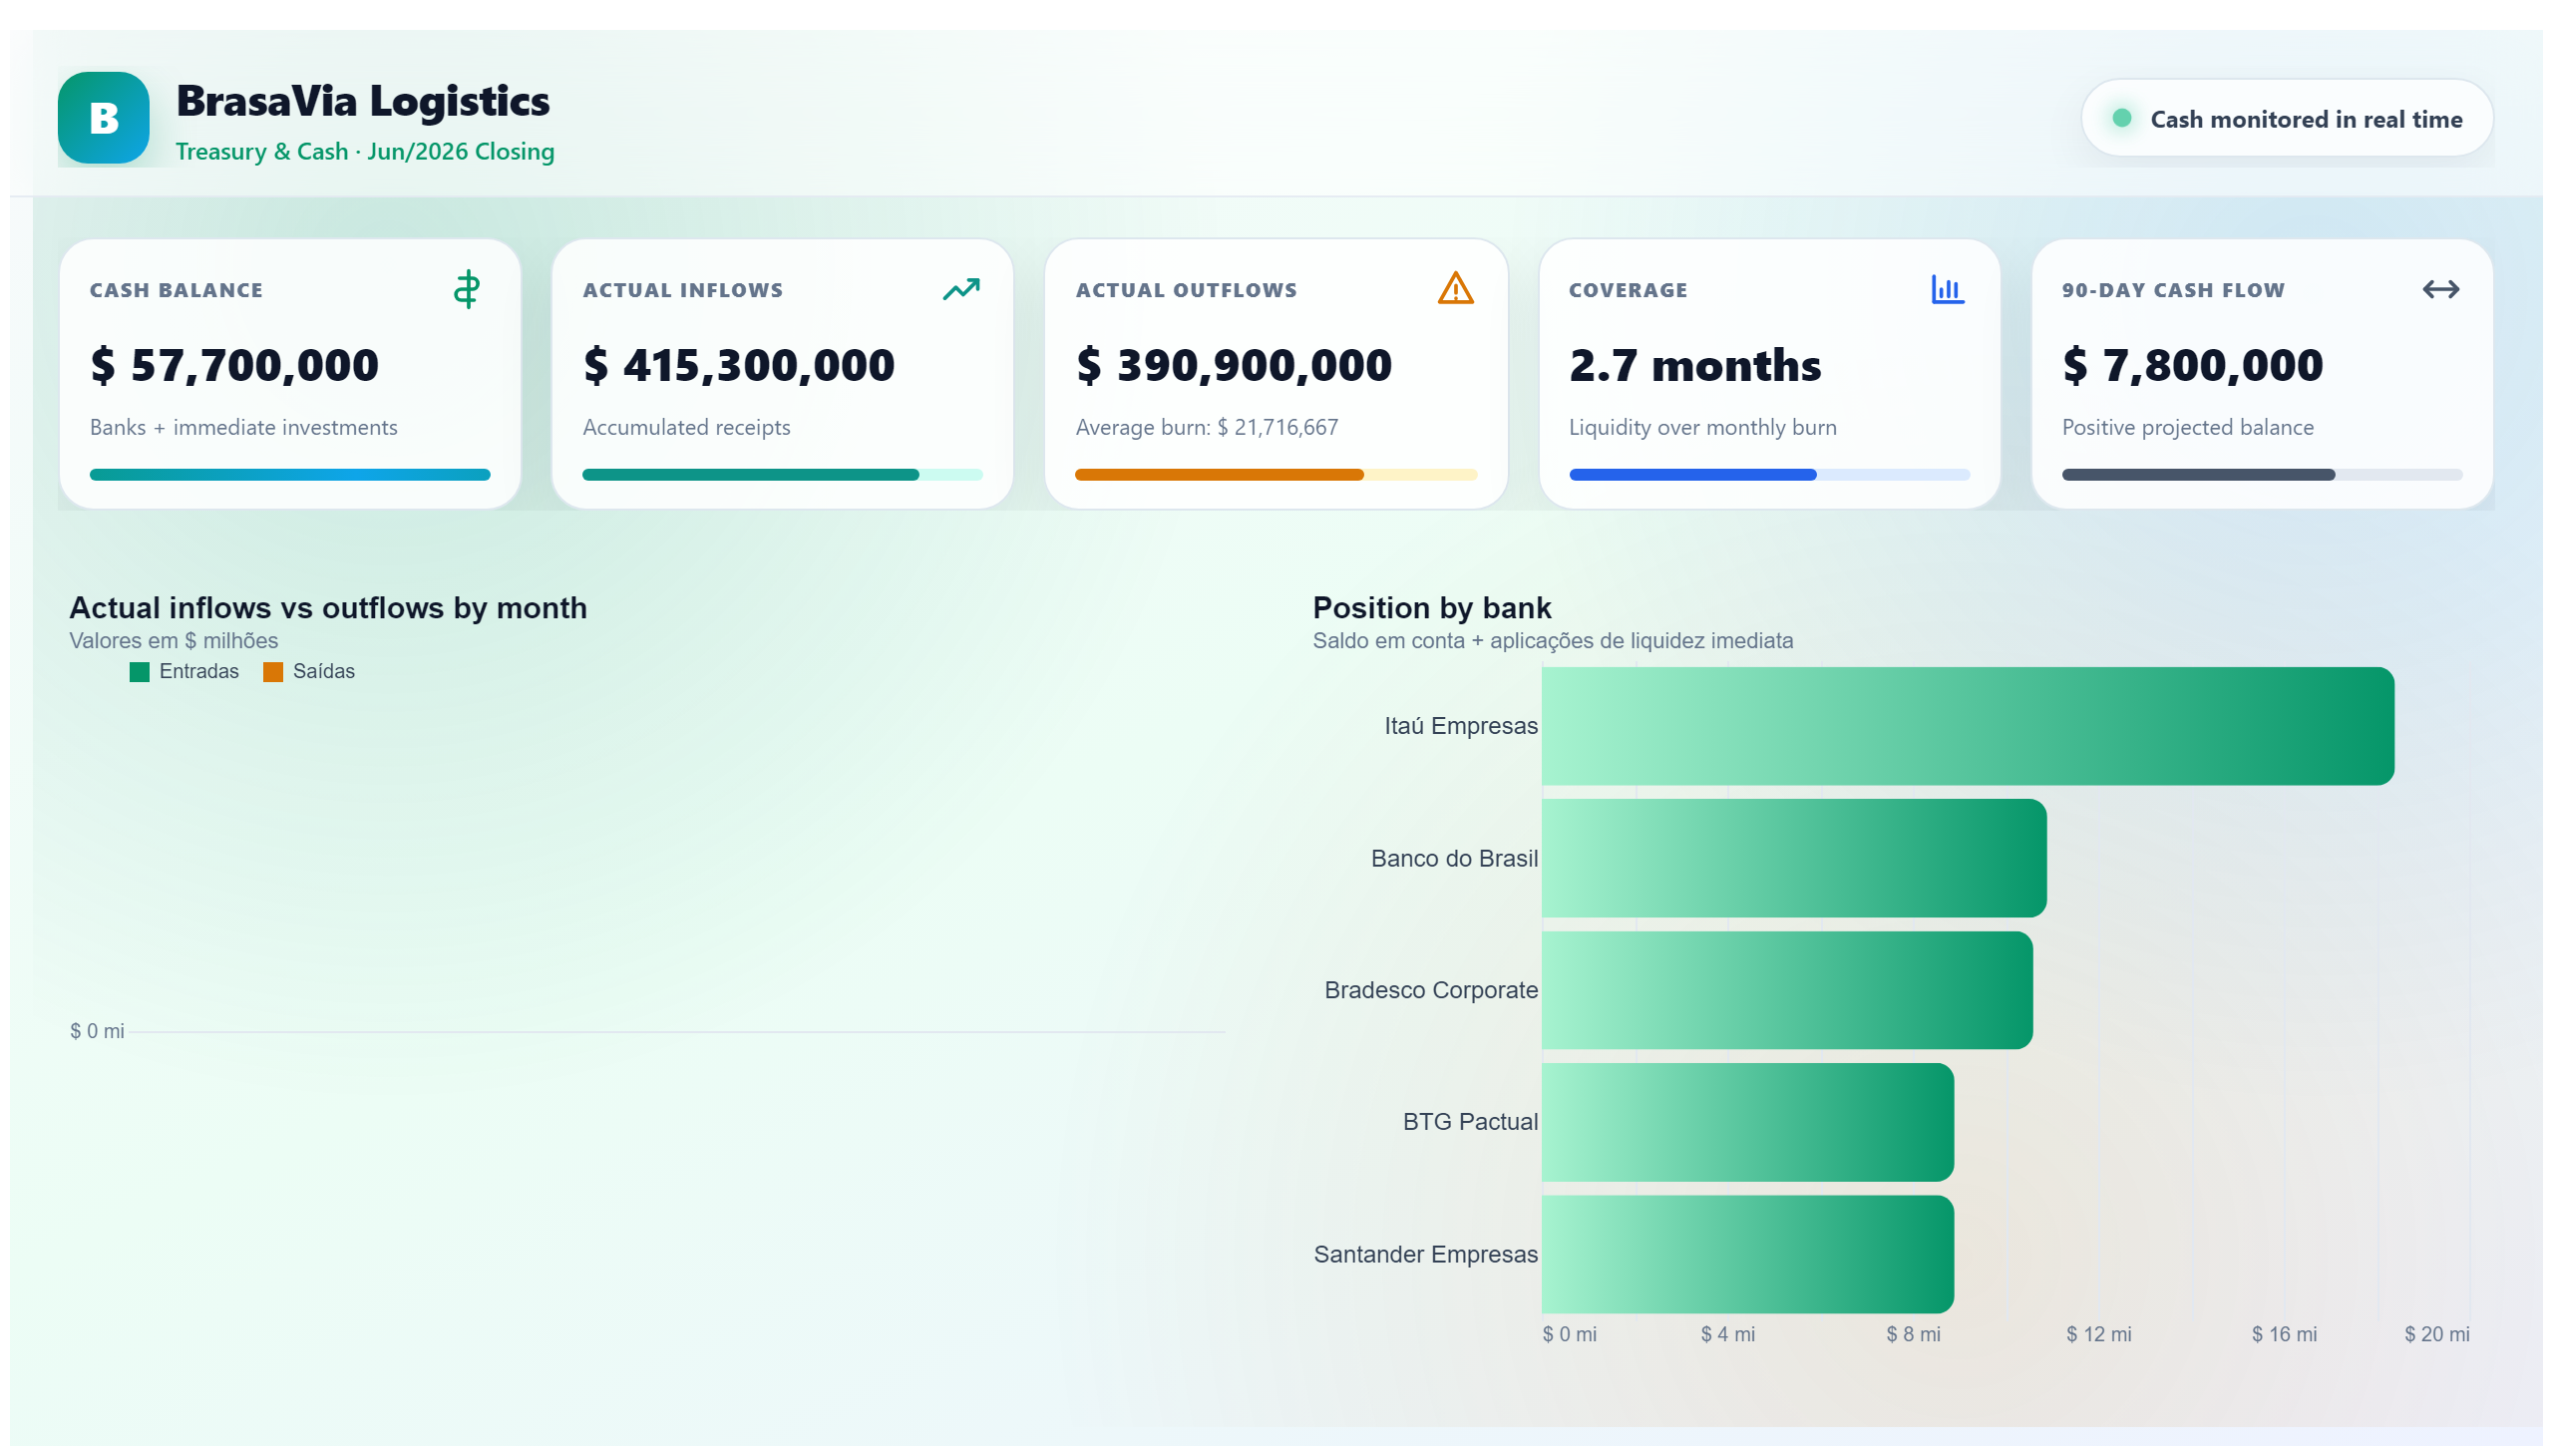
The Sample-Financials dashboard provides a comprehensive overview of a company's financial statements. It is designed to present key financial data, enabling users to analyze the company's financial health and performance over a specific period. The dashboard likely includes metrics such as revenue, expenses, profits, and other critical financial indicators that help in understanding the overall financial status.
This dashboard answers important business questions such as: How is the company performing financially? Are revenues increasing or decreasing? What are the major expense categories impacting profitability? By visualizing these data points, decision-makers can identify trends, assess financial risks, and make informed strategic decisions.
Intended primarily for finance professionals, executives, and business analysts, the Sample-Financials dashboard serves as a vital tool for monitoring financial outcomes and supporting budgeting and forecasting activities. It facilitates quick insights into financial statements, making complex data more accessible and actionable.
Frequently asked questions about this dashboard
What type of financial data is displayed in the Sample-Financials dashboard?
The dashboard displays key financial statement data such as revenues, expenses, profits, and other financial metrics relevant to assessing company performance.
Who is the primary audience for this dashboard?
The primary users are finance professionals, executives, and business analysts who need to monitor and analyze the company's financial health.
What business questions can this dashboard help answer?
It helps answer questions about financial performance trends, revenue growth or decline, expense impacts, and overall profitability.
Want a dashboard like this with your data?
We build a custom version for your business — US$ 50 per page, delivered within 7 calendar days.
Finance Power BI templates
Complete projects built by the Excelverton factory: view them live with a free account and download the PBIP as a channel subscriber (1/month) or Pro subscriber (unlimited).
Create your free account
Save favorites, build collections and use the AI assistant — at no cost.