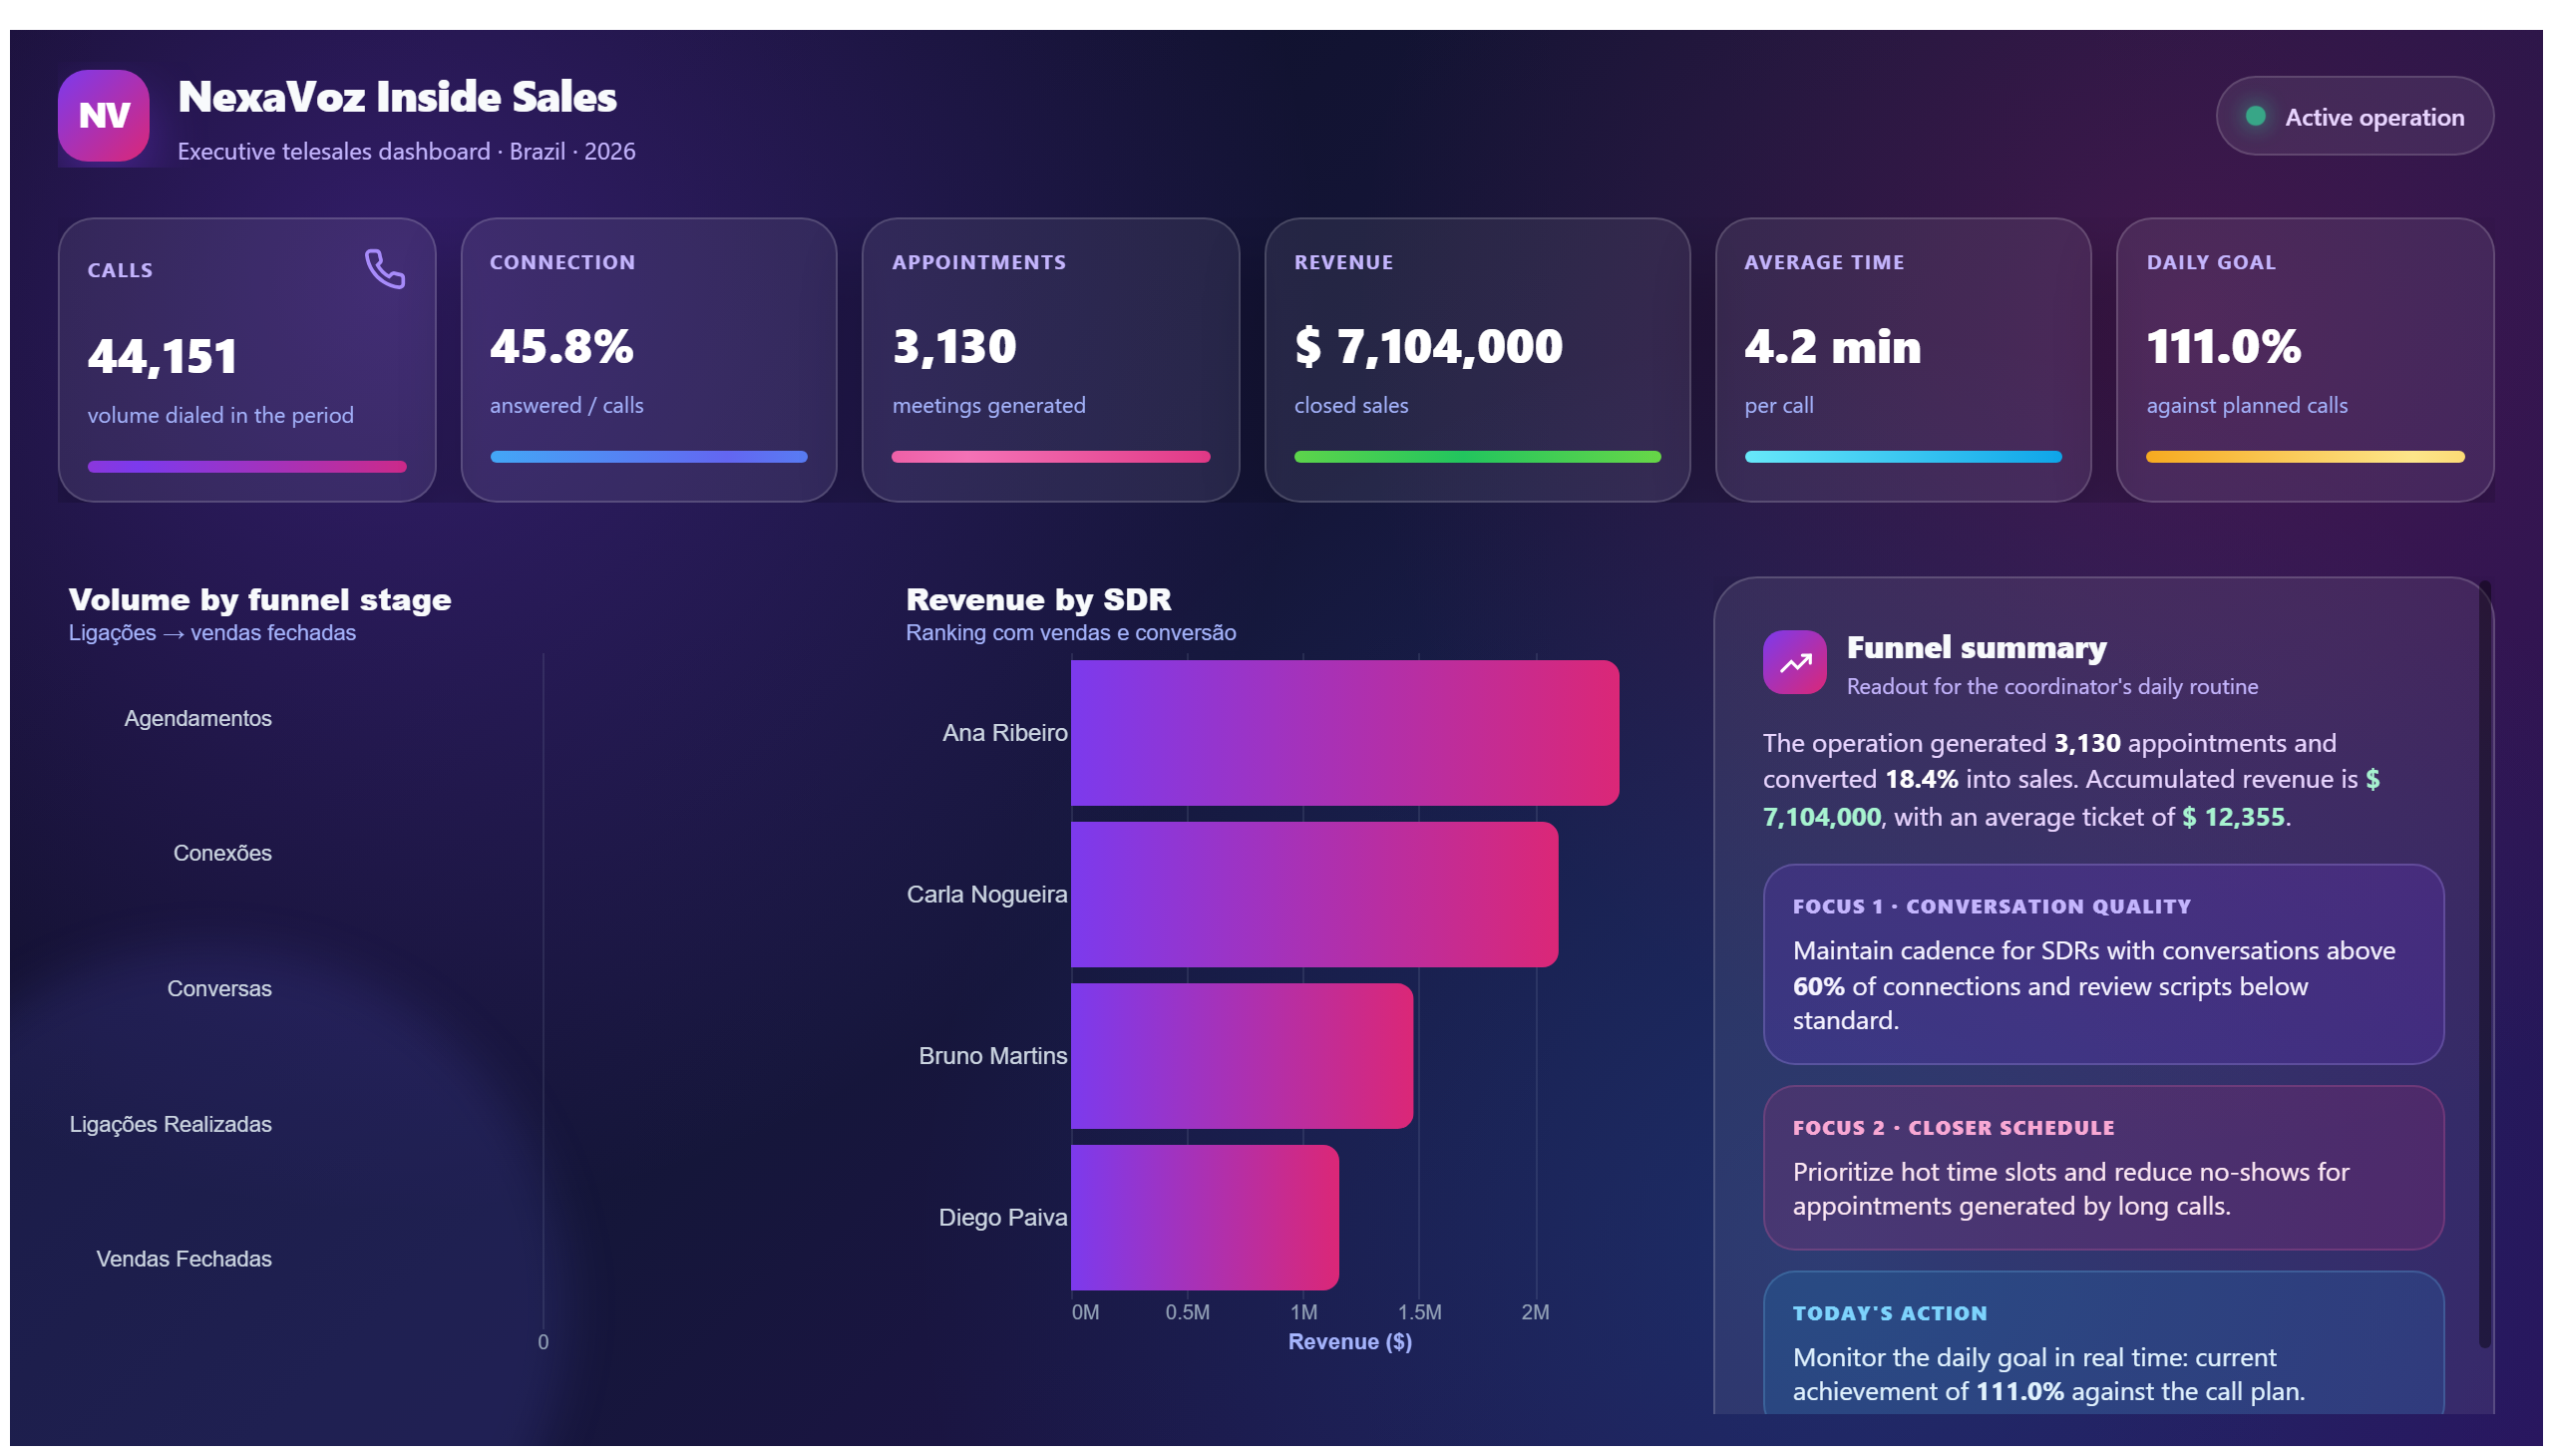
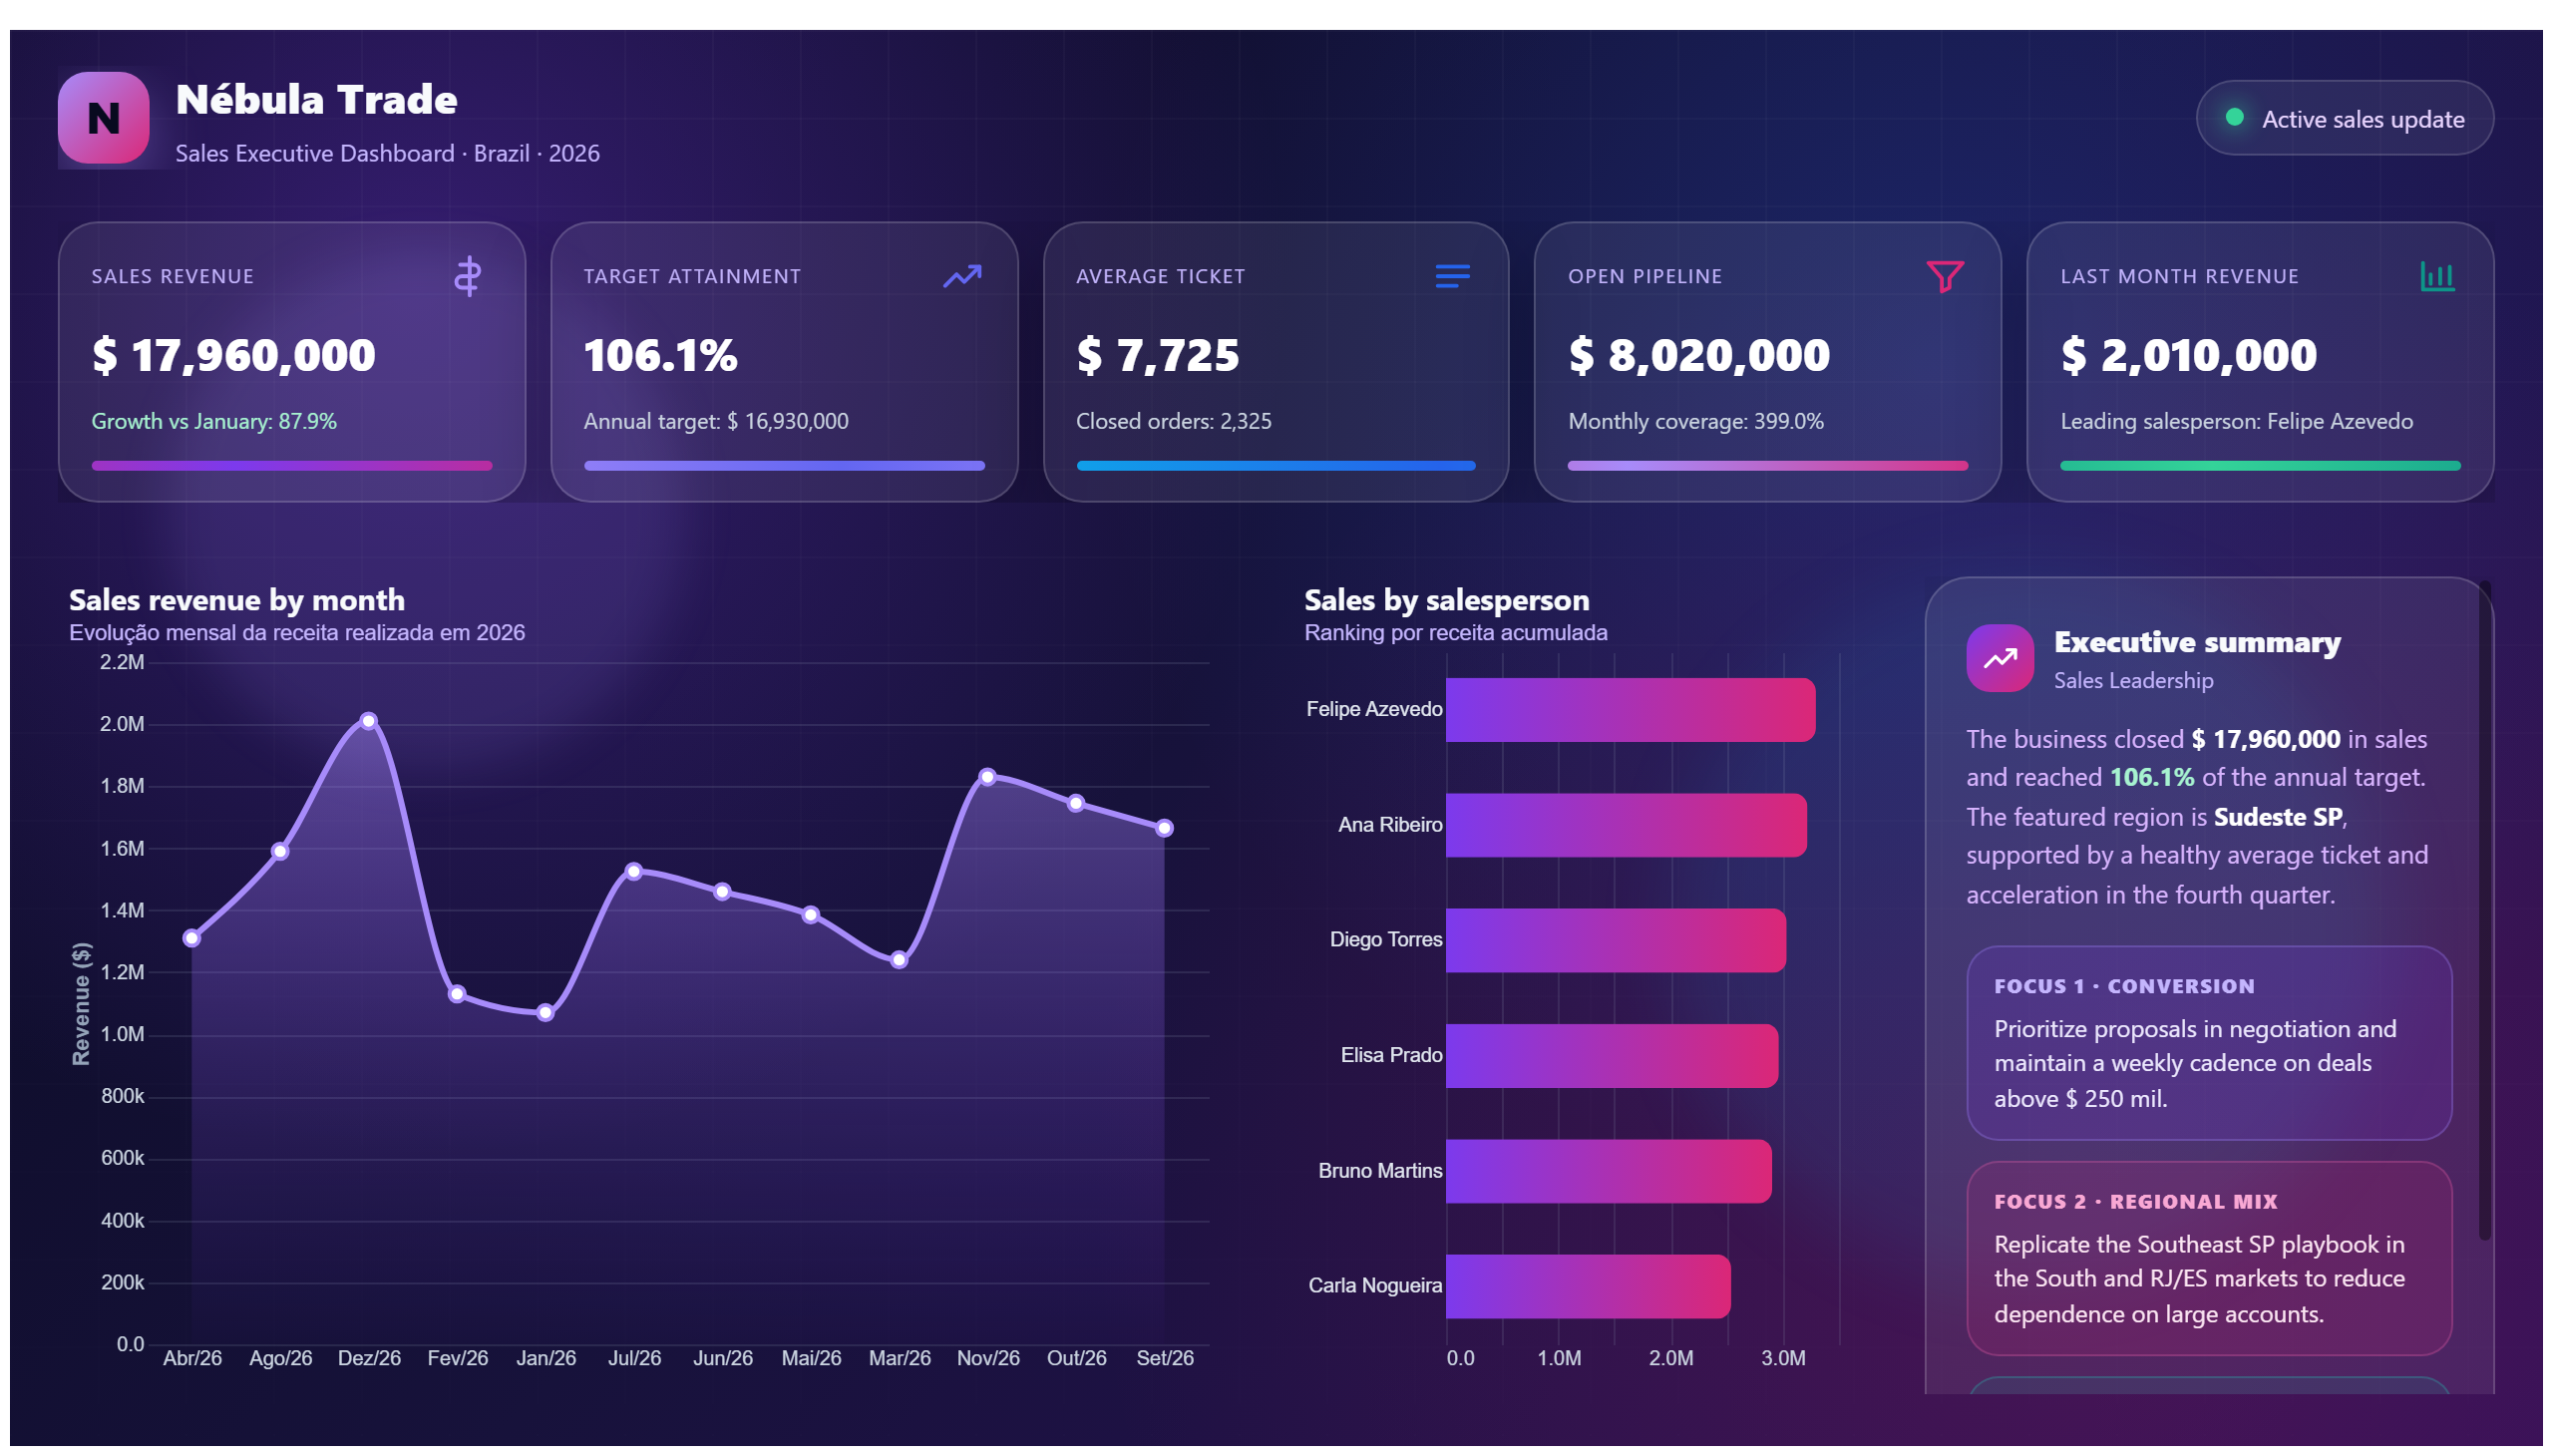
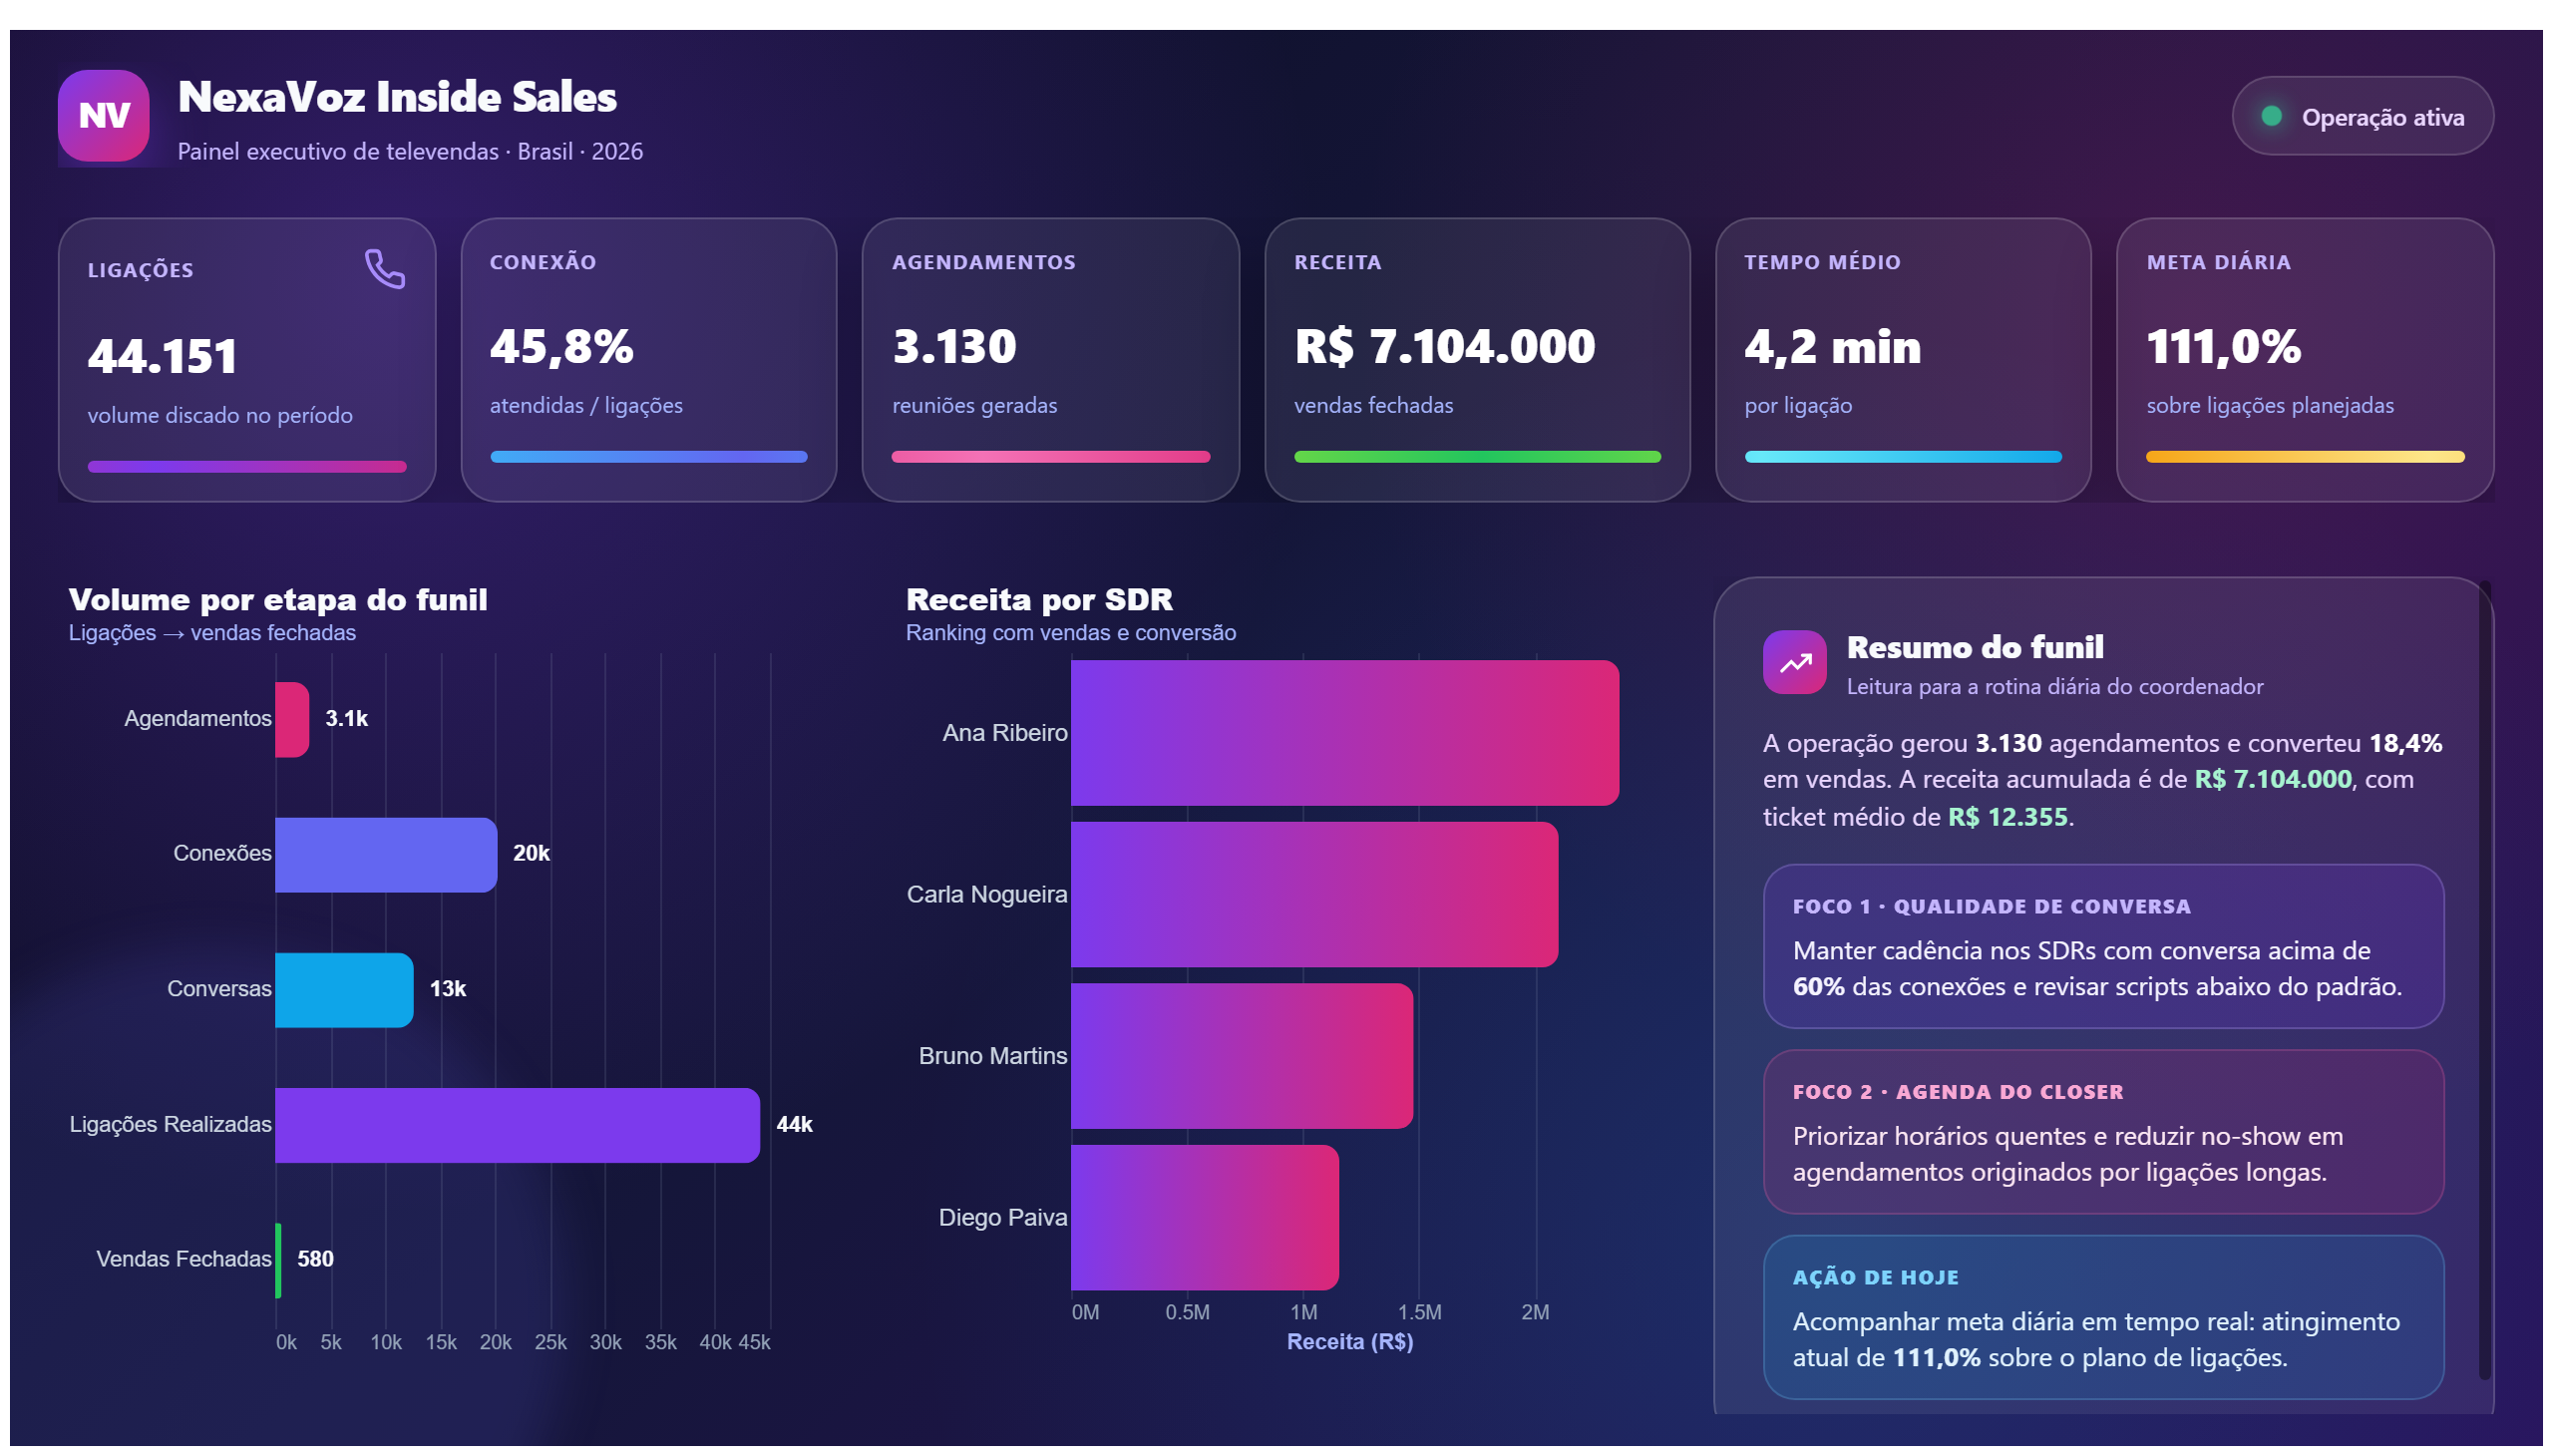
Sales Tracking
This report provides an overview of sales performance, allowing identification of trends and opportunities.
This report compares actual sales against established targets.
Save your favorite dashboards, get new templates by area and ask the AI assistant — for free.
This is a free Power BI dashboard called Actual Sales vs Target, in the Vendas domain. Explore KPIs, interactive visualizations and get inspired for your own data and business intelligence projects.
This report compares actual sales against established targets.
Actual Sales vs Target dashboard provides a clear comparison between the real sales achieved and the predefined sales targets. It is designed to give sales managers and business analysts a quick overview of how the sales team is performing against their goals over a selected period. By visualizing actual sales alongside targets, users can easily identify gaps, trends, and areas that require attention.
This report answers critical business questions such as: Are the current sales meeting the expected targets? Which products or regions are underperforming or exceeding expectations? How does sales performance vary over time? These insights enable decision-makers to adjust strategies, allocate resources efficiently, and set realistic future goals.
Overall, this dashboard serves sales directors, performance managers, and executives who need to monitor sales effectiveness and ensure that the company stays on track to meet its revenue objectives. It supports proactive management by highlighting deviations from targets early enough to take corrective actions.
The dashboard allows you to view sales performance over customizable time frames, such as monthly, quarterly, or yearly periods, enabling trend analysis and comparison.
Yes, the dashboard includes filters to break down sales data by categories like product lines or geographic regions to identify specific areas of strength or weakness.
It visually contrasts actual sales against targets using charts and indicators, making it easy to spot underperformance and focus on areas needing improvement.
We build a custom version for your business — US$ 50 per page, delivered within 7 calendar days.
Explore more Power BI dashboards from the same domain to compare KPIs, layouts and analytics models.
This report provides an overview of sales performance, allowing identification of trends and opportunities.
A coffee shop dashboard showing sales data and product analysis.
Flipkart sales report providing an overview of completed transactions.
This report analyzes the food and beverage sector, providing insights on sales and market trends.
Complete projects built by the Excelverton factory: view them live and download the PBIP — 1 free downloads every 30 days with a free account, unlimited on Pro.
Save favorites, build collections and use the AI assistant — at no cost.