Logistics Analysis of Canned Goods
This report analyzes the logistics of canned goods, focusing on efficiency and processes.
Create a free account
Save your favorite dashboards, get new templates by area and ask the AI assistant — for free.
About the Logistics Analysis of Canned Goods dashboard
This is a free Power BI dashboard called Logistics Analysis of Canned Goods, in the Logística domain. Explore KPIs, interactive visualizations and get inspired for your own data and business intelligence projects.
This report analyzes the logistics of canned goods, focusing on efficiency and processes.
Dashboard analysis
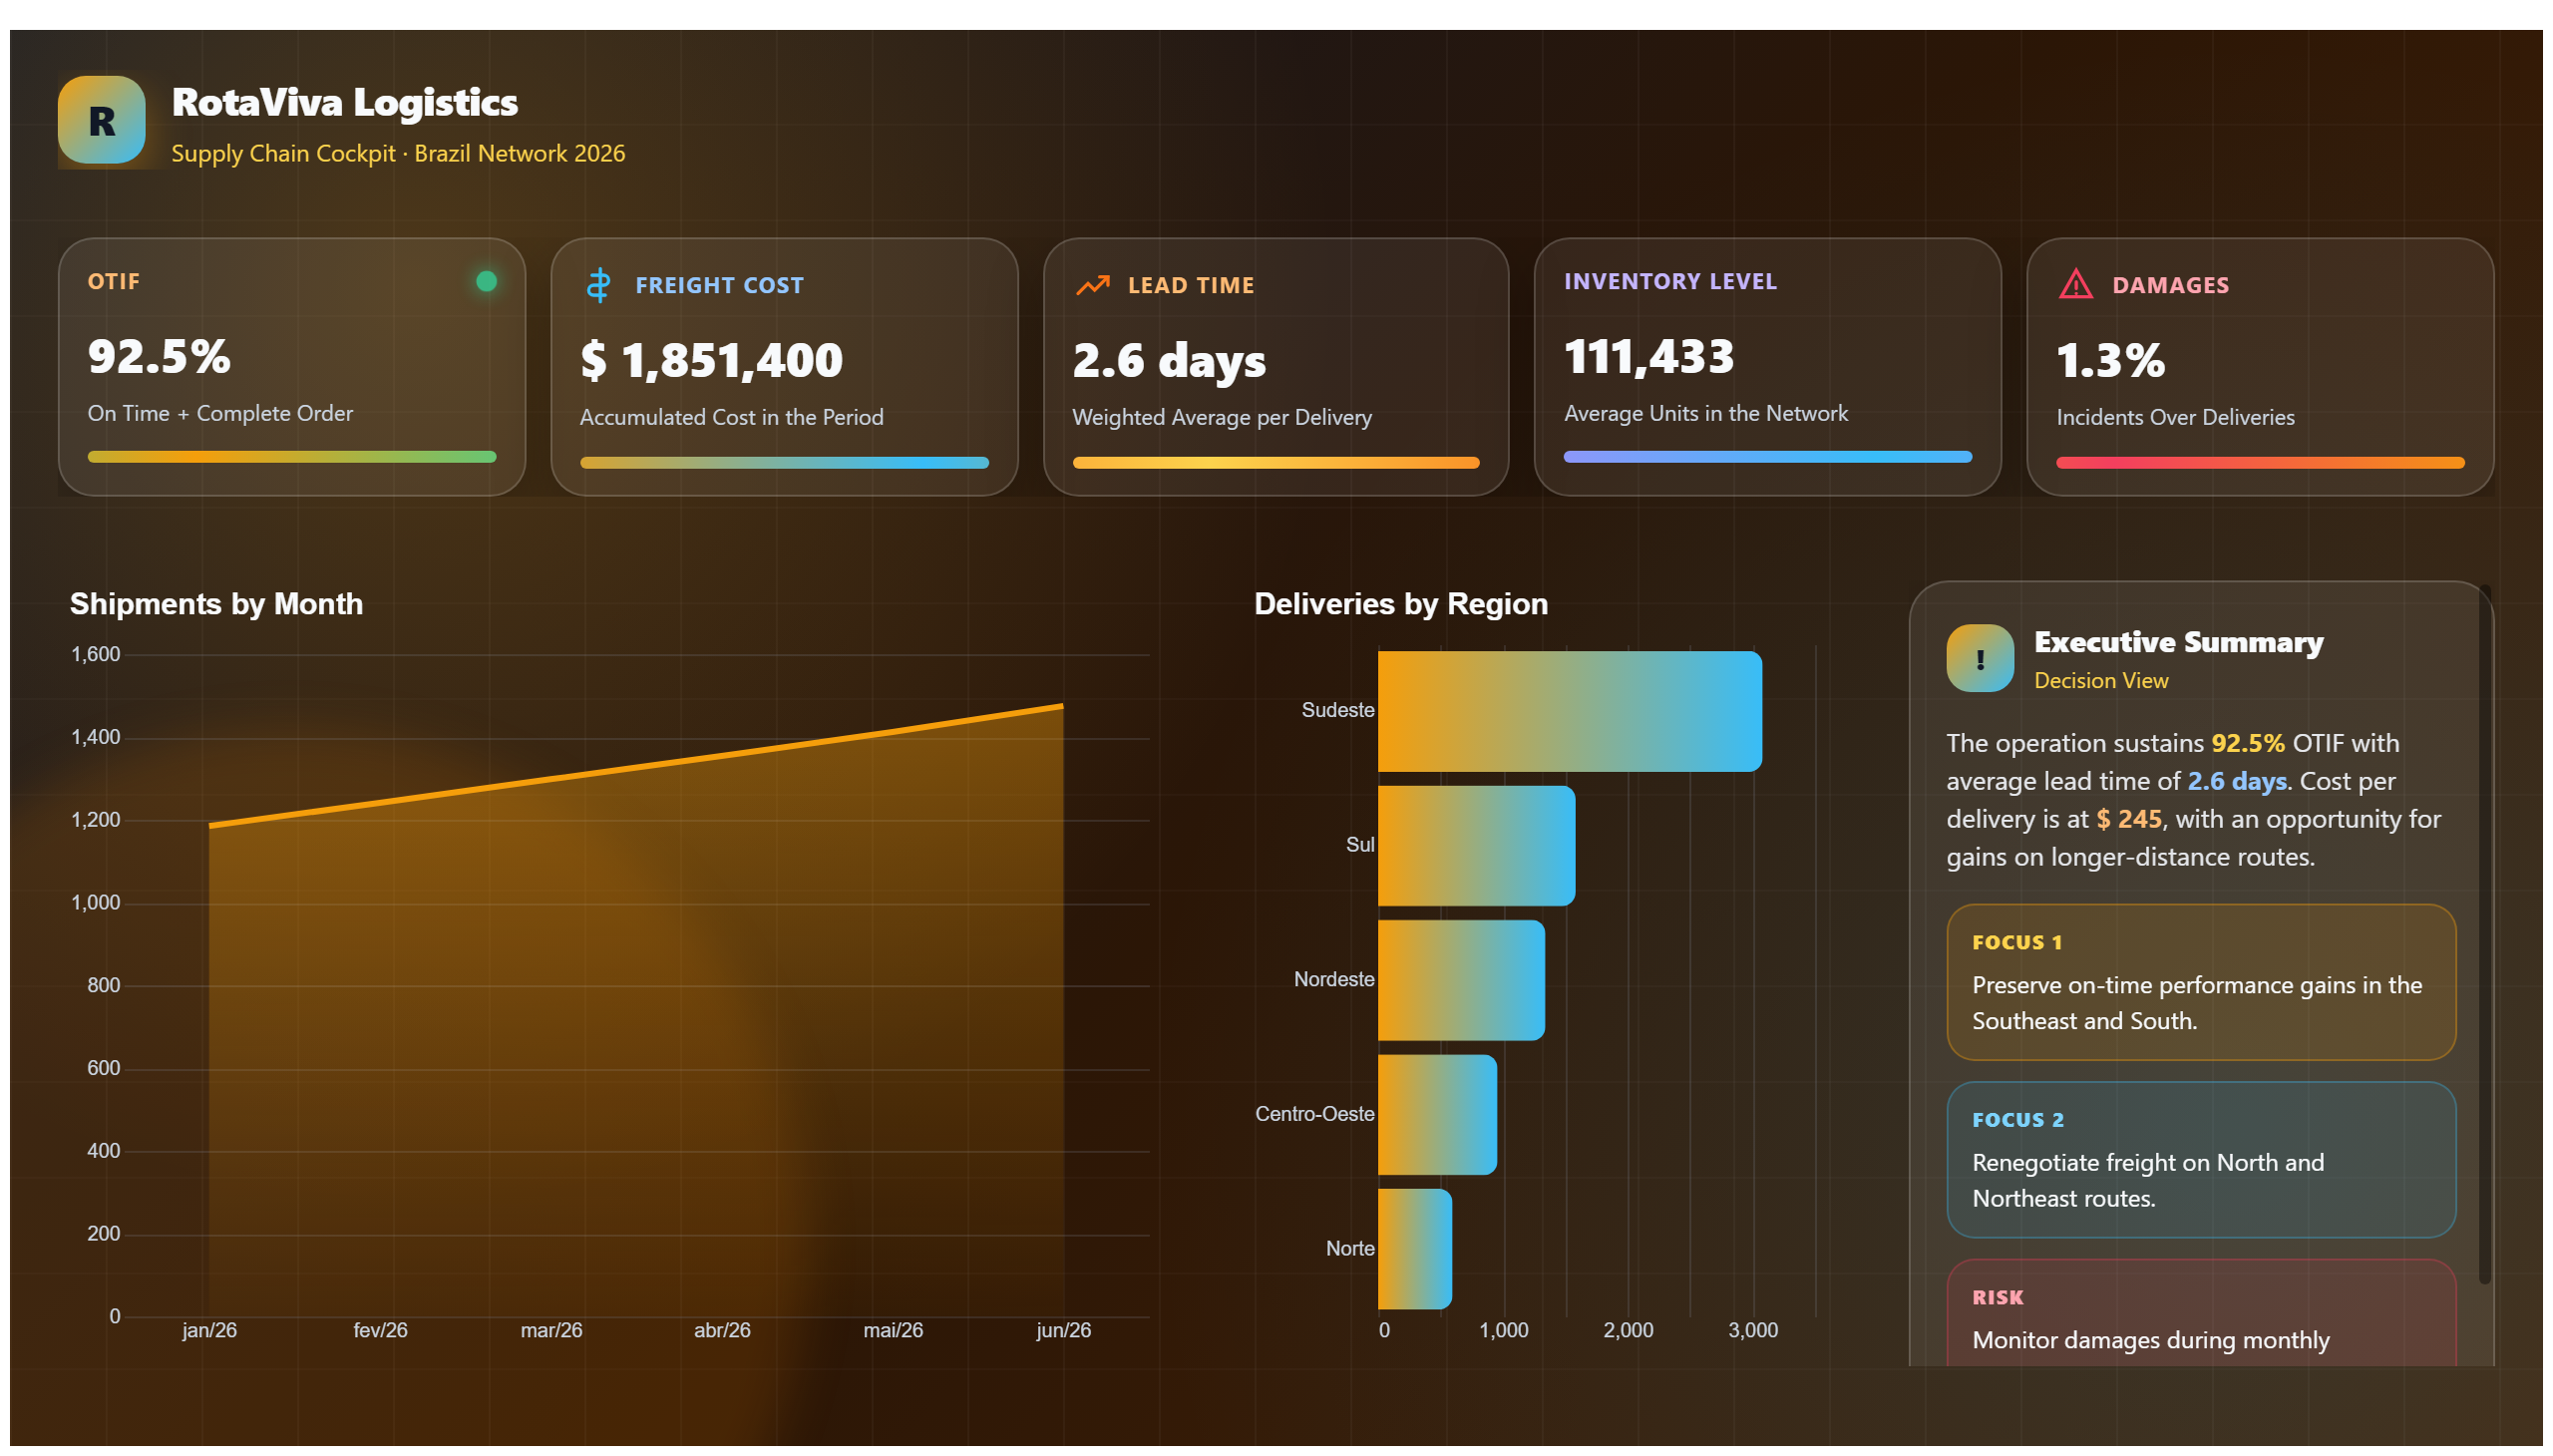
The Analisis-Logistico-Conservas dashboard provides a comprehensive overview of the logistics involved in the distribution and management of canned goods. It focuses on evaluating the efficiency of supply chain processes, highlighting key performance indicators such as delivery times, inventory turnover, and transportation costs. By visualizing these metrics, the dashboard helps identify bottlenecks and areas where operational improvements can be made.
This report answers critical business questions such as: How efficient are current logistics operations for canned products? Where are delays or inefficiencies occurring in the supply chain? What is the impact of logistics performance on overall costs and customer satisfaction? It serves supply chain managers, logistics coordinators, and data analysts who need actionable insights to optimize processes and reduce expenses while maintaining service quality.
By leveraging this dashboard, stakeholders can make informed decisions to streamline logistics workflows, improve delivery reliability, and enhance inventory management specific to the canned goods sector, ultimately driving better operational outcomes.
Frequently asked questions about this dashboard
What specific logistics metrics does the dashboard track for canned goods?
The dashboard tracks delivery times, inventory turnover rates, and transportation costs related to the logistics of canned goods.
Who is the primary audience for this dashboard?
The primary users are supply chain managers, logistics coordinators, and data analysts focused on improving logistics efficiency for canned products.
How can this dashboard help improve supply chain operations?
It helps identify inefficiencies and bottlenecks within logistics processes, enabling stakeholders to optimize delivery schedules, reduce costs, and improve inventory management.
Want a dashboard like this with your data?
We build a custom version for your business — US$ 50 per page, delivered within 7 calendar days.
Logistics Power BI templates
Complete projects built by the Excelverton factory: view them live with a free account and download the PBIP as a channel subscriber (1/month) or Pro subscriber (unlimited).
Create your free account
Save favorites, build collections and use the AI assistant — at no cost.