Dashboard preview
Dashboard PBI - Financial Performance Overview
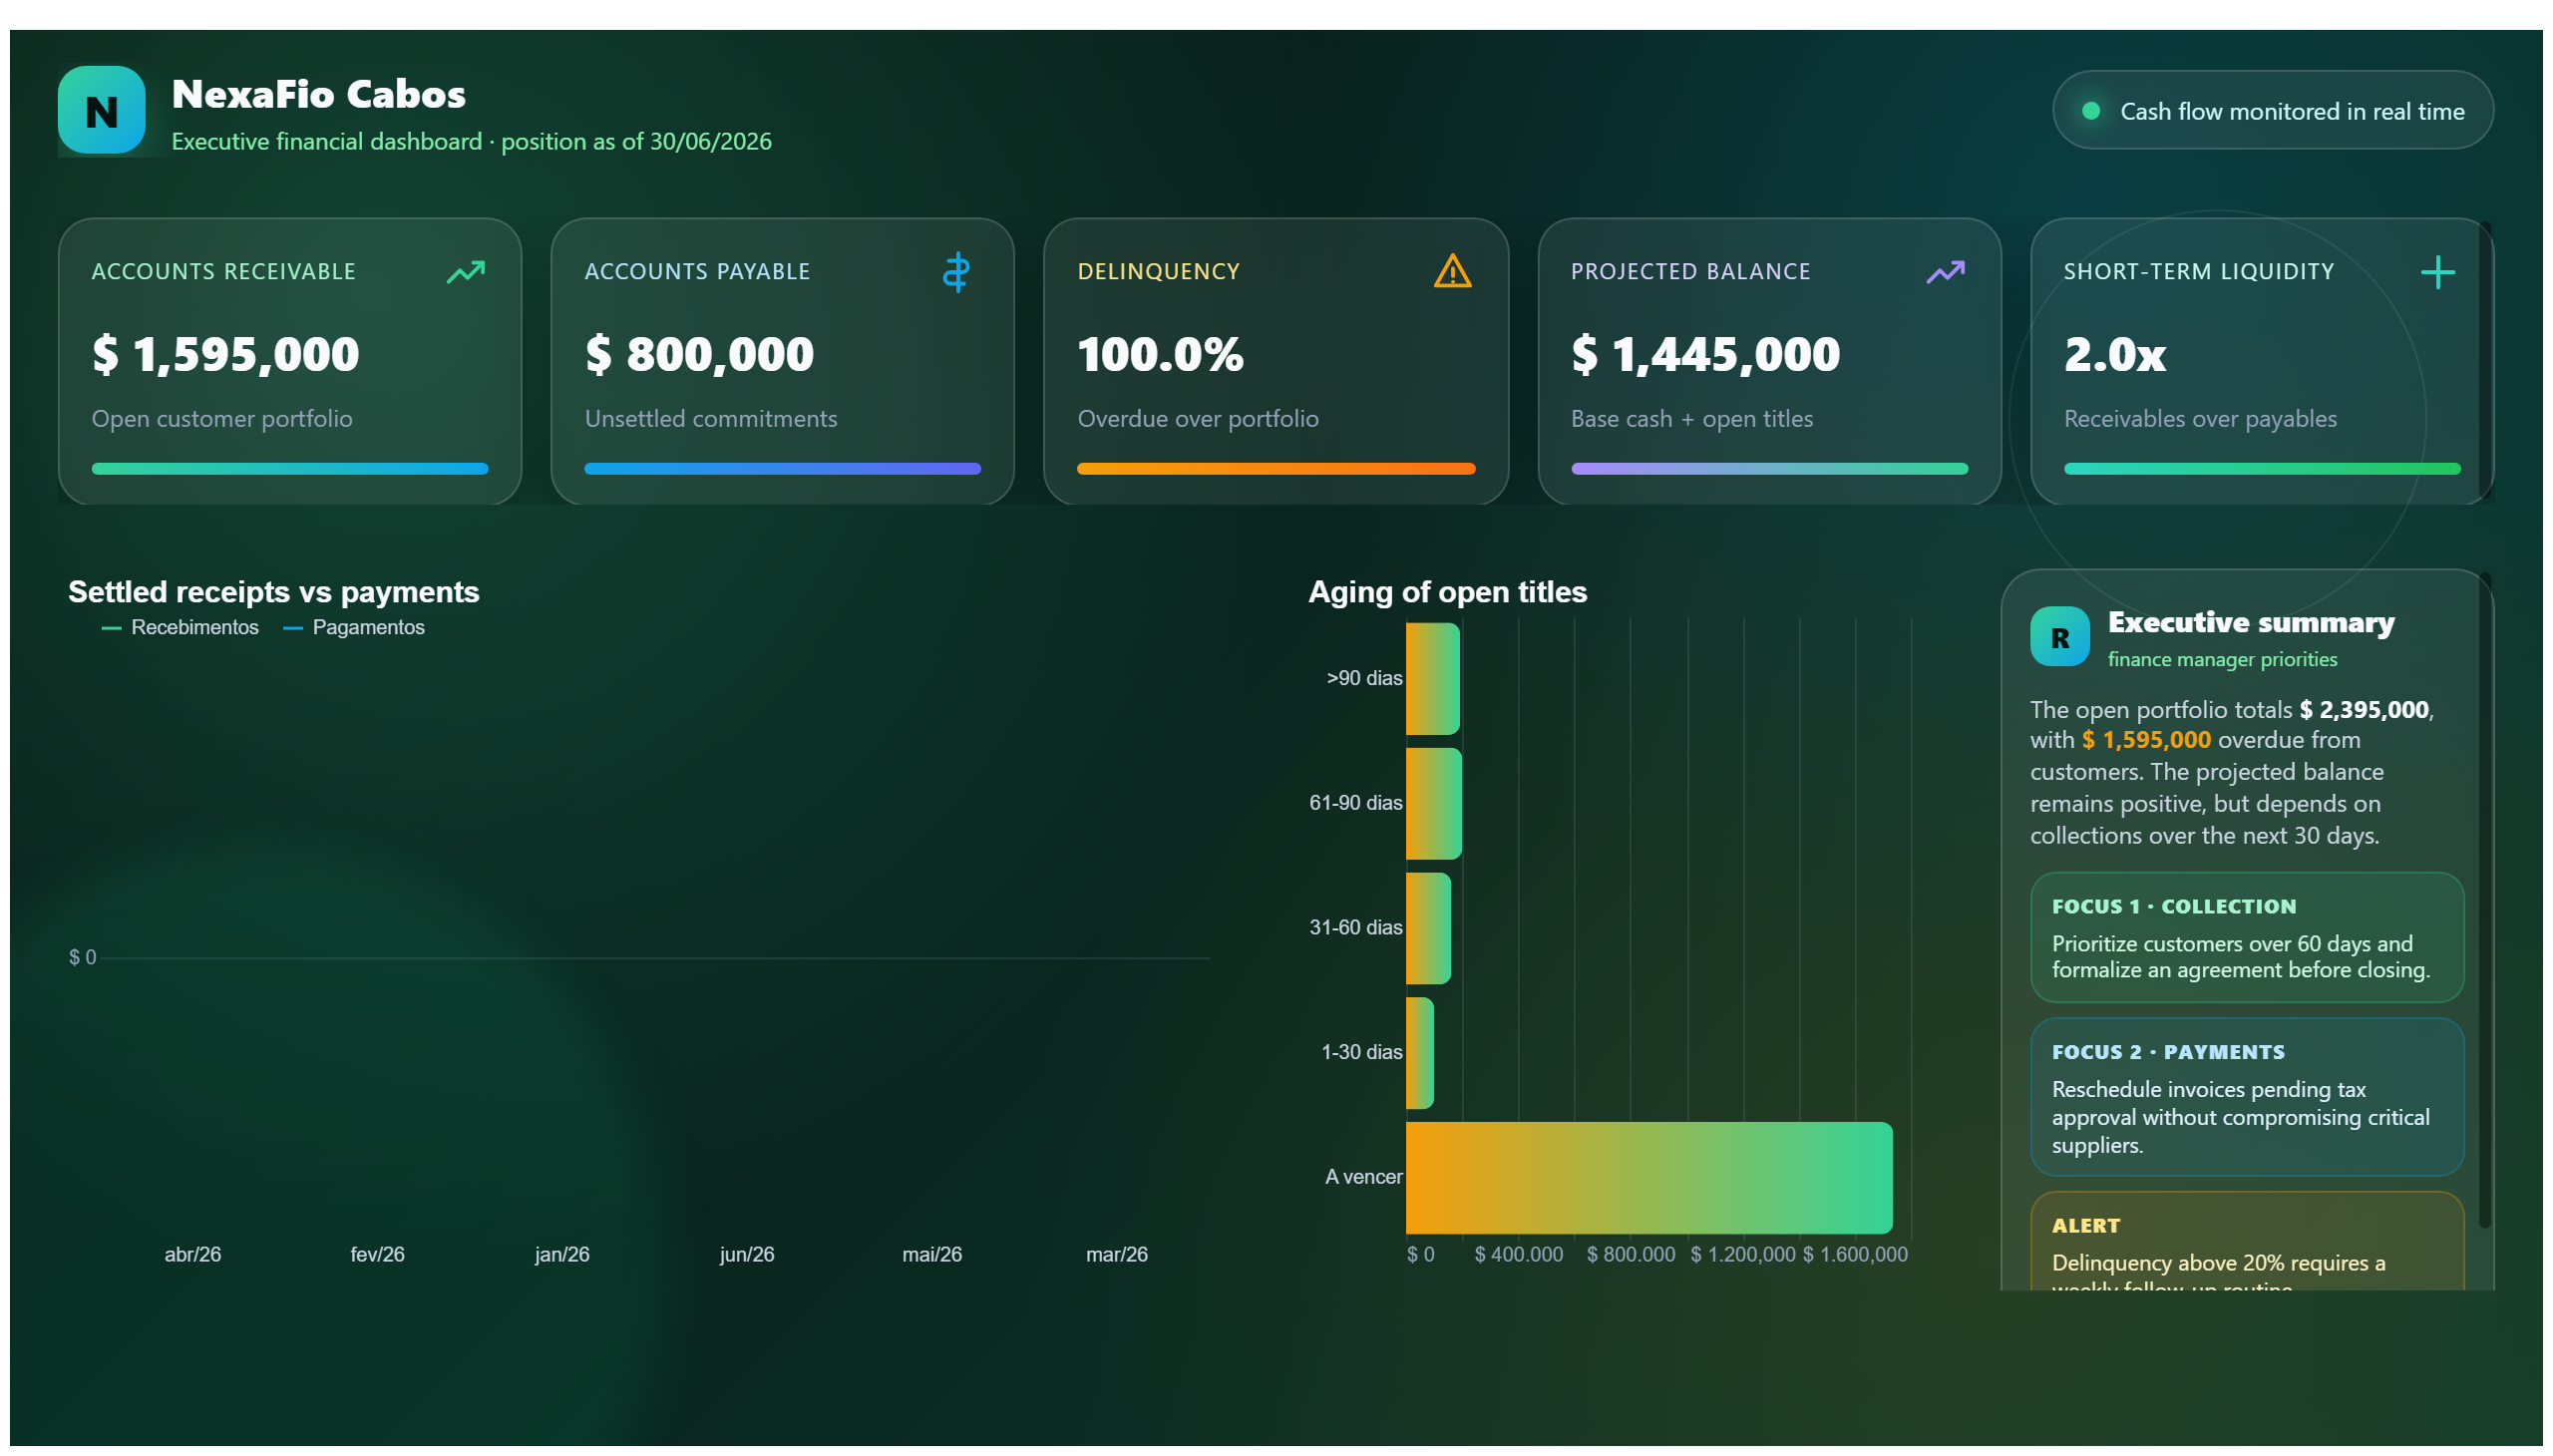
This panel offers an overview of the company's financial performance, including revenues and expenses.
This report provides a detailed view of the company's finances.
Save your favorite dashboards, get new templates by area and ask the AI assistant — for free.
This is a free Power BI dashboard called Dashboard Financeiro, in the Financeiro domain. Explore KPIs, interactive visualizations and get inspired for your own data and business intelligence projects.
This report provides a detailed view of the company's finances.
Financial Dashboard offers a comprehensive overview of the company's financial status, consolidating key metrics and trends into an intuitive report. It enables stakeholders to monitor revenue streams, expenses, and profitability in real time, facilitating informed decision-making.
This dashboard answers critical business questions such as: How is the company's financial performance evolving over time? Where are the major cost centers impacting profitability? Which revenue sources contribute most significantly to overall income? By providing these insights, it supports finance teams, executives, and analysts in identifying opportunities for cost optimization and growth.
Designed for financial professionals and business leaders, this report enhances transparency and accountability within the organization. Its clear visualizations and categorized financial data empower users to quickly assess financial health and align strategies accordingly.
The dashboard highlights key metrics such as total revenue, expenses, net profit, and financial trends over specific periods.
The primary audience includes finance teams, company executives, and analysts responsible for financial planning and performance monitoring.
Yes, by analyzing expense categories and profitability trends, users can pinpoint areas where costs can be optimized.
We build a custom version for your business — US$ 50 per page, delivered within 7 calendar days.
Complete projects built by the Excelverton factory: view them live with a free account and download the PBIP as a channel subscriber (1/month) or Pro subscriber (unlimited).
Save favorites, build collections and use the AI assistant — at no cost.