Bank Statement Dashboard
This dashboard provides an overview of bank transactions.
Create a free account
Save your favorite dashboards, get new templates by area and ask the AI assistant — for free.
About the Bank Statement Dashboard dashboard
This is a free Power BI dashboard called Bank Statement Dashboard, in the Financeiro domain. Explore KPIs, interactive visualizations and get inspired for your own data and business intelligence projects.
This dashboard provides an overview of bank transactions.
Dashboard analysis
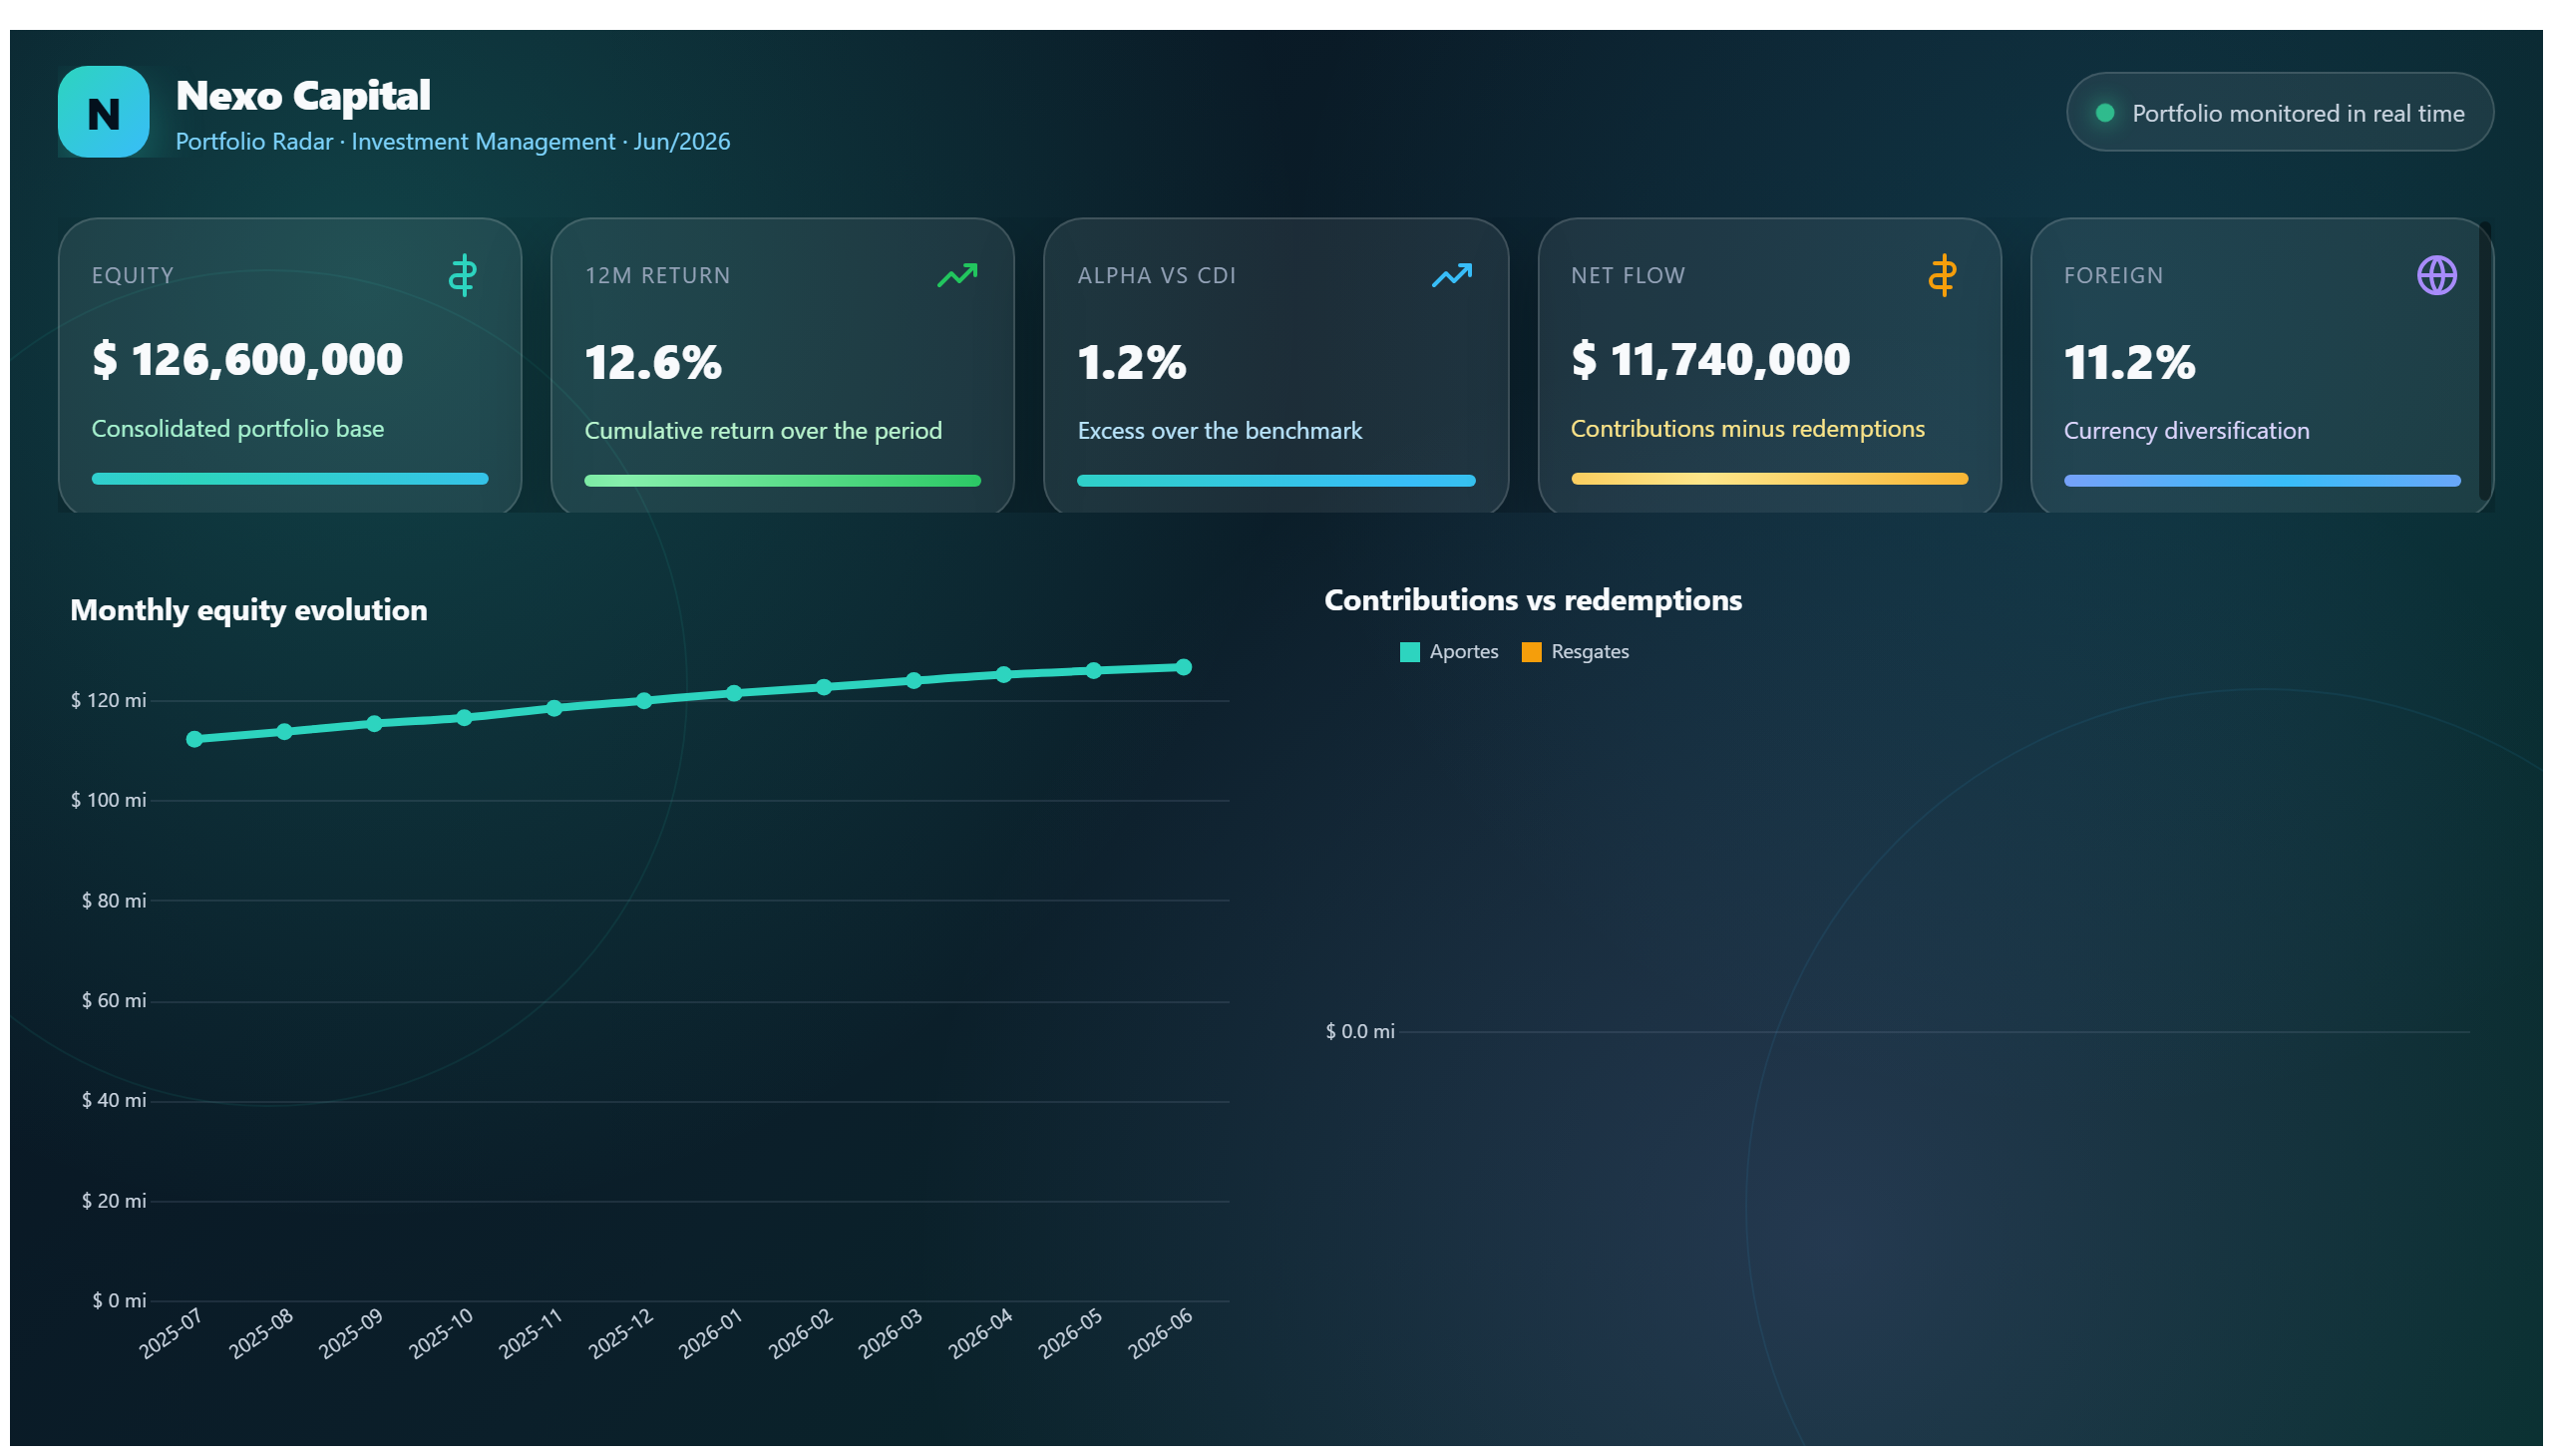
The Bank Statement Dashboard offers a comprehensive overview of bank transactions, providing users with clear insights into their financial activities. It consolidates transaction data to help users monitor cash flow, track spending patterns, and identify any irregularities or unexpected expenses. This dashboard is particularly useful for finance professionals and managers who need to maintain control over financial operations and ensure accurate record-keeping.
By visualizing transaction details, the dashboard answers key business questions such as: What are the main categories of expenses? How do transaction volumes vary over time? Are there any unusual or high-value transactions that require attention? These insights enable better financial decision-making, budgeting, and risk management.
Overall, this dashboard serves as a vital tool for financial management teams aiming to streamline transaction monitoring and improve transparency within their organizations.
Frequently asked questions about this dashboard
What types of transactions are displayed in the dashboard?
The dashboard displays all bank transactions, including deposits, withdrawals, and transfers, providing a full view of financial activity.
Can the dashboard help identify unusual transactions?
Yes, by highlighting transaction amounts and trends over time, the dashboard helps users spot irregular or unexpected transactions.
Who is the primary audience for this dashboard?
The primary users are finance professionals and managers responsible for overseeing financial transactions and ensuring accurate financial management.
Want a dashboard like this with your data?
We build a custom version for your business — US$ 50 per page, delivered within 7 calendar days.
Finance Power BI templates
Complete projects built by the Excelverton factory: view them live with a free account and download the PBIP as a channel subscriber (1/month) or Pro subscriber (unlimited).
Create your free account
Save favorites, build collections and use the AI assistant — at no cost.